
Diagnosis of breast cancer by tissue analysis
Introduction
Needle biopsy uses a system, known as the Mammotome breast biopsy system. The FDA (Food and Drug Administration) approved Mammotome in 1996; the hand-held version of the Mammotome received FDA clearance in September 1999. A large needle is inserted into the suspicious area using ultrasound or stereotactic guidance. The Mammotome is then used to gently vacuum tissue from the suspicious area. Additional tissue samples can be obtained by rotating the needle. This procedure can be performed with the patient lying on her stomach on a table. If the hand-held device is used, the patient may lie on her back or in a seated position.
There have been no reports of serious complications resulting from the Mammotome breast biopsy system. Women interested in this procedure should talk with their doctor.
Digital mammography is a technique for recording X-ray images in computer code instead of on X-ray film, as with conventional mammography. The images are displayed on a computer monitor and can be enhanced (lightened or darkened) before they are printed on film. Images can also be manipulated; the radiologist can magnify or zoom in on an area. From the patient’s perspective, the procedure for a mammogram with a digital system is the same as for conventional mammography (1).
Digital mammography may have some advantages over conventional mammography. The images can be stored and retrieved electronically, which makes long-distance consultations with other mammography specialists easier.
The first digital mammography (2) system received U.S. Food and Drug Administration (FDA) approval in 2000. An example of a digital mammography system is the Senographe 2000D. Women considering digital mammography should talk with their doctor or contact a local FDA-certified mammography center to find out if this technique is available at that location. Only facilities that have been certified to practice conventional mammography and have FDA approval for digital mammography may offer the digital system.
Many more techniques are available other than the cytogenetic processes, however, these are imaging technologies to detect, diagnose, and characterize breast.
Previous works
Numerous promising approaches are coming up, few of those only stated here out of our study, and these are very recent.
V. Mallapragada et al., October, 2007, presented (3,4) a new concept for real-time manipulation of a tumor using a robotic force controller that monitored the image of the tumor to generate appropriate force to position the tumor at a desired location. The idea was to demonstrate that it was possible to manipulate a tumor in real-time by applying controlled external force in an automated way such that the tumor did not deviate from the path of the needle. The success of this approach had the potential to reduce the number of attempts a surgeon make to capture the desired tissue specimen, minimized tissue damage, improved speed of biopsy, and reduced patient discomfort.
Cigdem Gunduz et al., 2004, reported a computational method that modeled a type of brain cancer using topological properties of cells in the tissue image. They constructed the graphs based on the locations of cells within the image. They used the Waxman model in their experiment (5).
C. Cagatay Bilgin et al., 2007, classified (6) the breast cancer tissues using graph theory. Image segmentation approach was used and Euclidean Distances were calculated between vertices (6). Cell Graphs were generated by considering the cell locations. Approach was same to the greater extent with the work of Cigdem Gunduz et al., 2004.
These approaches toward automatic detection of cancer were actually failed because the types of cancers identified more and more.
A.M. Tang et al., 2008, proposed, simultaneous capturing of ultrasound (US) and magnetic resonance (MR) images allowed fusion of information obtained from both modalities. An MR-compatible US system where MR images were acquired in a known orientation with respect to the US imaging plane and concurrent real-time imaging could be achieved. Compatibility of the two imaging devices was a major issue in the physical setup. Tests were performed to quantify the radio frequency (RF) noise introduced in MR and US images, with the US system used in conjunction with MRI scanner of different field strengths (0.5 and 3 T). Furthermore, simultaneous imaging was performed on a dual modality breast phantom in the 0.5 T open bore and 3 T close bore MRI systems to aid needle-guided breast biopsy. Fiducial based passive tracking and electromagnetic based active tracking were used in 3 T and 0.5 T, respectively, to establish the location and orientation of the US probe inside the magnet bore. Their results indicated that simultaneous US and MR imaging were feasible with properly-designed shielding, resulting in negligible broadband noise and minimal periodic RF noise in both modalities. US could be used for real time display of the needle trajectory, while MRI could be used to confirm needle placement (7).
C. Zhu et al., 2009, have explored (8) the use of a fiber-optic probe for in vivo fluorescence spectroscopy of breast tissues during percutaneous image-guided breast biopsy. A total of 121 biopsy samples with accompanying histological diagnosis were obtained clinically and investigated in their study. The tissue spectra were analyzed using partial least-squares analysis and represented using a set of principal components (PCs) with dramatically reduced data dimension. For nonmalignant tissue samples, a set of PCs that account for the largest amount of variance in the spectra displayed correlation with the percent tissue composition. For all tissue samples, a set of PCs was identified using a Wilcoxon rank-sum test as showing statistically significant differences between: (I) malignant and fibrous/benign; (II) malignant and adipose; and (III) malignant and nonmalignant breast samples. These PCs were used to distinguish malignant from other nonmalignant tissue types using a binary classification scheme based on both linear and nonlinear support vector machine (SVM) and logistic regression (LR). For the sample set investigated in this study, the SVM classifier provided a cross-validated sensitivity and specificity of up to 81% and 87%, respectively, for discrimination between malignant and fibrous/benign samples, and up to 81% and 81%, respectively, for discriminating between malignant and adipose samples. Classification based on LR was used to generate receiver operator curves with an area under the curve (AUC) of 0.87 for discriminating malignant versus fibrous/benign tissues, and an AUC of 0.84 for discriminating malignant from adipose tissue samples. This study demonstrated the feasibility of performing fluorescence spectroscopy during clinical core needle breast biopsy, and the potential of that technique for identifying breast malignancy in vivo.
Lin Yang et al., 2007, introduced a Grid-enabled CAD to perform automatic analysis of imaged histopathology breast tissue specimens (9). More than 100,000 digitized samples (1,200×1,200 pixels) were processed on the Grid. They analyzed results for 3,744 breast tissue samples, which were originated from four different institutions using diaminobenzidine (DAB) and hematoxylin staining. Both linear and nonlinear dimension reduction techniques were compared, and the best one was applied to reduce the dimensionality of the features. The results shown that the Gentle Boosting using an eight node CART decision tree as the weak learner provided the best result for classification. The algorithm has an accuracy of 86.02% using only 20% of the specimens as the training set.
Our work
We used free Tissue Blocks downloaded from OriGene Technologies, Inc, 2009 (10). Here in our experiment, 18 invasive breast cancer tissues from different 18 patients and 8 non-cancerous falsely detected breast tissues from 8 different normal females are considered. Each of the 24-bit BMP Image size is 640×480 Pixels.
24-bit color image to 256-color gray image
(I) Take this 24-Bit BMP file as Input file and open the file in Binary Mode, (Size M × M).
(II) Copy the ImageInfo (First 54 byte) of the Header from Input 24-Bit Bmp file to a newly created BMP file and edit this Header by changing filesize, Bit Depth, Colors to confirm to 8-Bit BMP.
(III) Copy the ColorTable from a sample gray scale Image to this newly created BMP at 54th Byte place on words.
(IV) Convert the RGB value to Gray Value using the following formula:
(i) blueValue = (0.299× redValue + 0.587× greenValue + 0.114× blueValue);
(ii) greenValue = (0.299× redValue + 0.587× greenValue + 0.114× blueValue);
(iii) redValue = (0.299× redValue + 0.587× greenValue + 0.114× blueValue);
(iv) grayValue = blueValue = greenValue = redValue;
(V) Write to new BMP file.
Take 24-bit BMP color image as input. Then convert it to 256-color Gray Scale image by following this algorithm. This 256-color Gray Scale image is the output of the algorithm. In this algorithm, first read the red, blue and green value of each pixel and then after formulation, three different values are converted into gray value, stated in Step 4.
256-color gray image to bi-color (using Pixel Clustering on Threshold Value, T)
(I) Open 256-color Image (Size M × M);
(II) Read a Pixel value;
(III) If the Pixel Intensity value less than or equal to T [128] then make it 0 Else make it 255 and write into same Pixel Location;
(IV) Go to Step 2 until end of file;
(V) Close file.
This algorithm is actually used here to convert the Gray Image to Bi-color (Monochrome Image). In some cases we can say this is the Edge Detection Algorithm set on a Threshold Value.
Cell representation algorithm on spatial domain
(I) Open Bi-color Image (Size M × M);
(II) Set a 2D Integer Array (equivalent to size of Bi-color Image, M × M);
(III) Read a Pixel value;
(IV) Store corresponding location of 2D Array (If the Pixel value is 255, make it 1 in our case);
(V) Go to Step 2 until end of file;
(VI) Close file;
(VII) Draw the Graph on 2D Space using that generated Binary Matrix;
(VIII) End.
The Generated Binary Matrix can be used for future statistical analysis to make the system automatic, definitely, with other biological characteristics of Breast Cancer Cells. Here in this work we compare those Graphs and suggest for further pathological test or for no need of test.
Results
Here the challenge is Mammogram and Digital Biopsy. Problem with mammogram may arise biopsy also. Now we are considering some kind of mammogram analysis. We have noticed same problem with Biopsy.
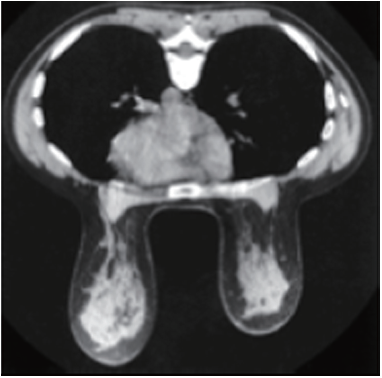
In most individuals the bulk of the breast extends from the second to the seventh rib. Since breast tissues often curve around the lateral margin of the pectoralis major muscle (Figure 1), the orientation of the muscle is important for optimal mammographic positioning. The pectoralis major muscle spreads like a fan across the chest wall. Portions of the pectoralis major muscle attach to the clavicle, the lateral margin of the scapula, costal cartilage, and the aponeurosis of the external oblique muscles of the abdomen. All these fibers converge on and attach to the greater tubercle of the humerus. The free fibers predominantly run obliquely over the chest from the medial portion of the thorax toward the humerus. The relationship of the breast to the pectoralis major muscle influences two-dimensional projectional imaging, such as mammography. Since the breast tissue is closely applied to the muscle, some of the lateral tissues can only be imaged through the muscle. As with any soft-tissue structure overlying muscle, it is easier to project the breast into the field of view by pulling it away from the chest wall and compressing it with the plane of compression along the obliquely oriented muscle fibers of the pectoralis major muscle. In order to maximize the tissue imaged, the free portion of the muscle should be included in the field of view.
In view of the enormous amount of work that has been done in an effort to understand the breast and the development of breast cancer, it is surprising that the normal breast has never been clearly defined. This is likely due to the fact that since breast cancer is really the only significant abnormality that occurs in the breast, it is really only the changes that appear to predispose to breast cancer that are considered significant. There is a large range of histologic findings that occur in women who never develop breast cancer, but where normal ends and abnormal begins is not obvious, and past classifications have been found to be inaccurate.
The ability to detect breast cancers earlier requires high-quality imaging, proper film processing, systematic review of the images, reasoned interpretation, the ability to solve problems raised by the imaging, and the ability to guide the diagnostic removal of cells or tissue for diagnosis. The interpreter should participate in all aspects of this process. It is very important that quality control be supervised by the interpreter(s) of the images so that any image degradation can be detected and corrected as quickly as possible.
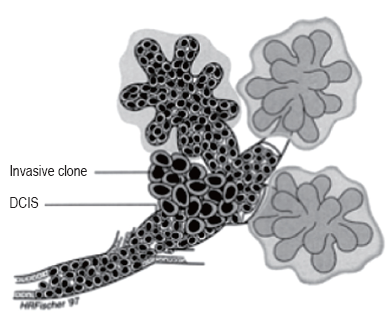
Ductal Cancer can spread up and down the duct network and remain in situ, whereas invasive cancer can be found associated with a part of the process. This finding would support the continuum theory. Their data suggest that one of the already genetically unstable cells in the duct developed an invasive clone and that this clone proliferated while the remaining in situ cells, unable to invade, continued to proliferate and spread up and down the ducts. This observation explains invasive breast cancer can be found in the same lesion (Figure 2). In Figure 2, outside the ducts and lobules a huge amount of breast muscle and tissue are present and here is the challenge.
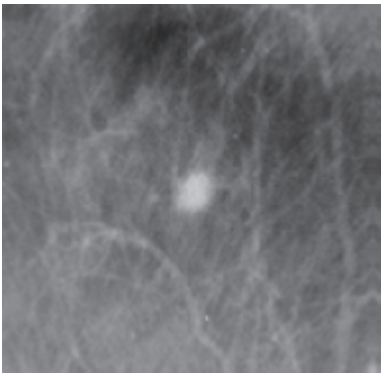
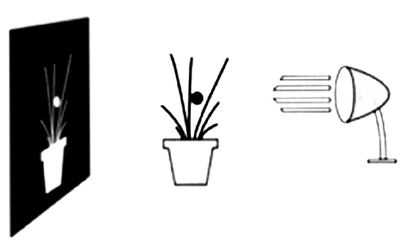
An understanding of breast tissue patterns as they apply to the sensitivity of mammographic detection of breast malignancy is important. The greater the amount of fat within the breast, the easier it is to recognize a water-density tumor (Figure 3). As in any other X-ray study, the margins of a water-density cancer will be obscured or invisible when they are contiguous with normal tissue of equivalent X-ray attenuation. In breasts in which the parenchyma is nonuniform, the X-ray attenuation will vary in a nonuniform way, making it difficult to detect a small cancer whose margins are similarly nonuniform. In the breast that is heterogeneously dense or extremely dense, the sensitivity of mammography, not only for the early detection of malignancy, but also for large cancers is somewhat diminished because of the difficulty of finding ill-defined cancers within the inhomogeneous background.
Our algorithms, specially first and second, are used to remove the huge amount of tissue and fat from the Cancerous cells within the biopsy samples, here we are naming these as tissue blocks, shown in Figure 4. The fact that mammography can detect very small cancers but can also miss some very large cancers is confusing to clinicians and the public. Figures 4,5 are useful for explaining how mammography can detect many very small cancers, but some large palpable cancers can still be difficult to image.
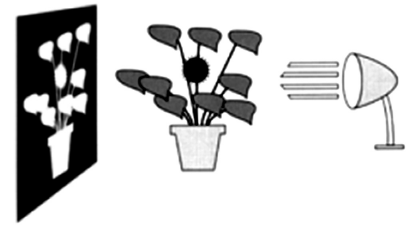
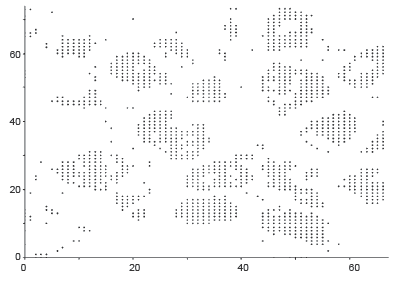
Our target is to get the image something like in Figure 5. Outputs of those algorithms are shown in Figure 6A-C, for normal breast tissue. Figure 5C, shows the cells with black spotted on the space.
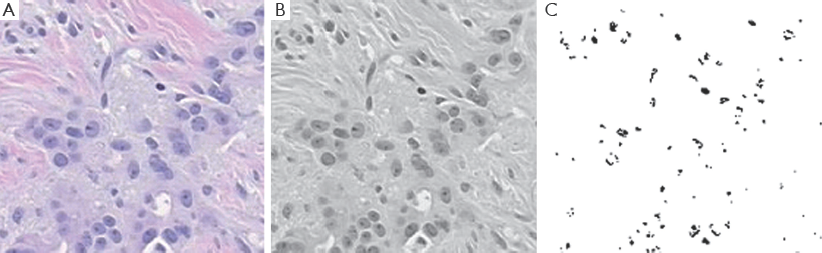
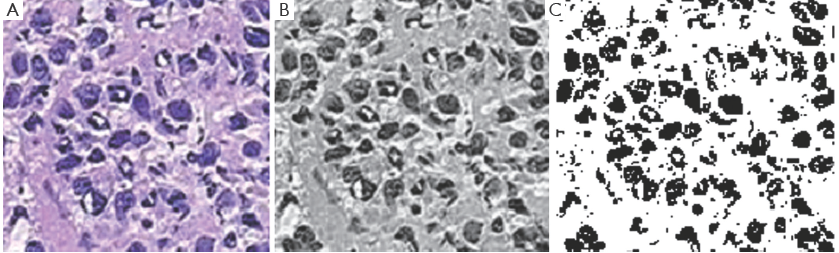
Figure 7A-C, shows the Cancerous cells, some kind of abnormal size and numbers are marked. These outputs are also from the same set of algorithms. We have conducted the observations using 18 different patients tissue block all are invasive situ breast cancer and 8 normal breast tissue blocks.
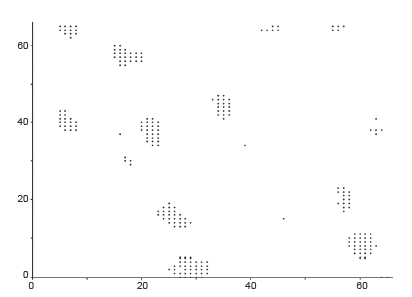
Graphical observations also conducted as shown in Figures 8,9. In case of normal tissue, disconnected cell graphs have been identified with few numbers. On the other hand, in case of invasive breast cancer tissue uncounted connected cell graphs are observed.
Conclusions
Till date, it is observed genetic mutation of certain oncogenes is responsible for any type of cancers. Modern techniques are using for treatment and chemotherapy is an established way of controlling cancers now a days. But, the question is that “Why the oncogenes are suddenly changing their behavior or becoming inactivated”? Next we will put more effort on genetical behavior of cancer genes and how these can be tuned that leads to more biometric.
Acknowledgements
Disclosure: The authors declare no conflict of interest.
References
- National Cancer Institute (NCI) Web site. Available online: http://www.cancernet.gov [last visited on September 30, 2011].
- FDA Web site. Available online: http://www.accessdata.fda.gov/scripts/cdrh/cfdocs/cfMQSA/mqsa.cfm [last visited on September 30, 2011].
- Mallapragada VG, Sarkar N, Podder TK. A Robotic System for Real-time Tumor Manipulation During Image guided Breast Biopsy. IEEE International Conference on Bioinformatics and Bioengineering 2007, 204-10.
- Mallapragada VG, Sarkar N, Podder TK. Robot-assisted real-time tumor manipulation for breast biopsy. IEEE Transactions on Robotics 2009;25:316-24.
- Gunduz C, Yener B, Gultekin SH. The cell graphs of cancer. Bioinformatics 2004;20:i145-51.
- Bilgin CC, Demir C, Nagi C, et al. Cell-Graph Mining for Breast Tissue Modelling and Classification. 29th IEEE EMBS Annual International Conference 2007, Lyon, France.
- Tang AM, Kacher DF, Lam EY, et al. Simultaneous ultrasound and MRI system for breast biopsy: compatibility assessment and demonstration in a dual modality phantom. IEEE Trans Med Imaging 2008;27:247-54.
- Zhu C, Burnside ES, Sisney GA, et al. Fluorescence spectroscopy: an adjunct diagnostic tool to image-guided core needle biopsy of the breast. IEEE Trans Biomed Eng 2009;56:2518-28.
- Yang L, Chen W, Meer P, et al. High throughput analysis of breast cancer specimens on the grid. Med Image Comput Comput Assist Interv 2007;10:617-25.
- Origene Web site. Available online: http://www.origene.com/ (one such example we have used here, Available online: http://www.origene.com/assets/images/tissues/blocks/CU0000005705.AF1.20X.jpg) [last visited on August 29, 2009].