
Decreased apoptosis in advanced-stage/high-grade hepatocellular carcinoma complicating chronic hepatitis C is mediated through the downregulation of p21 ras
Introduction
Previous reports have highlighted the heterogeneity of HCC (1,2) possibly due to different cells of origin (3) or different underlying causative viral genotypes (4,5). Indeed, the accurate identification of the specific pathways that are activated or inhibited in different HCV genotypes may be crucial for the individualization of therapy (6).
Many attempts to detect prognostic parameters to classify HCCs have been made, initially with predominantly clinical staging systems, such as BCLC (7,8), Okuda, CLIP (9,10), the Chinese University prognostic index (CUPI) (11) and JIS (12), though these methods were shown to have limited value. More recently, HCCs have been classified according to their molecular characteristics, including variations in the expression of tumor suppressor genes and oncogenes (13,14).
However, the key prognostic predictors in cases of hepatocellular carcinoma are only partially known; moreover, the predictors vary at different stages of the disease (15). Refinement of the molecular classification of HCCs considering the geographical and genetic diversity of patients will be essential for the efficient design of the forthcoming personalized clinical treatments (14).
Although p21 ras has been shown to be upregulated in HCC complicating chronic HCV type 1, the status of p21 is unknown in type IV. In addition, the nature of the relationship between the state of p21 ras activation and the different stages of HCC also remains unknown (16).
Material and methods
The present study was performed using Tru-cut core liver biopsies from 35 patients with chronic HCV hepatitis type 4 and 35 segmentectomy specimens of hepatocellular carcinoma complicating chronic hepatitis C. The Tru-cut core biopsies were clinically indicated and were performed as a part of the pretreatment evaluation of the grade and stage of chronic HCV in patients who were candidates for combination therapy (IFN alpha and ribavirin).
HCC specimens were also obtained from excision biopsy specimens obtained from patients with hepatitis C-related cirrhosis. At least 5 sections were collected from each tumor (to account for the heterogeneity of hepatocellular carcinomas). The cirrhosis specimens were collected from the segmentectomy specimens from tissue at the farthest point from the tumor.
The protocol of the study was reviewed and approved by the Ethics Committee of the Alexandria Faculty of Medicine.
Paraffin blocks were retrieved from the archives of the Pathology Department, Alexandria Faculty of Medicine. Confirmation of the HCV etiology of the liver disease was performed using a third-generation ELISA technique, and genotype (type 4) confirmation was performed by INNO-LiPA (17).
Patients who were obese, diabetic, alcoholic or HBsAb-positive were excluded from the analysis.
Methods
Sections (5 micrometers thick) were cut from paraffin blocks and stained with H&E for histopathological examination. Masson’s trichrome stain was used to evaluate the stage. The sections were also immunohistochemically stained for p21 ras using a ready-to-use polyclonal antibody (Lab Vision) (code no. RB-1627), and the sections were then stained with the universal polyclonal kit (Lab Vision, UK) (TP-015).
Steps
The sections were stained per the manufacturer’s instructions. Antigen retrieval was performed by boiling the slides in 2% citrate buffer for 10 minutes, and the sections were then incubated with the primary antibody overnight at 4 °C. Diaminobenzidine (DAB) was used as the chromogenic substrate, and the sections were counterstained with hematoxylin. Endometrioid carcinoma was used as a positive control for p21 ras; the positive controls were included in each run. Negative controls obtained by omitting the primary antibody were also included.
Positive cytoplasmic staining was graded on a scale from 0 to 3 according to the extent of staining.
- 0: no staining;
- 1: less than 30% of the biopsy showed positive staining;
- 2: between 30-59% of the biopsy showed positive staining;
- 3: greater than 60% of the biopsy showed positive staining.
The grading and staging of the liver biopsies were performed according to the hepatitis activity index (HAI)(18); HCC grading was performed according to the WHO classification of liver tumors (19). All the biopsies were scored, and the scores are reported as the mean ± standard deviation of two scores given by two pathologists for each case.
Determination of the apoptotic index
The APO-BrdU Kit was used to evaluate the apoptotic index (APO-BRDU-IHC, AbD Serotec, product code APO002, Batch no. 230112, Oxford, OX5 1GE, UK).
TUNEL (terminal deoxynucleotidyl transferase-mediated d-UTP biotin nick end labeling) assay: Sections (5 µm thick) mounted on coated slides were stained according to the manufacturer’s protocol. Briefly, each section was brought to water and then left in PBS to equilibrate. The specimen was permeabilized by incubation with proteinase K at a 1:100 dilution in 10 mM Tris buffer at room temperature for 20 min. After rinsing in PBS, the endogenous peroxidase activity was quenched by incubation in H2O2 in methanol for 10 min. After rinsing, the sections were incubated with 1X reaction buffer for 30 min at room temperature. Without intermediate washes, the sections were incubated with the complete reaction mixture overnight at room temperature in a humidified chamber.
On day 2, the reaction buffer was removed, and blocking buffer was applied at room temperature for 10 minutes. The antibody solution was prepared, added and incubated for 3 hours at room temperature. After removing the excess fluid, the blocking buffer was applied. Visualization of the reaction was performed using DAB as the chromogenic substrate and hematoxylin as a counter stain.
Counting the apoptotic index
Five fields were counted per slide. Cells were considered positive for apoptosis as assessed by 2 criteria: a positive nuclear stain and, morphologic evidence of apoptotic cells.
The number of positive cells was counted according to the above-mentioned criteria, and the number of negative cells (nuclei stained blue with hemotoxylin) was also counted. The index was calculated as follows (20):
No. of apoptotic cells/(no. of apoptotic cell + no. of negative cells).
Statistical analysis of the data
The data were input into the computer using IBM SPSS software package version 20.0. The qualitative data were described as the number and percent. The distributions of quantitative variables were tested for normality using the Shapiro-Wilk test and the D’Agostino test; histograms and QQ plots were used to visually assess the distribution. Parametric tests were used when the data were normally distributed, whereas non-parametric tests were used when the data were non-normally distributed. The quantitative data were described using the mean and standard deviation for normally distributed data, whereas non-normally distributed data were expressed using the median, minimum and maximum. For the non-normally distributed data, the Kruskal-Wallis test was used for comparisons between the groups, and pair-wise comparisons were assessed using the Mann-Whitney test with the Bonferroni correction. The correlations between two quantitative variables were assessed using the Spearman coefficient. For non-normally distributed data, the Mann-Whitney test (for data with a distribution that was significantly deviated from normal) was used to analyze the two independent populations.
Significant test results are quoted as two-tailed probabilities. The significance of the obtained results was judged at the 5% level.
Results
The patient age ranges were 30-49 (33.9±8.4) years in the chronic hepatitis group and 47-70 (56.1±7.7) years in the cirrhosis and HCC group (grouped together, as both the cirrhosis and HCC specimens were obtained from the same resection specimen). The male:female ratios were 4:1 and 6:1 for the two groups, respectively.
HCCs were graded as follows: 8 grade I, 7 grade 2 and 20 grade 3. Fourteen HCCs were stage A (less than 5 cm in diameter), and 21 were stage B (greater than 5 cm in diameter).
Immunohistochemical results
p21 ras expression
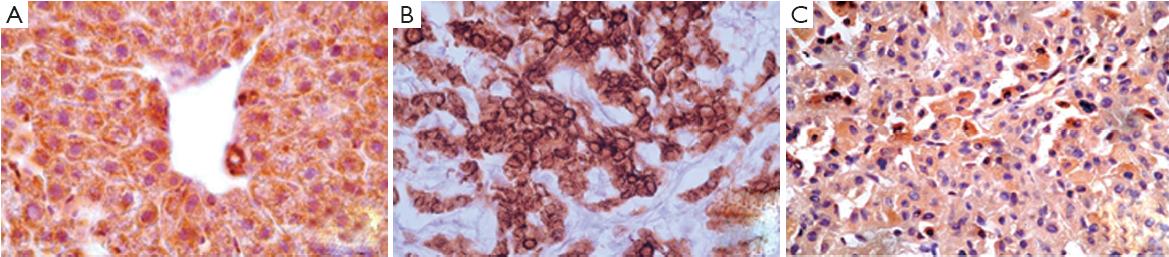
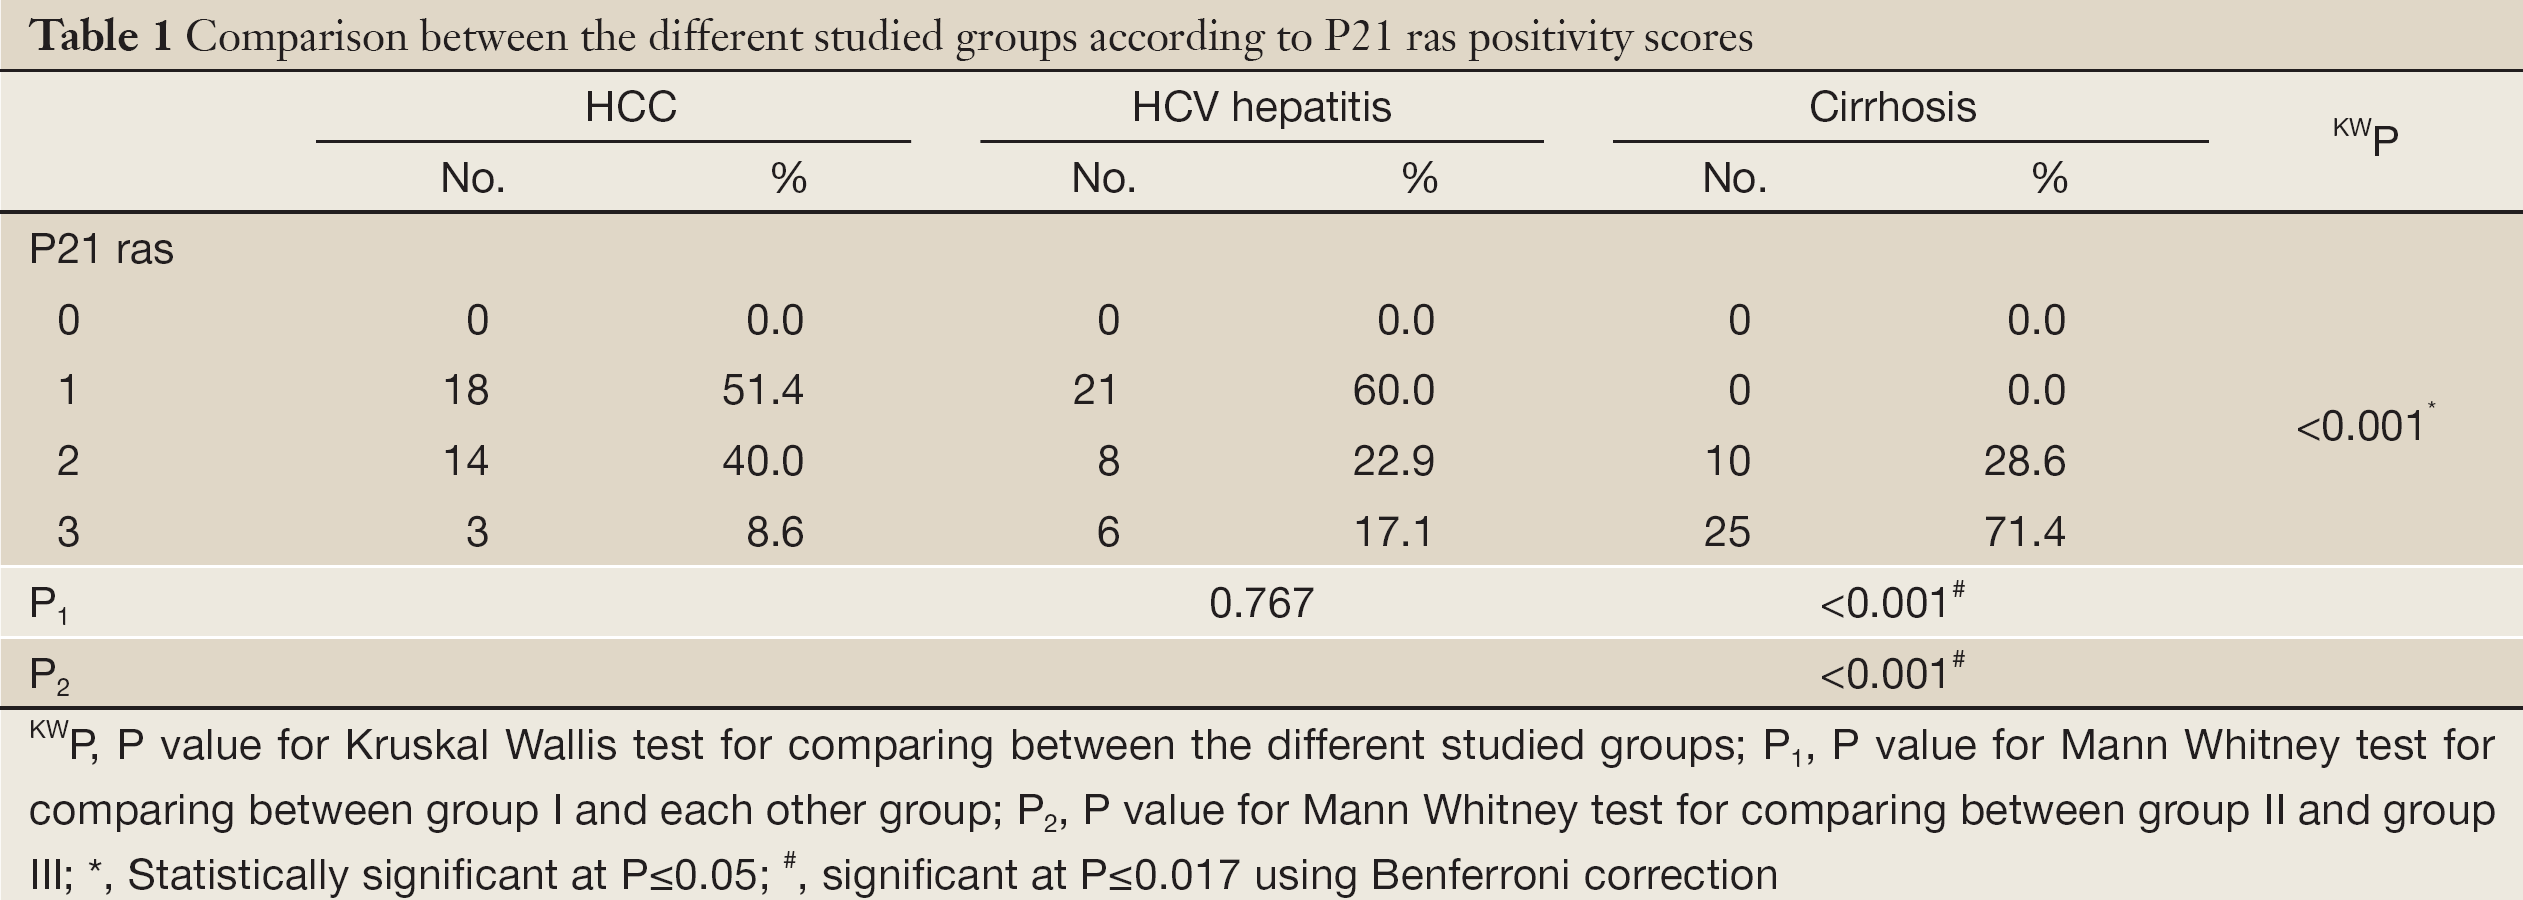
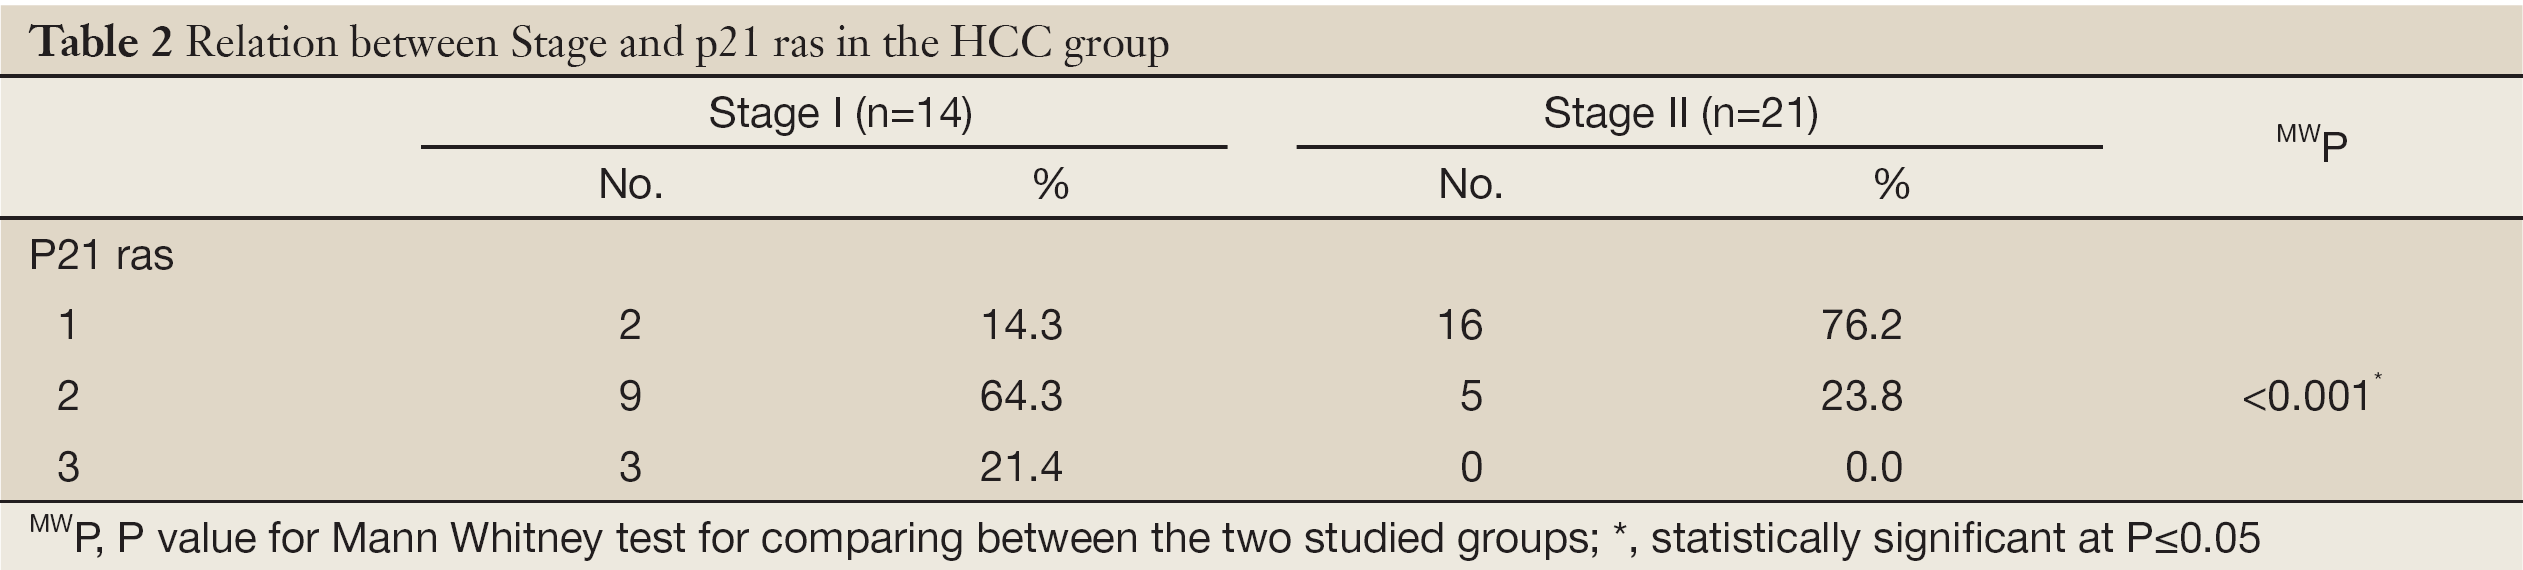
p21 ras staining was observed on the cell membrane, as granular cytoplasmic staining, in acinar zones 1 and 3 and along fibrous septa. Bile ducts and stroma were negative (Figure 1). Significant differences in the levels of p21 ras protein expression were observed between the hepatitis, cirrhosis and HCC groups (P=0.001). P21 ras expression was approximately twofold higher in the cirrhosis group compared to the hepatitis group (Table 1). Within the HCC group, large HCCs showed significantly lower p21 ras expression compared to small HCCs (median 0.61 vs. 0.43) (P=0.001) (Table 2).
Full Table
Full Table
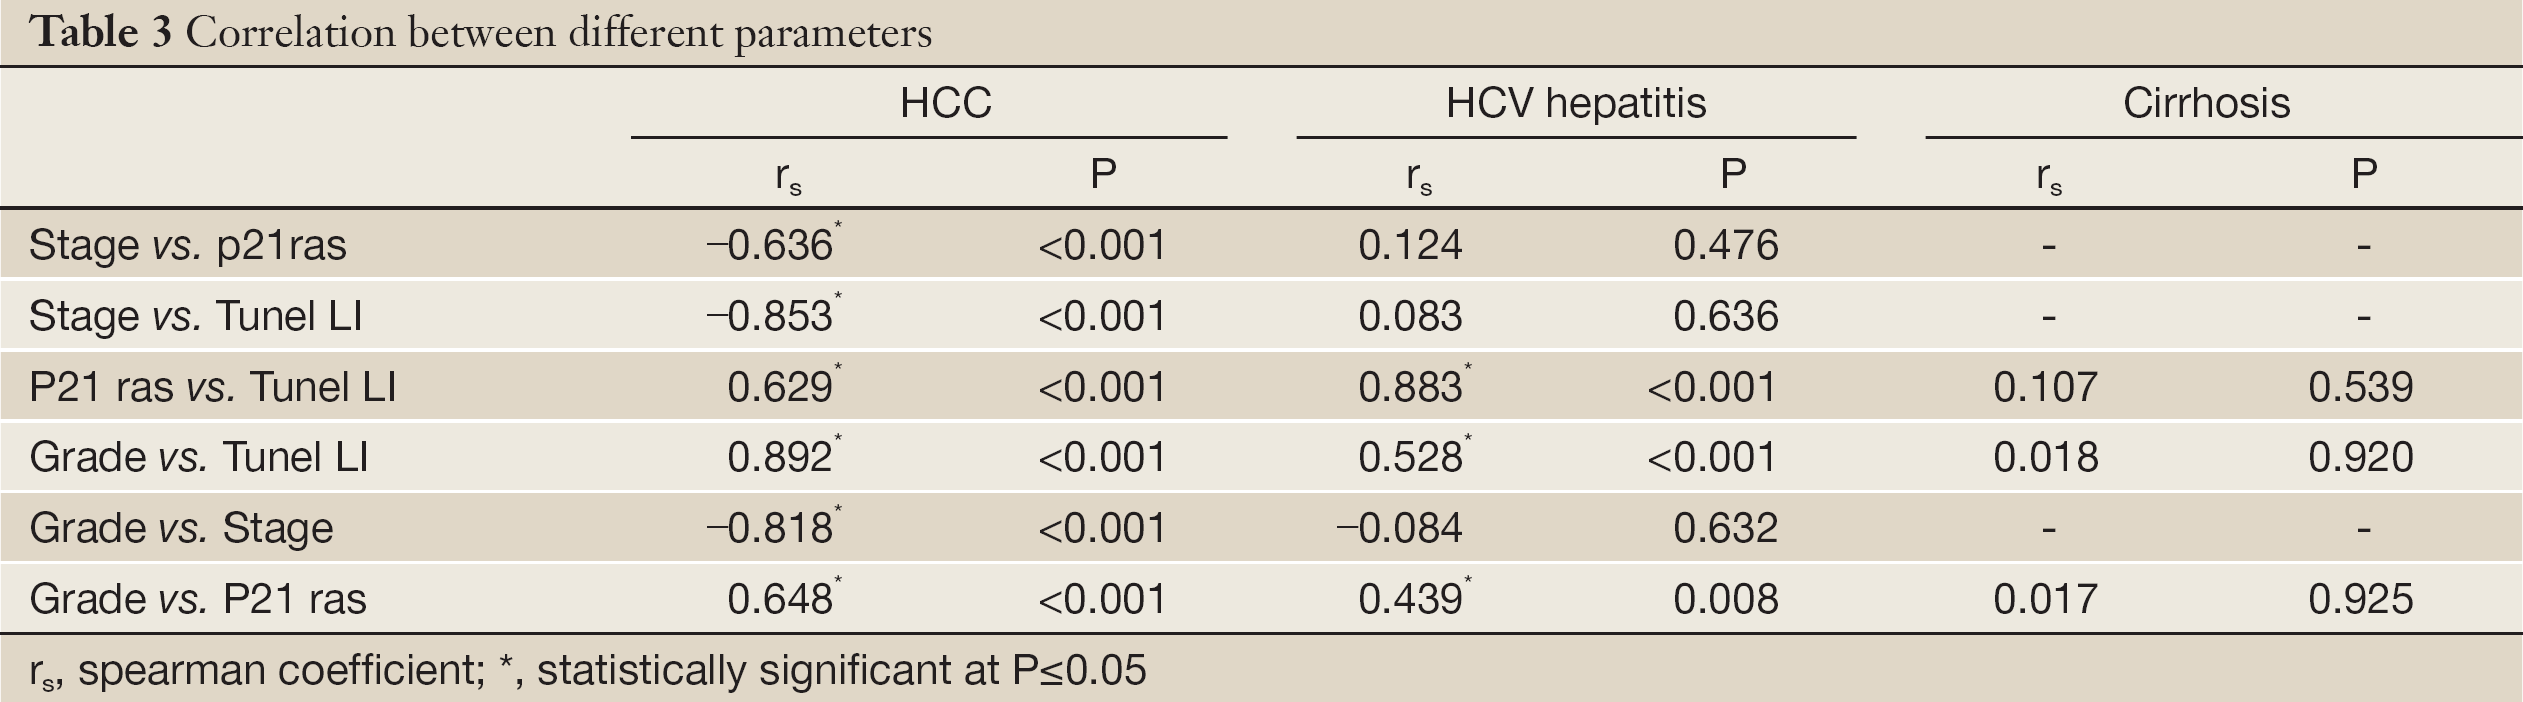
p21 ras expression correlated significantly with grade in the HCV group (r=0.44, P=0.008) and the HCC group (r=0.65, P=0.001) (Table 3). A significant negative correlation was detected between p21 ras and HCC stage (r=0.64, P=0.001) (Table 3).
Full Table
Tunel-labeling index (TUNEL-LI) (Figure 2)
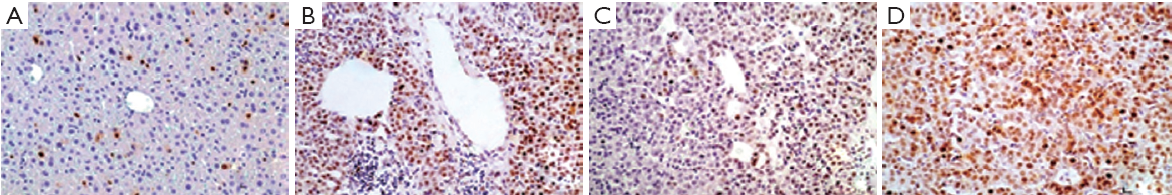
Positive staining was seen in the form of nuclear staining. Significant differences in the TUNEL-LI results were detected between the groups (Table 4).
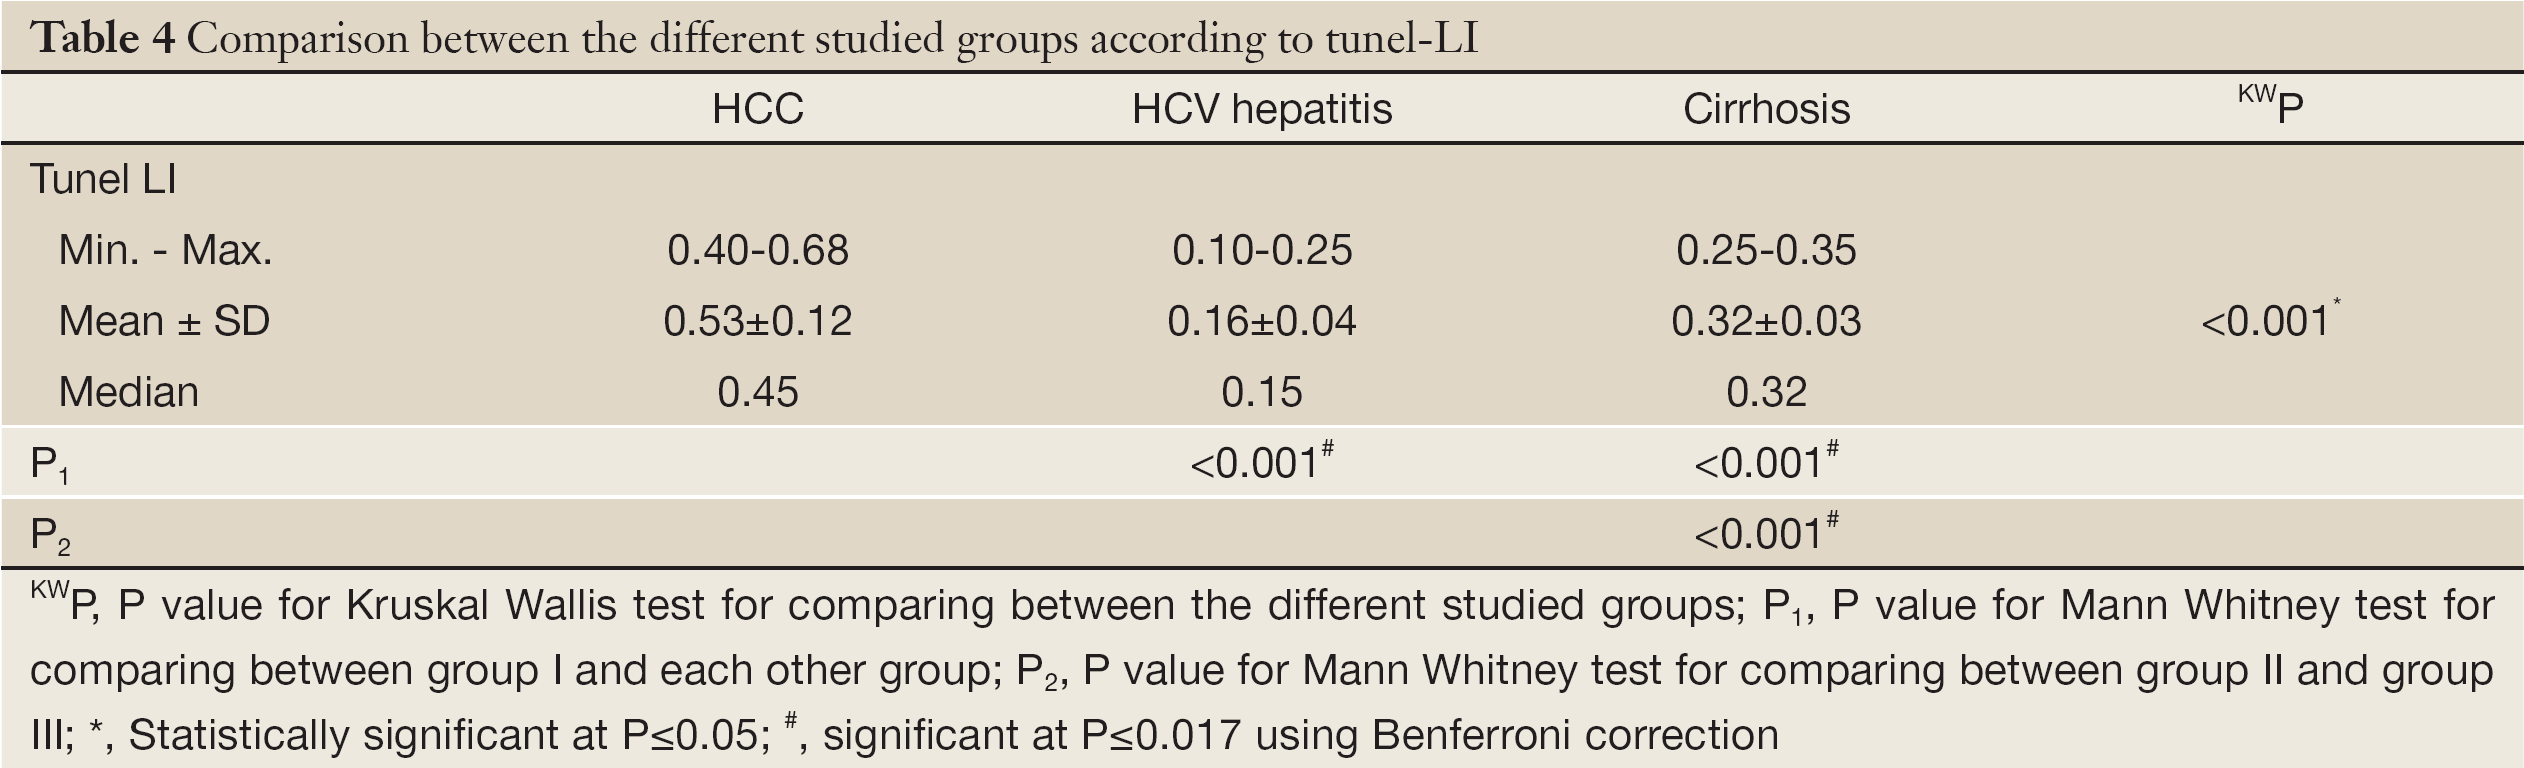
Full Table
The TUNEL-LI values increased gradually from the hepatitis group to the cirrhosis group to the HCC group (Table 4). Within the HCC group, a comparison of the TUNEL-LI values between small HCCs (BCLC stage A; less than 5 cm in diameter) and large HCCs (multinodular; greater than 5 cm in diameter; BCLC stage B) revealed that the TUNEL-LI values in the larger tumors (stage B) were significantly lower than the TUNEL-LI values for smaller HCCs (stage A) (Table 5).
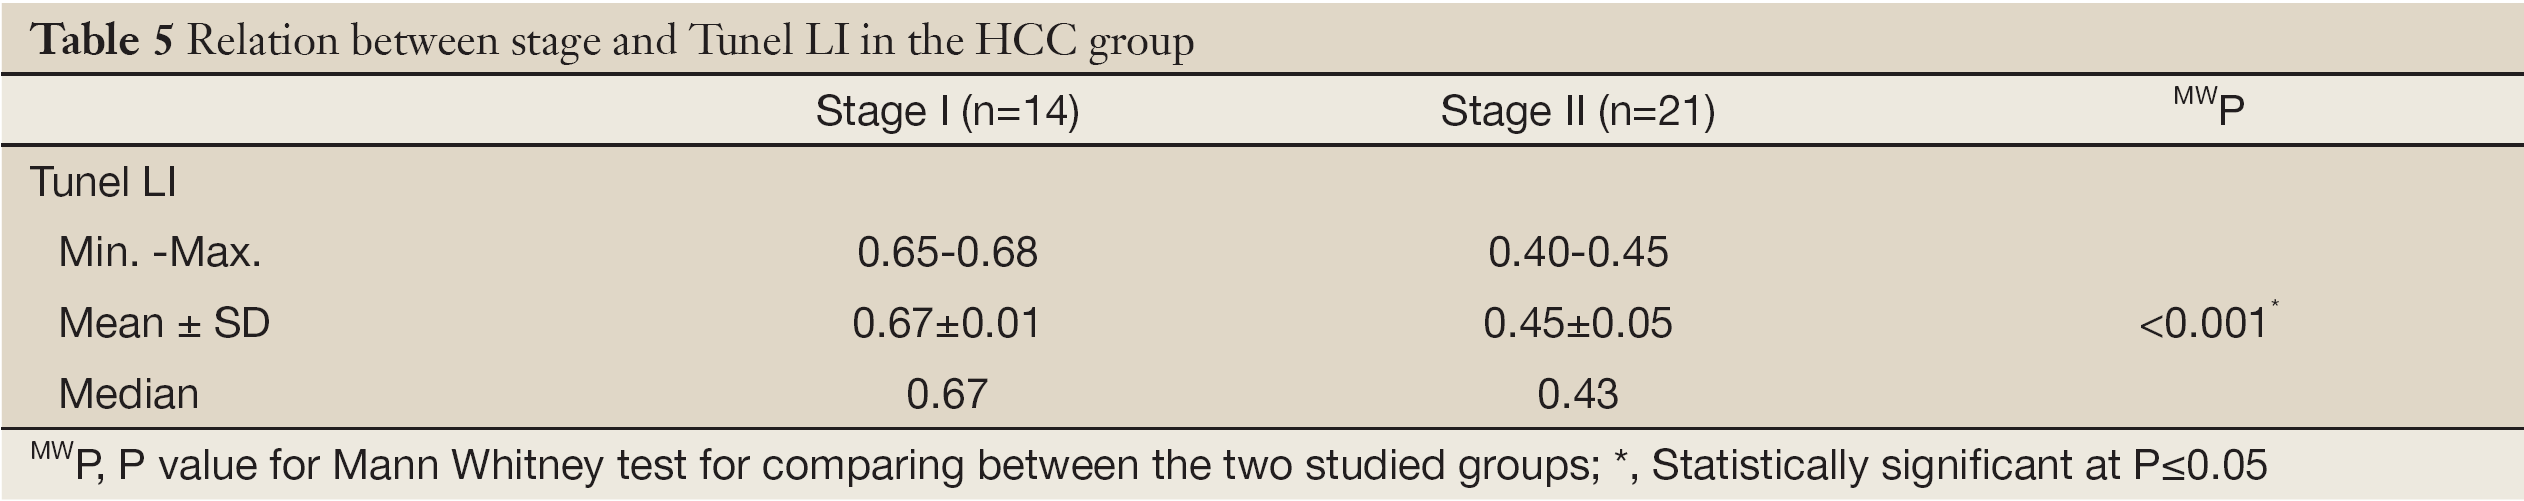
Full Table
The TUNEL-LI values were significantly correlated with grade in both the HCV hepatitis and the cirrhosis groups (Table 3).
Significant correlations were detected between the TUNEL-LI values and the HCC stage (Table 3).
Correlations between p21 ras expression and TUNEL-LI in the studied groups
TUNEL-LI was significantly correlated with the p21 ras expression scores in both the hepatitis and HCC groups (Table 3).
Discussion
Large differences exist between the gene expression patterns of HCC complicating different etiologic agents. Microarray analysis studies performed in Egyptian (21) and non-Egyptian patients (22) have demonstrated differences in the patterns of upregulated and downregulated gene expression. Furthermore, hepatocellular gene expression profiles differ even among different quasispecies of HCV type 1 (23,24). Therefore, determining the changes in the level of activation of specific pathways in HCC complicating type 4 HCV (the most common genotype in Egyptian patients) (23) is important and may have therapeutic implications.
In the present study, p21 ras was found to be over-expressed in cirrhotic patients, with a decline in its level of expression in HCC complicating chronic HCV. Accordingly, p21 ras activation was considered to be an early event in HCC development. Activation of the ras proto-oncogene has been linked to the initiation stages of carcinogenesis in tumors of the pancreas, colon, lung and thyroid and in myeloid leukemia (25-27). In agreement with the findings of the present study, Nonomura et al. and Takeuchi et al. (28,29) have also demonstrated the downregulation of p21 ras protein expression in HCCs compared to cirrhotic nodules.
P21 ras is involved in the regulation of several downstream pathways, including cell cycle control and apoptosis (30-32), and the reduction of apoptosis mediated by the downregulation of p21 ras expression in HCCs would theoretically give the tumor a survival advantage. Nonomura et al. (28) reported lower p21 ras protein expression in poorly differentiated HCCs compared to well-differentiated HCCs, concluding that p21 ras is not necessary for progression to higher grades of malignancy.
In the present study, the TUNEL-LI values increased gradually from hepatitis to cirrhosis to HCC, findings that are similar to those of Park et al. (33). Additionally, significant differences in TUNEL-LI were detected between advanced-stage and early stage HCCs in the present study, which is agreement with Park et al. (33), who reported that high-grade dysplastic nodules showed higher TUNEL positivity compared to small HCCs (lower TUNEL-LI with the progression of malignant transformation). The conclusions of Fukuzawa et al. (34), who reported that Fas/Fas ligand (involved in the apoptosis pathway) labeling was lower in HCCs than the surrounding cirrhotic tissues and was not detected at all in poorly differentiated HCCs by PCR, also support this finding. Genes involved in the apoptotic pathway were also found to be activated in HCC complicating chronic HCV type 4 (34).
The level of activity of oncogenes changes with the progression of malignancy: Zhang et al. (35) detected higher levels of p21 ras activity in early-stage HCCs compared to late-stage HCCs.
In the present study, the comparison of p21 ras protein expression between late- and early-stage HCCs showed lower expression levels in advanced cases. Similarly, Jagirdar et al. (36) stated that “tumor dedifferentiation is associated with an attenuation of p21 ras expression”. These authors also found that p21 ras was better expressed in fibrolamellar variants and well-differentiated HCCs compared to poorly differentiated variants. Their conclusion was that p21 ras has a role in early HCC development. Large and advanced-stage HCCs have a higher histologic grade compared to small and early-stage HCCs (37,38). Most of the HCC cases included in the present study were of a high grade/advanced stage, and p21 ras protein expression was, therefore, decreased in the HCC group as a whole, which is most likely related to the lower p21 ras expression and TUNEL labeling index detected in the majority of the (advanced-stage) HCCs. Therefore, the reduction in p21 ras expression observed in the present study may have facilitated the observed reduction of apoptosis, which would provide the tumor cells with a survival advantage.
These findings highlight the importance of studying HCC complications in different subtypes of HCV hepatitis as distinct entities rather than generalizing and pooling the data obtained from different clinical settings in an attempt to individualize treatment strategies (39). In addition, p21 ras could be used as a prognostic indicator in cases of HCC complicating chronic HCV type 4.
Acknowledgements
Disclosure: The authors declare no conflict of interest.
References
- Lok AS, Seeff LB, Morgan TR, et al. Incidence of hepatocellular carcinoma and associated risk factors in hepatitis C-related advanced liver disease. Gastroenterology 2009;136:138-48. [PubMed]
- Wong N, Lai P, Pang E, et al. Genomic aberrations in human hepatocellular carcinomas of differing etiologies. Clin Cancer Res 2000;6:4000-9. [PubMed]
- Lee JS, Heo J, Libbrecht L, et al. A novel prognostic subtype of human hepatocellular carcinoma derived from hepatic progenitor cells. Nat Med 2006;12:410-6. [PubMed]
- Ogata S, Florese RH, Nagano-Fujii M, et al. Identification of hepatitis C virus (HCV) subtype 1b strains that are highly, or only weakly, associated with hepatocellular carcinoma on the basis of the secondary structure of an amino-terminal portion of the HCV NS3 protein. J Clin Microbiol 2003;41:2835-41. [PubMed]
- Bruno S, Crosignani A, Maisonneuve P, et al. Hepatitis C virus genotype 1b as a major risk factor associated with hepatocellular carcinoma in patients with cirrhosis: a seventeen-year prospective cohort study. Hepatology 2007;46:1350-6. [PubMed]
- Bhoori S, Toffanin S, Sposito C, et al. Personalized molecular targeted therapy in advanced, recurrent hepatocellular carcinoma after liver transplantation: a proof of principle. J Hepatol 2010;52:771-5. [PubMed]
- Llovet JM, Burroughs A, Bruix J. Hepatocellular carcinoma. Lancet 2003;362:1907-17. [PubMed]
- Bruix J, Sherman M, Practice Guidelines Committee, et al. Management of hepatocellular carcinoma. Hepatology 2005;42:1208-36. [PubMed]
- Leung TW, Tang AM, Zee B, et al. Construction of the Chinese University Prognostic Index for hepatocellular carcinoma and comparison with the TNM staging system, the Okuda staging system, and the Cancer of the Liver Italian Program staging system: a study based on 926 patients. Cancer 2002;94:1760-9. [PubMed]
- Prospective validation of the CLIP score: a new prognostic system for patients with cirrhosis and hepatocellular carcinoma. The Cancer of the Liver Italian Program (CLIP) Investigators. Hepatology 2000;31:840-5. [PubMed]
- Chevret S, Trinchet JC, Mathieu D, et al. A new prognostic classification for predicting survival in patients with hepatocellular carcinoma. Groupe d,Etude et de Traitement du Carcinome Hépatocellulaire. J Hepatol 1999;31:133-41. [PubMed]
- Kudo M, Chung H, Haji S, et al. Validation of a new prognostic staging system for hepatocellular carcinoma: the JIS score compared with the CLIP score. Hepatology 2004;40:1396-405. [PubMed]
- Boyault S, Rickman DS, de Reyniès A, et al. Transcriptome classification of HCC is related to gene alterations and to new therapeutic targets. Hepatology 2007;45:42-52. [PubMed]
- Zucman-Rossi J. Molecular classification of hepatocellular carcinoma. Dig Liver Dis 2010;42:S235-41. [PubMed]
- Llovet JM. Clinical and molecular classification of hepatocellular carcinoma. Liver Transpl 2007;13:S13-6. [PubMed]
- Gulbis B, Galand P. Immunodetection of the p21-ras products in human normal and preneoplastic tissues and solid tumors: a review. Hum Pathol 1993;24:1271-85. [PubMed]
- Zekri AR, El-Din HM, Bahnassy AA, et al. TRUGENE sequencing versus INNO-LiPA for sub-genotyping of HCV genotype-4. J Med Virol 2005;75:412-20. [PubMed]
- Ishak K, Baptista A, Bianchi L, et al. Histological grading and staging of chronic hepatitis. J Hepatol 1995;22:696-9. [PubMed]
- Gibson JB, Sobin LH. Histological typing of tumors of the liver, biliary tract and pancreas. In: International histological classification of tumors no. Geneva WHO 1978:19-30.
- Garrity MM, Burgart LJ, Riehle DL, et al. Identifying and quantifying apoptosis: navigating technical pitfalls. Mod Pathol 2003;16:389-94. [PubMed]
- Zekri AR, Hafez MM, Bahnassy AA, et al. Genetic profile of Egyptian hepatocellular-carcinoma associated with hepatitis C virus Genotype 4 by 15 K cDNA microarray: preliminary study. BMC Res Notes 2008;1:106. [PubMed]
- Chung EJ, Sung YK, Farooq M, et al. Gene expression profile analysis in human hepatocellular carcinoma by cDNA microarray. Mol Cells 2002;14:382-7. [PubMed]
- Yan X, Chen Z, Brechot D. The differences in gene expression profile induced by genotype 1b hepatitis C virus core isolated from liver tumor and adjacent non-tumoral tissue. Hepat Mon 2011;11:255-65.
- Zekri AR, El-Din HM, Bahnassy AA, et al. Genetic distance and heterogenecity between quasispecies is a critical predictor to IFN response in Egyptian patients with HCV genotype-4. Virol J 2007;4:16. [PubMed]
- Spandidos DA, Sourvinos G, Tsatsanis C, et al. Normal ras genes: their onco-suppressor and pro-apoptotic functions Int J Oncol 2002;21:237-41. [PubMed]
- Brown K, Quintanilla M, Ramsden M, et al. v-ras genes from Harvey and BALB murine sarcoma viruses can act as initiators of two-stage mouse skin carcinogenesis. Cell 1986;46:447-56. [PubMed]
- Loboda A, Nebozhyn M, Klinghoffer R, et al. A gene expression signature of RAS pathway dependence predicts response to PI3K and RAS pathway inhibitors and expands the population of RAS pathway activated tumors. BMC Med Genomics 2010;3:26. [PubMed]
- Nonomura A, Ohta G, Hayashi M, et al. Immunohistochemical detection of ras oncogene p21 product in liver cirrhosis and hepatocellular carcinoma. Am J Gastroenterol 1987;82:512-8. [PubMed]
- Takeuchi T, Kagawa K, Hikita H, et al. The expression of ras p21 product in hepatocellular carcinoma. Nihon Shokakibyo Gakkai Zasshi 1990;87:1686-91. [PubMed]
- Gómez J, Martínez-A C, González A, et al. Dual role of Ras and Rho proteins: at the cutting edge of life and death. Immunol Cell Biol 1998;76:125-34. [PubMed]
- Cox AD, Der CJ. The dark side of Ras: regulation of apoptosis. Oncogene 2003;22:8999-9006. [PubMed]
- Liou JS, Chen JS, Faller DV. Characterization of p21Ras-mediated apoptosis induced by protein kinase C inhibition and application to human tumor cell lines. J Cell Physiol 2004;198:277-94. [PubMed]
- Park YN, Chae KJ, Kim YB, et al. Apoptosis and proliferation in hepatocarcinogenesis related to cirrhosis. Cancer 2001;92:2733-8. [PubMed]
- Fukuzawa K, Takahashi K, Furuta K, et al. Expression of fas/fas ligand (fasL) and its involvement in infiltrating lymphocytes in hepatocellular carcinoma (HCC). J Gastroenterol 2001;36:681-8. [PubMed]
- Zhang MF, Zhang ZY, Fu J, et al. Correlation between expression of p53, p21/WAF1, and MDM2 proteins and their prognostic significance in primary hepatocellular carcinoma. J Transl Med 2009;7:110. [PubMed]
- Jagirdar J, Nonomura A, Patil J, et al. ras oncogene p21 expression in hepatocellular carcinoma. J Exp Pathol 1989;4:37-46. [PubMed]
- Zhou L, Rui JA, Wang SB, et al. Prognostic factors of solitary large hepatocellular carcinoma: the importance of differentiation grade. Eur J Surg Oncol 2011;37:521-5. [PubMed]
- Kenmochi K, Sugihara S, Kojiro M. Relationship of histologic grade of hepatocellular carcinoma (HCC) to tumor size, and demonstration of tumor cells of multiple different grades in single small HCC. Liver 1987;7:18-26. [PubMed]
- Lee JS, Thorgeirsson SS. Comparative and integrative functional genomics of HCC. Oncogene 2006;25:3801-9. [PubMed]