
Identification of metastasis-associated genes in colorectal cancer through an integrated genomic and transcriptomic analysis
Introduction
Colorectal cancer (CRC) is one of the most common types of cancer. In 2007, it was estimated that nearly 1.2 million new cases of CRC were diagnosed throughout the world, and about 630,000 deaths were estimated to occur from CRC, accounting for 8% of all cancer deaths (1). The vast majority of CRC deaths are due to the metastasis. CRC is highly curable when it is diagnosed at an early stage. However, CRC is less likely to be curable when it is detected at an advanced stage (when distant metastasis occurs). When CRC is confined to the colon or rectum, the 5-year survival may be as high as 90%. The 5-year survival rate is 68% for CRC patients who are diagnosed at the regional stage, while for patients with metastasis, is as much lower as 11% (2). It is estimated that approximately 60% CRC patients will eventually develop with metastasis (3). Thus, identification of CRC metastasis genes is one of the most important issues in CRC research.
DNA copy number changes can have a great impact on oncogenes and tumor suppressor genes (4). DNA copy number amplification will enhance the product or activity of oncogenes, and DNA copy number deletion may lead to inactivation of tumor suppressor genes. Numerous studies have revealed that DNA copy number changes have a direct role on gene expression values. Hyman et al. (5) compared DNA copy number and expression levels of the genes in breast cancer, and found that both high-level and low-level changes of DNA copy number have a great impact on gene expression values, with 44% of the highly amplified genes being overexpressed, and 10.5% of the overexpressed genes showing an increase in gene copy number. Tsafrir et al. (6) investigated the relationships between DNA copy number and gene expression levels in CRC, and showed that changes in expression level are correlated with alterations in DNA content across many large regions of the genome.
Comparative genomic hybridization (CGH) is a powerful method for molecular cytogenetic analysis of DNA copy number changes (7). CGH technology can detect either chromosomal gains or chromosomal losses across the whole genome. In our previous study (8), 15 important chromosomal aberration sites, including 6 most common gains of chromosomal regions of 7p, 7q11-32, 8q, 13q, 20p and 20q, and 9 most common losses of 1p13-36, 4p15, 4q33-34, 8p12-23, 15q13-14, 15q24-25, 17p, 18p and 18q, were indentified in CRC.
Due to the rapid advance of microarray techniques, large amounts of microarray data have been deposited into public databases like Gene Expression Omnibus (GEO) (9), and the analysis of these data is usually limited to one single platform at a time. However, recent years have seen a few studies to conduct integrated analysis across multiple platforms (10-13). In this study, for the purpose of mining CRC metastasis-related genes, we present an integrated analysis of microarray data, by combining with evidence acquired from CGH data.
Materials and methods
Data
Gene expression profile data and associated clinical information of patients were obtained at GEO (9) website (http://www.ncbi.nlm.nih.gov/geo/, Series GSE2109). Samples of pathological stage 0 or 1 were treated as early-stage CRC, and samples of pathological stage 4 were treated as late-stage CRC. We obtained 55 early-stage primary CRC samples (pathological stage: 0 or 1; Group 1), 56 late-stage primary CRC samples (pathological stage: 4; Group 2), and 34 colorectal metastatic cancer (Group 3). The 34 metastatic sites include liver 26, lung 4, omentum 2, peritoneum 1 and abdominal wall mass 1 (Table S1) (14).
Full table
Group 1 vs. Group 2 was combined into PRI data set, which was used to classify between early-stage primary CRC and late-stage primary CRC. Group 2 vs. Group 3 was used to classify between late-stage primary CRC and colorectal metastatic cancer, and was joined into META data set.
All samples from the GSE2109 database are detected by Affymetrix Human Genome U133 Plus 2.0 arrays containing 54,675 probes. The gene expression values obtained from the database site have been calculated and normalized by Microarray Suite 5.0 (MAS5.0, Affymetrix, Inc.). In order to make distributions of each sample identical, the quantile algorithm (15) was used for further normalization (14).
Integrated genomic and transcriptomic analysis
The information obtained from CGH analysis was used for integrated genomic and transcriptomic analysis (8). Since the six most important amplified chromosomal regions of 7p, 7q11-32, 8q, 13q, 20p and 20q, and the 9 most important deleted chromosomal regions of 1p13-36, 4p15, 4q33-34, 8p12-23, 15q13-14, 15q24-25, 17p, 18p and 18q were determined in our previous study, the above regions were further investigated to identify metastasis-related genes in CRC. The integrated analysis is base on the assumption that oncogenes are present in chromosomal amplification regions, while tumor suppressor genes being located in chromosomal deletion fragments (16).
Gene expression profile data were analyzed to identify metastasis-related genes in CRC. The workflow diagram of integrated analysis of genomic and transcriptomic data is shown in Figure 1: firstly, Significant Analysis of Microarray (SAM) (17) is used to detect significantly differentially expressed genes across the whole genome. Next, the significantly differentially expressed genes located in the important chromosomal aberration regions are selected, and we choose the genes whose expression changes and copy number changes are consistent. In the chromosomal amplification sites, the up-regulated genes are selected, and the down-regulated genes are selected in the chromosomal deletion sites. The selected genes are called as the genomic and transcriptomic overlapping genes (overlapping genes). In the third step, the overlapping gene sets are analyzed by using the Database for Annotation, Visualization and Integrated Discovery (DAVID) (18,19). Finally, a gene selection algorithm is employed to identify metastasis-associated genes in CRC.
SAM
SAM is a statistical method proposed by Tusher et al. (17) in 2001, which is mainly used for determining whether the changes in gene expression are statistically significant. The SAM package is available at the following website: http://www-stat.stanford.edu/~tibs/SAM/.
SAM identifies significant genes by gene specific t-test, and it uses non-parametric statistical methods when the data may not follow a normal distribution. SAM uses repeated permutations of the data to determine whether the expression of any genes was significantly associated with the response variable. The use of permutation-based method can avoid the parametric assumptions of the distribution of single genes, which is the advantage of the method compared to other statistical techniques assuming the equal variance or gene independence (17).
SAM calculates the value di of gene i, and this value is used to measure the strength of the relationship between gene expression and the response variable. The value di is calculated as follows (20):
 |
[1] |
where ri is the linear regression coefficient of gene i, si is the standard error of ri, s0 is an exchangeability factor, and n is the number of genes.
SAM uses false discovery rate (FDR) to estimate the number of falsely significant genes. The formula is as follows (20):
 |
[2] |
where the numerator of the formula is median (or 90th percentile) of the number of falsely called genes, and the denominator is the number of obtained significant genes. Generally, FDR is controlled less than 5%. SAM uses q-value to determine the lowest FDR, which is similar to the well-known P-value, but modified under multiple-testing situations. The q-value measures the significance of gene i, and the corresponding q-value decreases as di increases (20).
Enrichment analysis
The DAVID (18,19) is utilized to analyze enriched gene ontology and pathway for overlapping gene sets. The Functional Annotation Chart tool is used to discover enriched annotations. The Functional Annotation Clustering tool is employed to cluster the related functional annotations into groups.
Gene selection algorithm
Gene selection procedure is conducted on the overlapping gene sets. SVM-T-RFE gene selection algorithm (14) is applied to generate ranked gene set, where the gene scores rank from high to low. The number of gene sets is reduced from original number to 1, and the leave-one-out cross-validation (LOOCV) method is used to assess performance of the classifiers. The gene set with the least number and highest accuracy is chosen as the minimum gene set.
Results
Overlapping gene sets of PRI and META data sets
SAM analysis was conducted on PRI data sets, unpaired two-sample t-test was used, permutation number was set to 100, delta=0.866, and FDR was set to 4.82%. Totally, 801 significantly up-regulated probes and 379 significantly down-regulated probes were screened out between early-stage primary CRC and late-stage primary CRC. Gene expression level changes of the significantly up-regulated or down-regulated probes in 15 important chromosomal aberration regions were analyzed (Table 1). It is worth noting that there were more significantly up-regulated probes in the chromosomal amplified regions (89 vs. 10), and more significantly down-regulated probes in the chromosomal deleted regions (72 vs. 62). The difference between the two groups were statistically significant as determined by the fisher’s exact test (two-tailed, P=1.045e-12). The results show that an increase or decrease of genomic DNA copy number has a direct impact on the gene expression levels.
Full table
SAM analysis was also conducted on META data sets, unpaired two-sample t-test was used, permutation number was set to 100, delta=0.951, and FDR was set to 4.59%. Totally, 892 significantly up-regulated probes and 48 significantly down-regulated probes were detected between late-stage primary CRC and colorectal metastatic cancer. Gene expression level changes of the significantly up-regulated or down-regulated probes in 15 important chromosomal aberration regions were analyzed (Table 2). There was no statistically significant difference in up- or down-regulated probes between chromosomal amplified sites and deleted sites as determined by the fisher’s exact test (two-tailed, P=0.319). It is speculated that other genomic alterations, such as point mutations, may have an impact on the expression value changes, and these changes cannot be detected by using CGH technology. No significantly down-regulated genes were found in certain chromosomal amplified regions, such as +13q, in both PRI and META data sets.
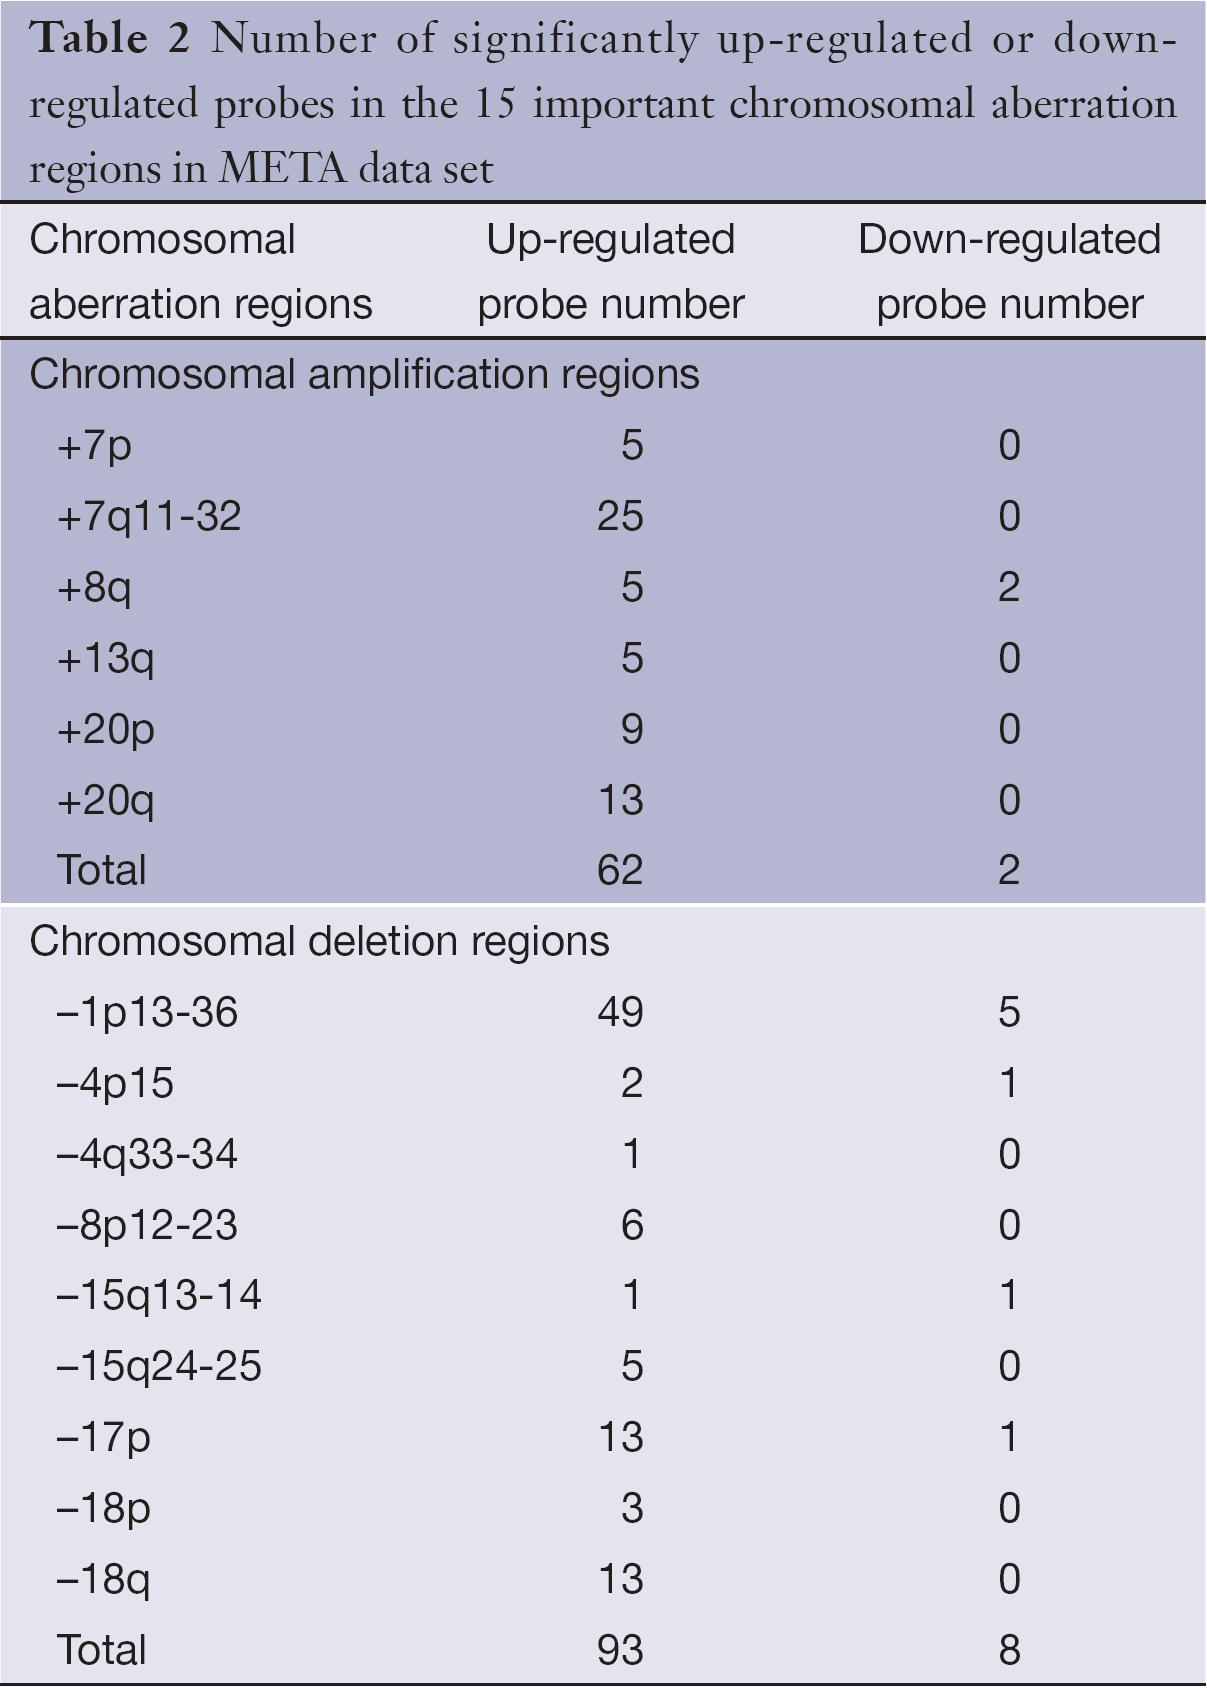
Full table
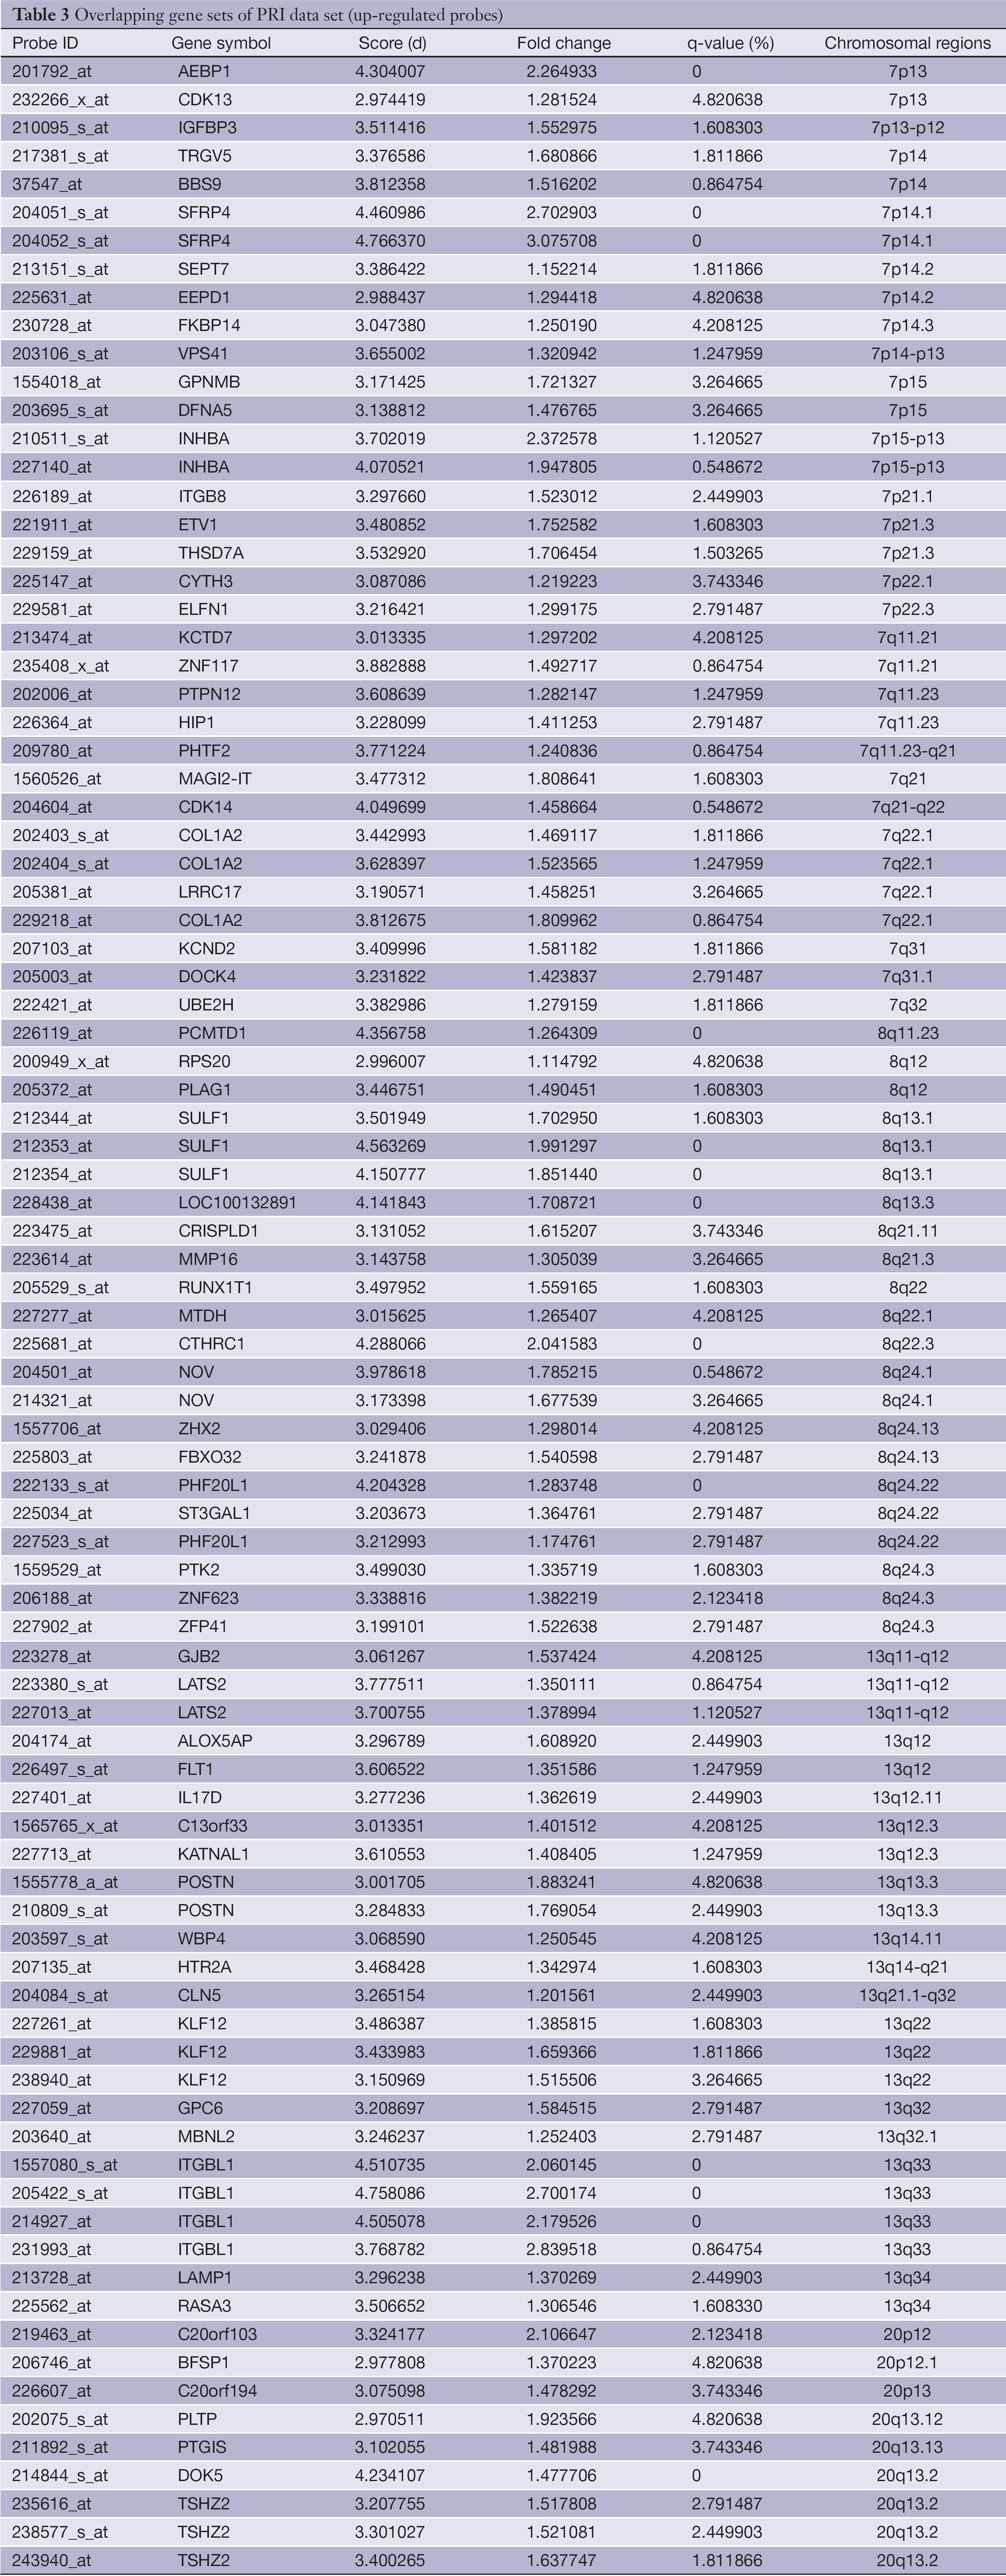
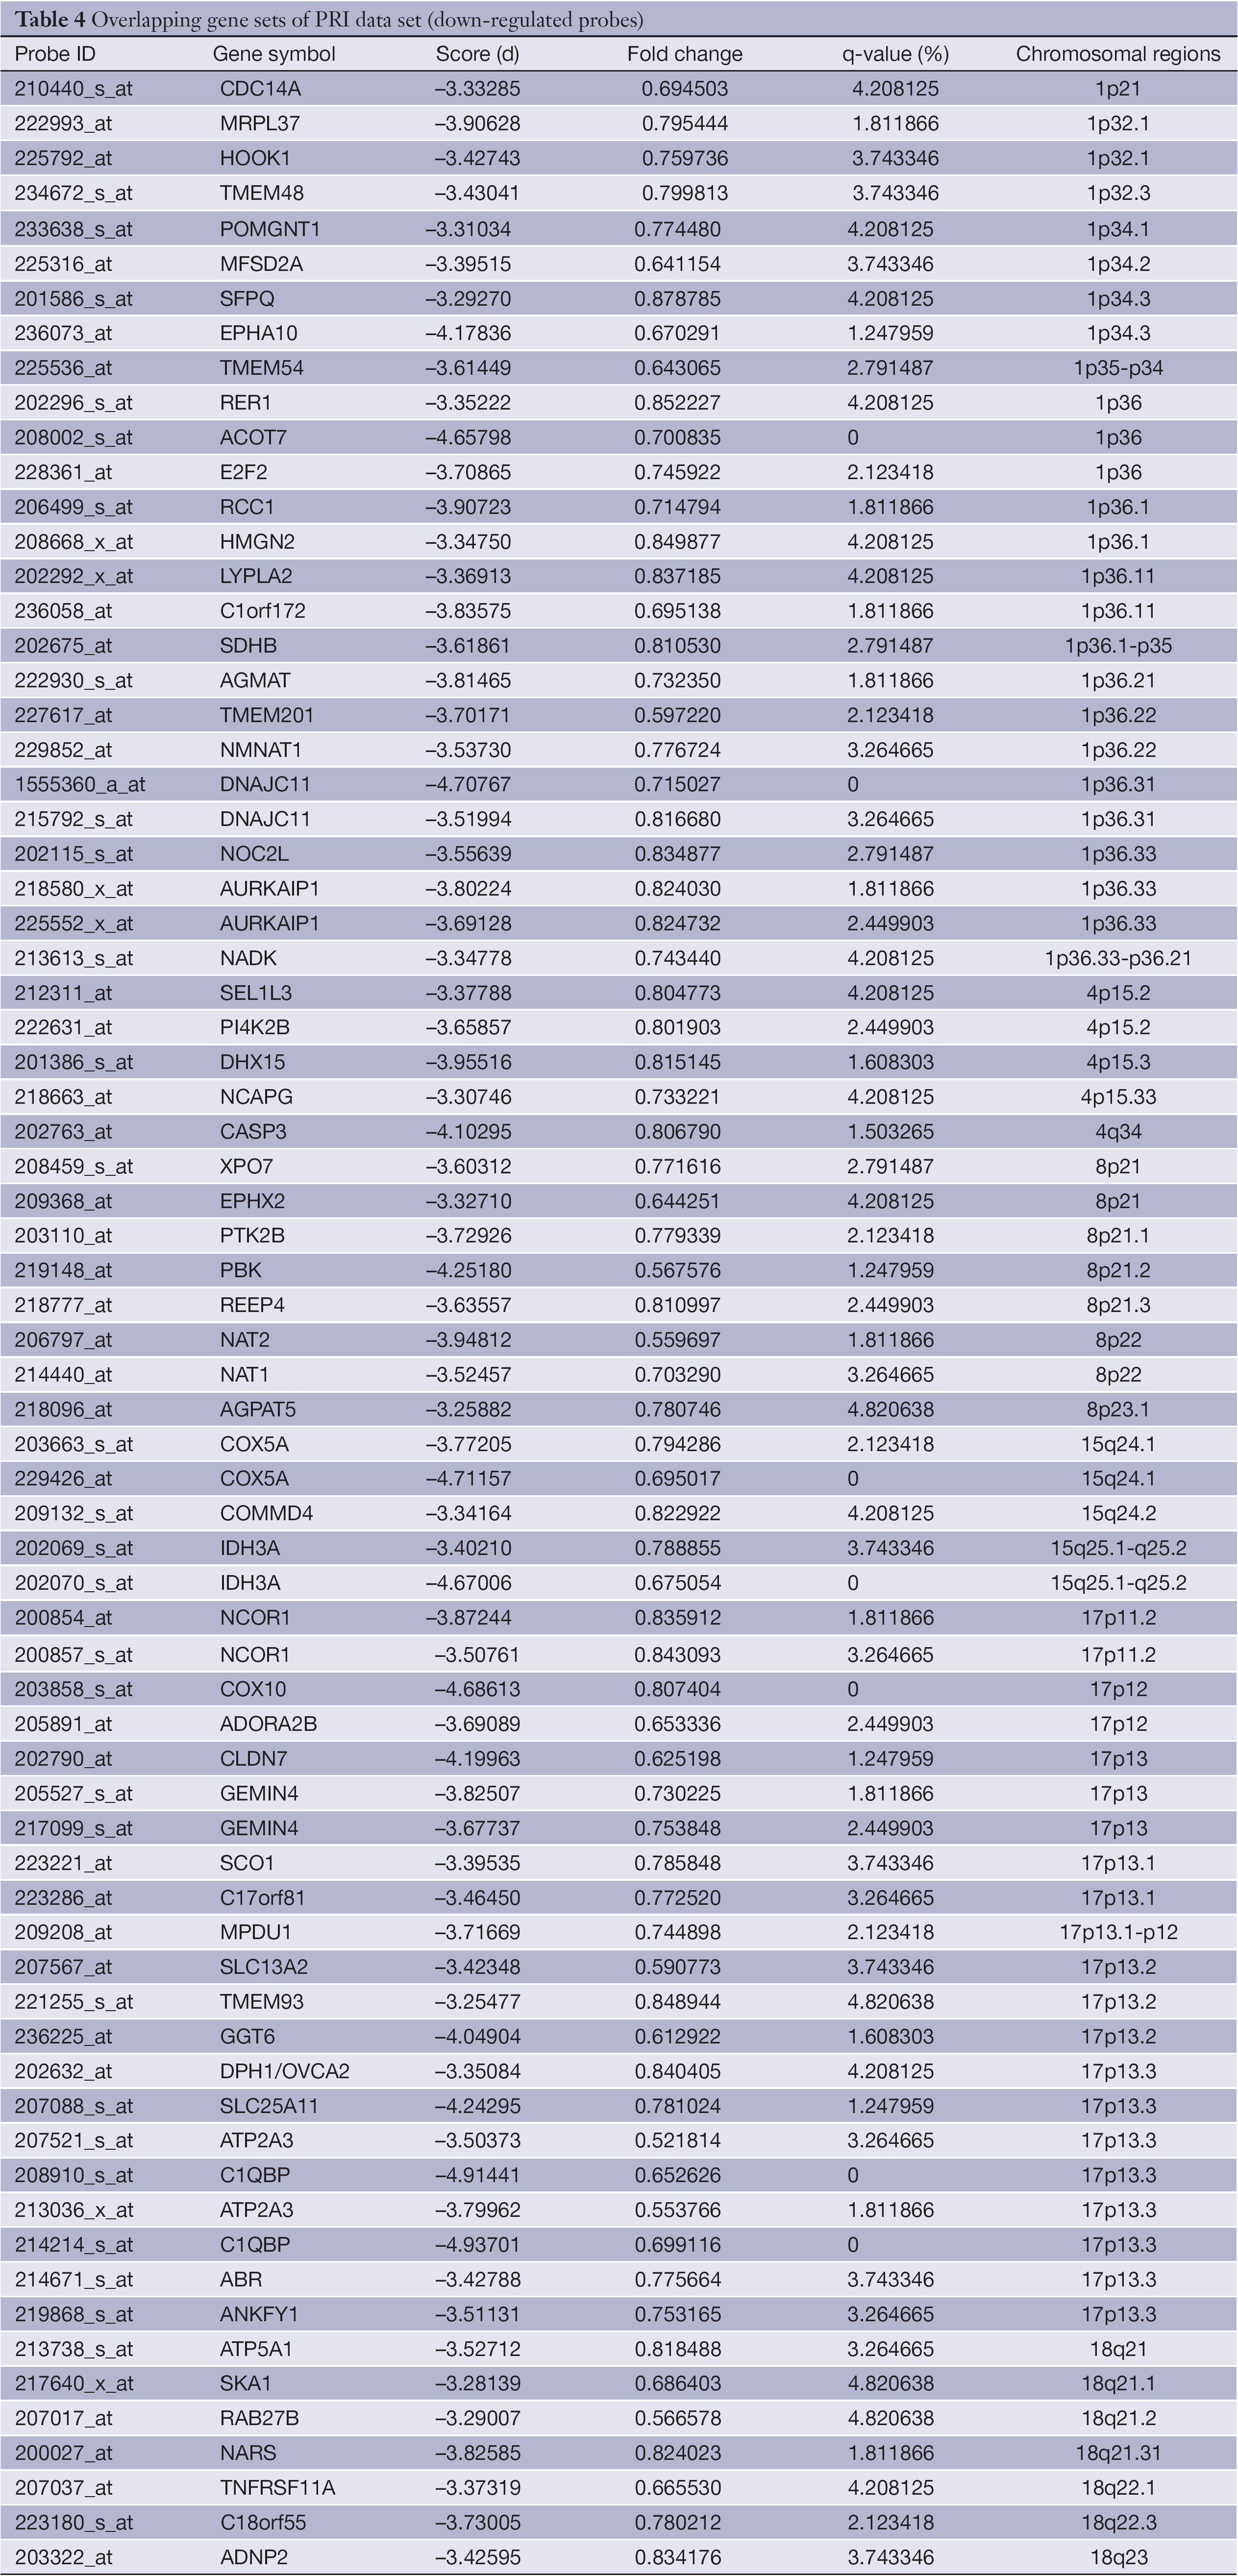
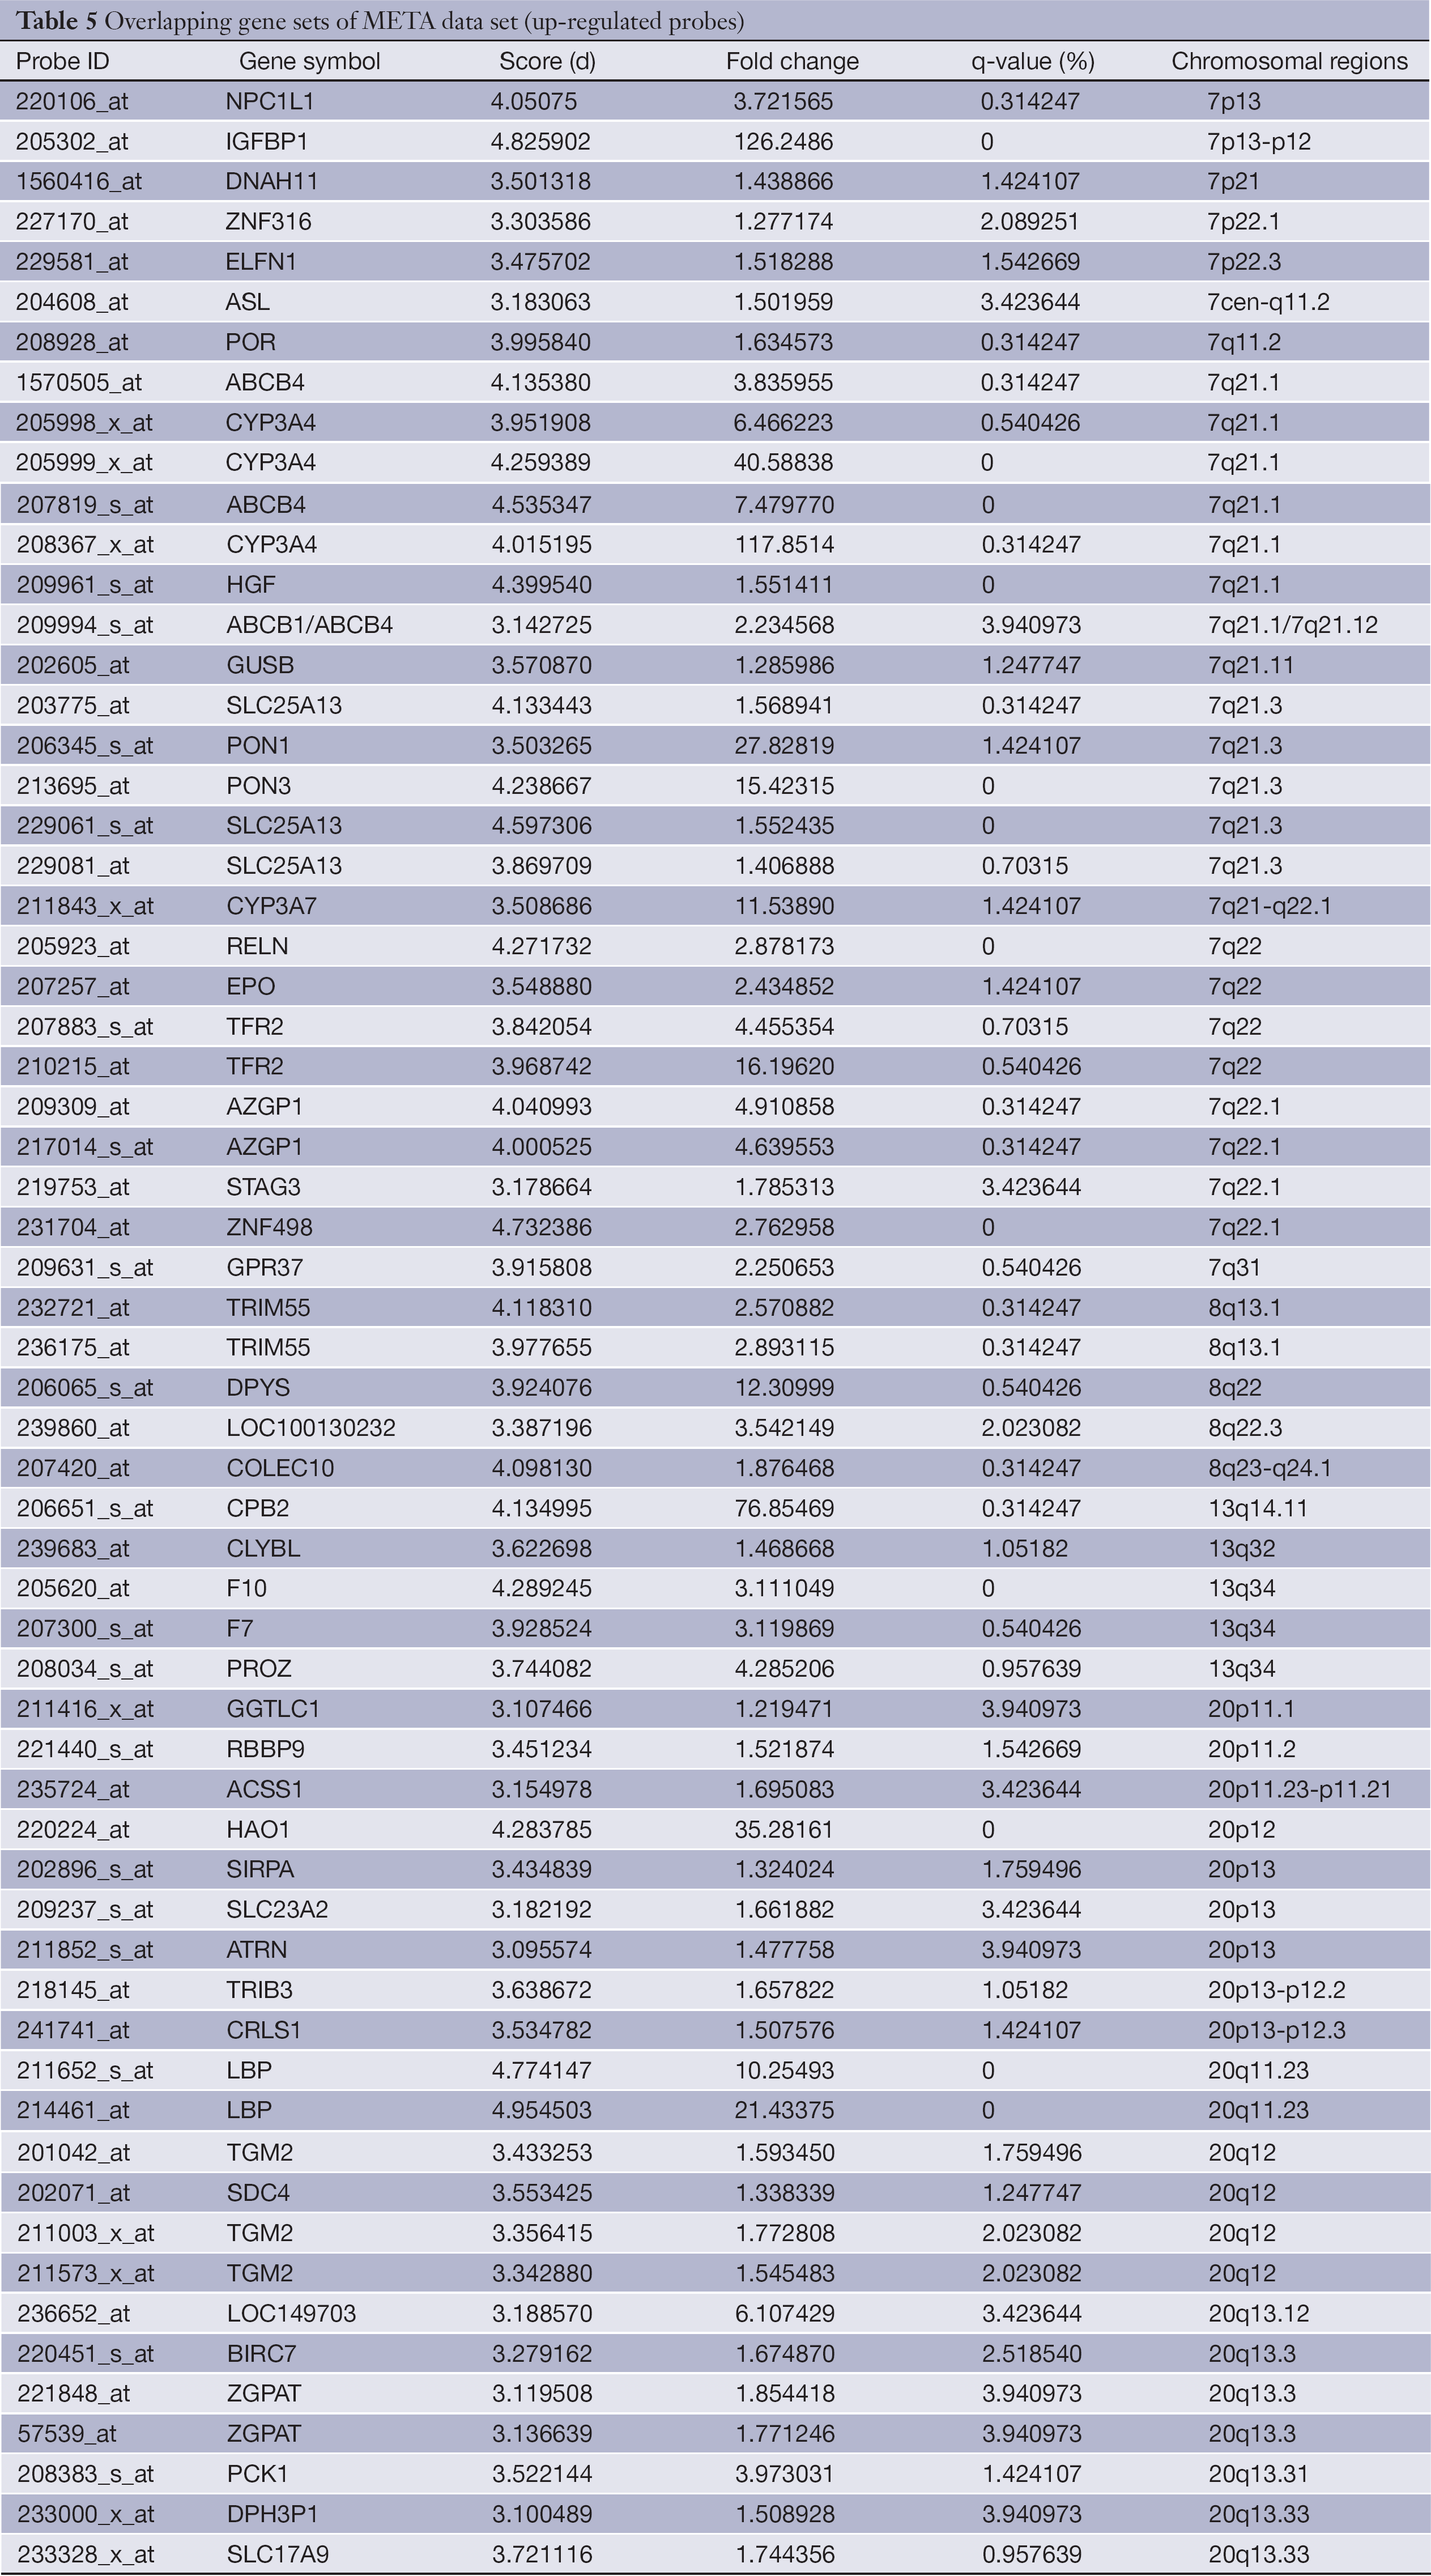
The overlapping gene sets were selected in which the gene expression changes and copy number changes were consistent. In other word, up-regulated genes were selected in chromosomal amplification sites, and down-regulated genes were selected in chromosomal deletion sites. The overlapping gene sets were obtained in PRI data sets (Tables 3,4) and META data sets (Tables 5,6), respectively.
Full table
Full table
Full table
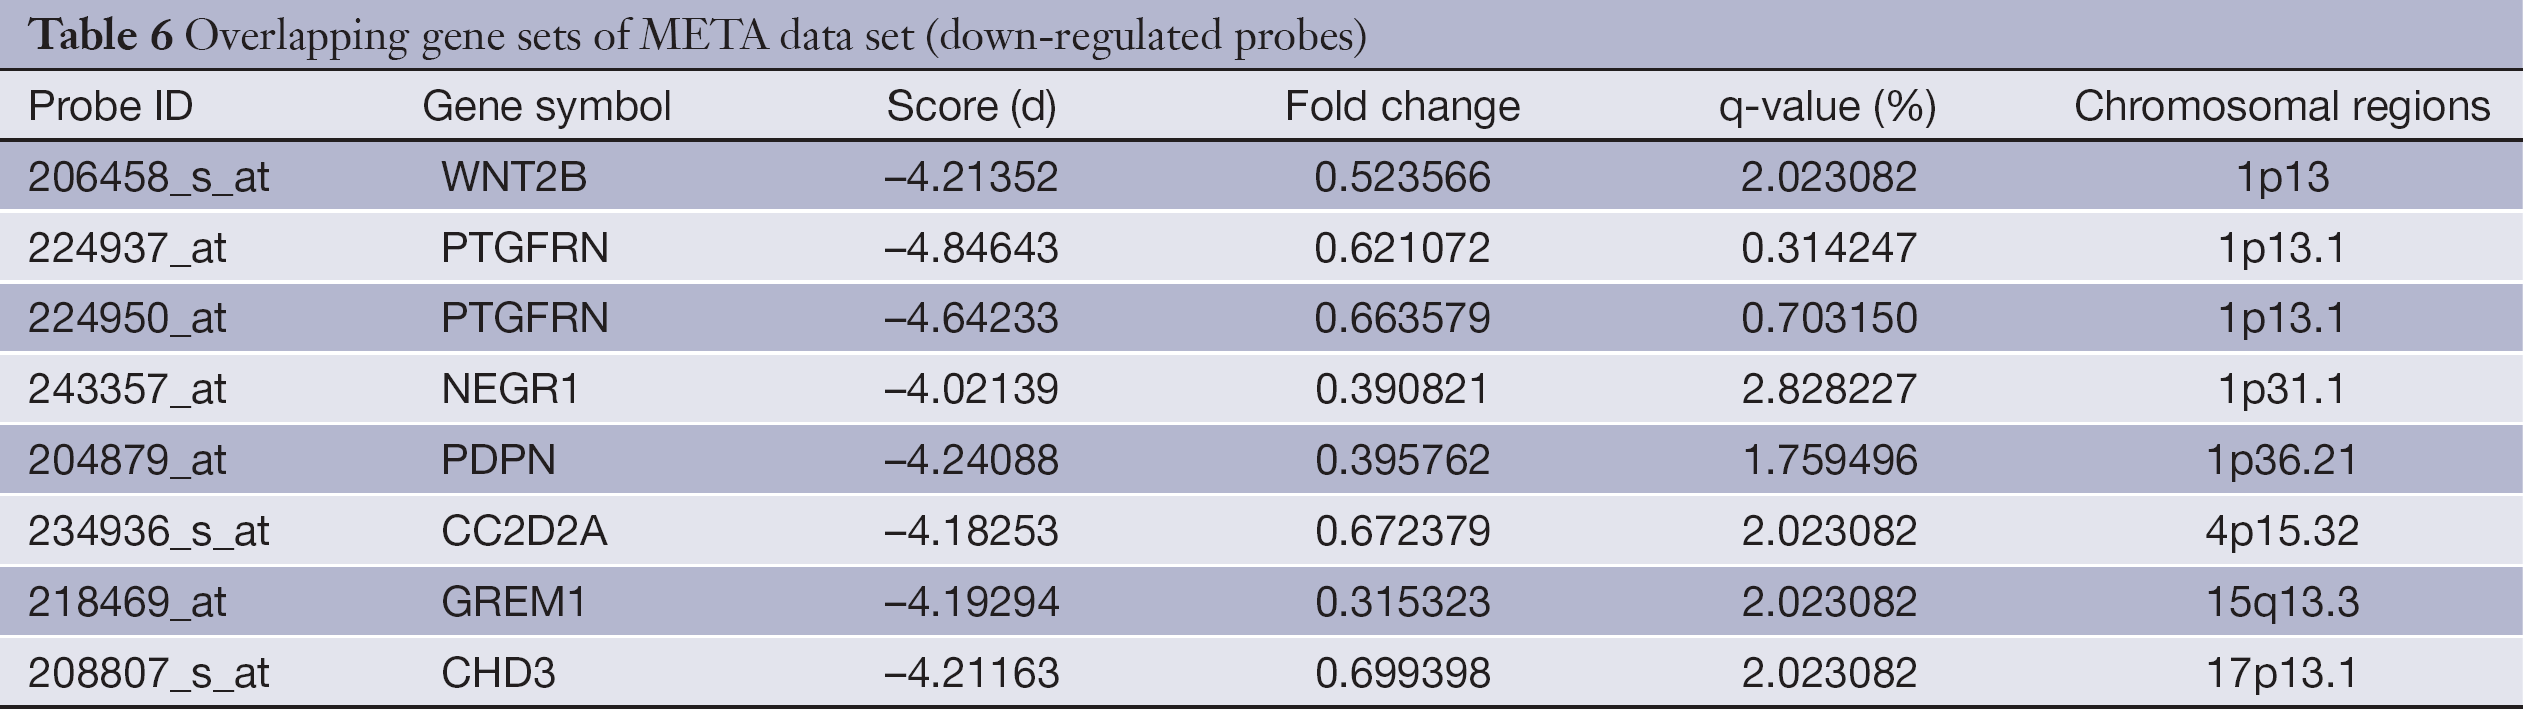
Full table
Enrichment analysis
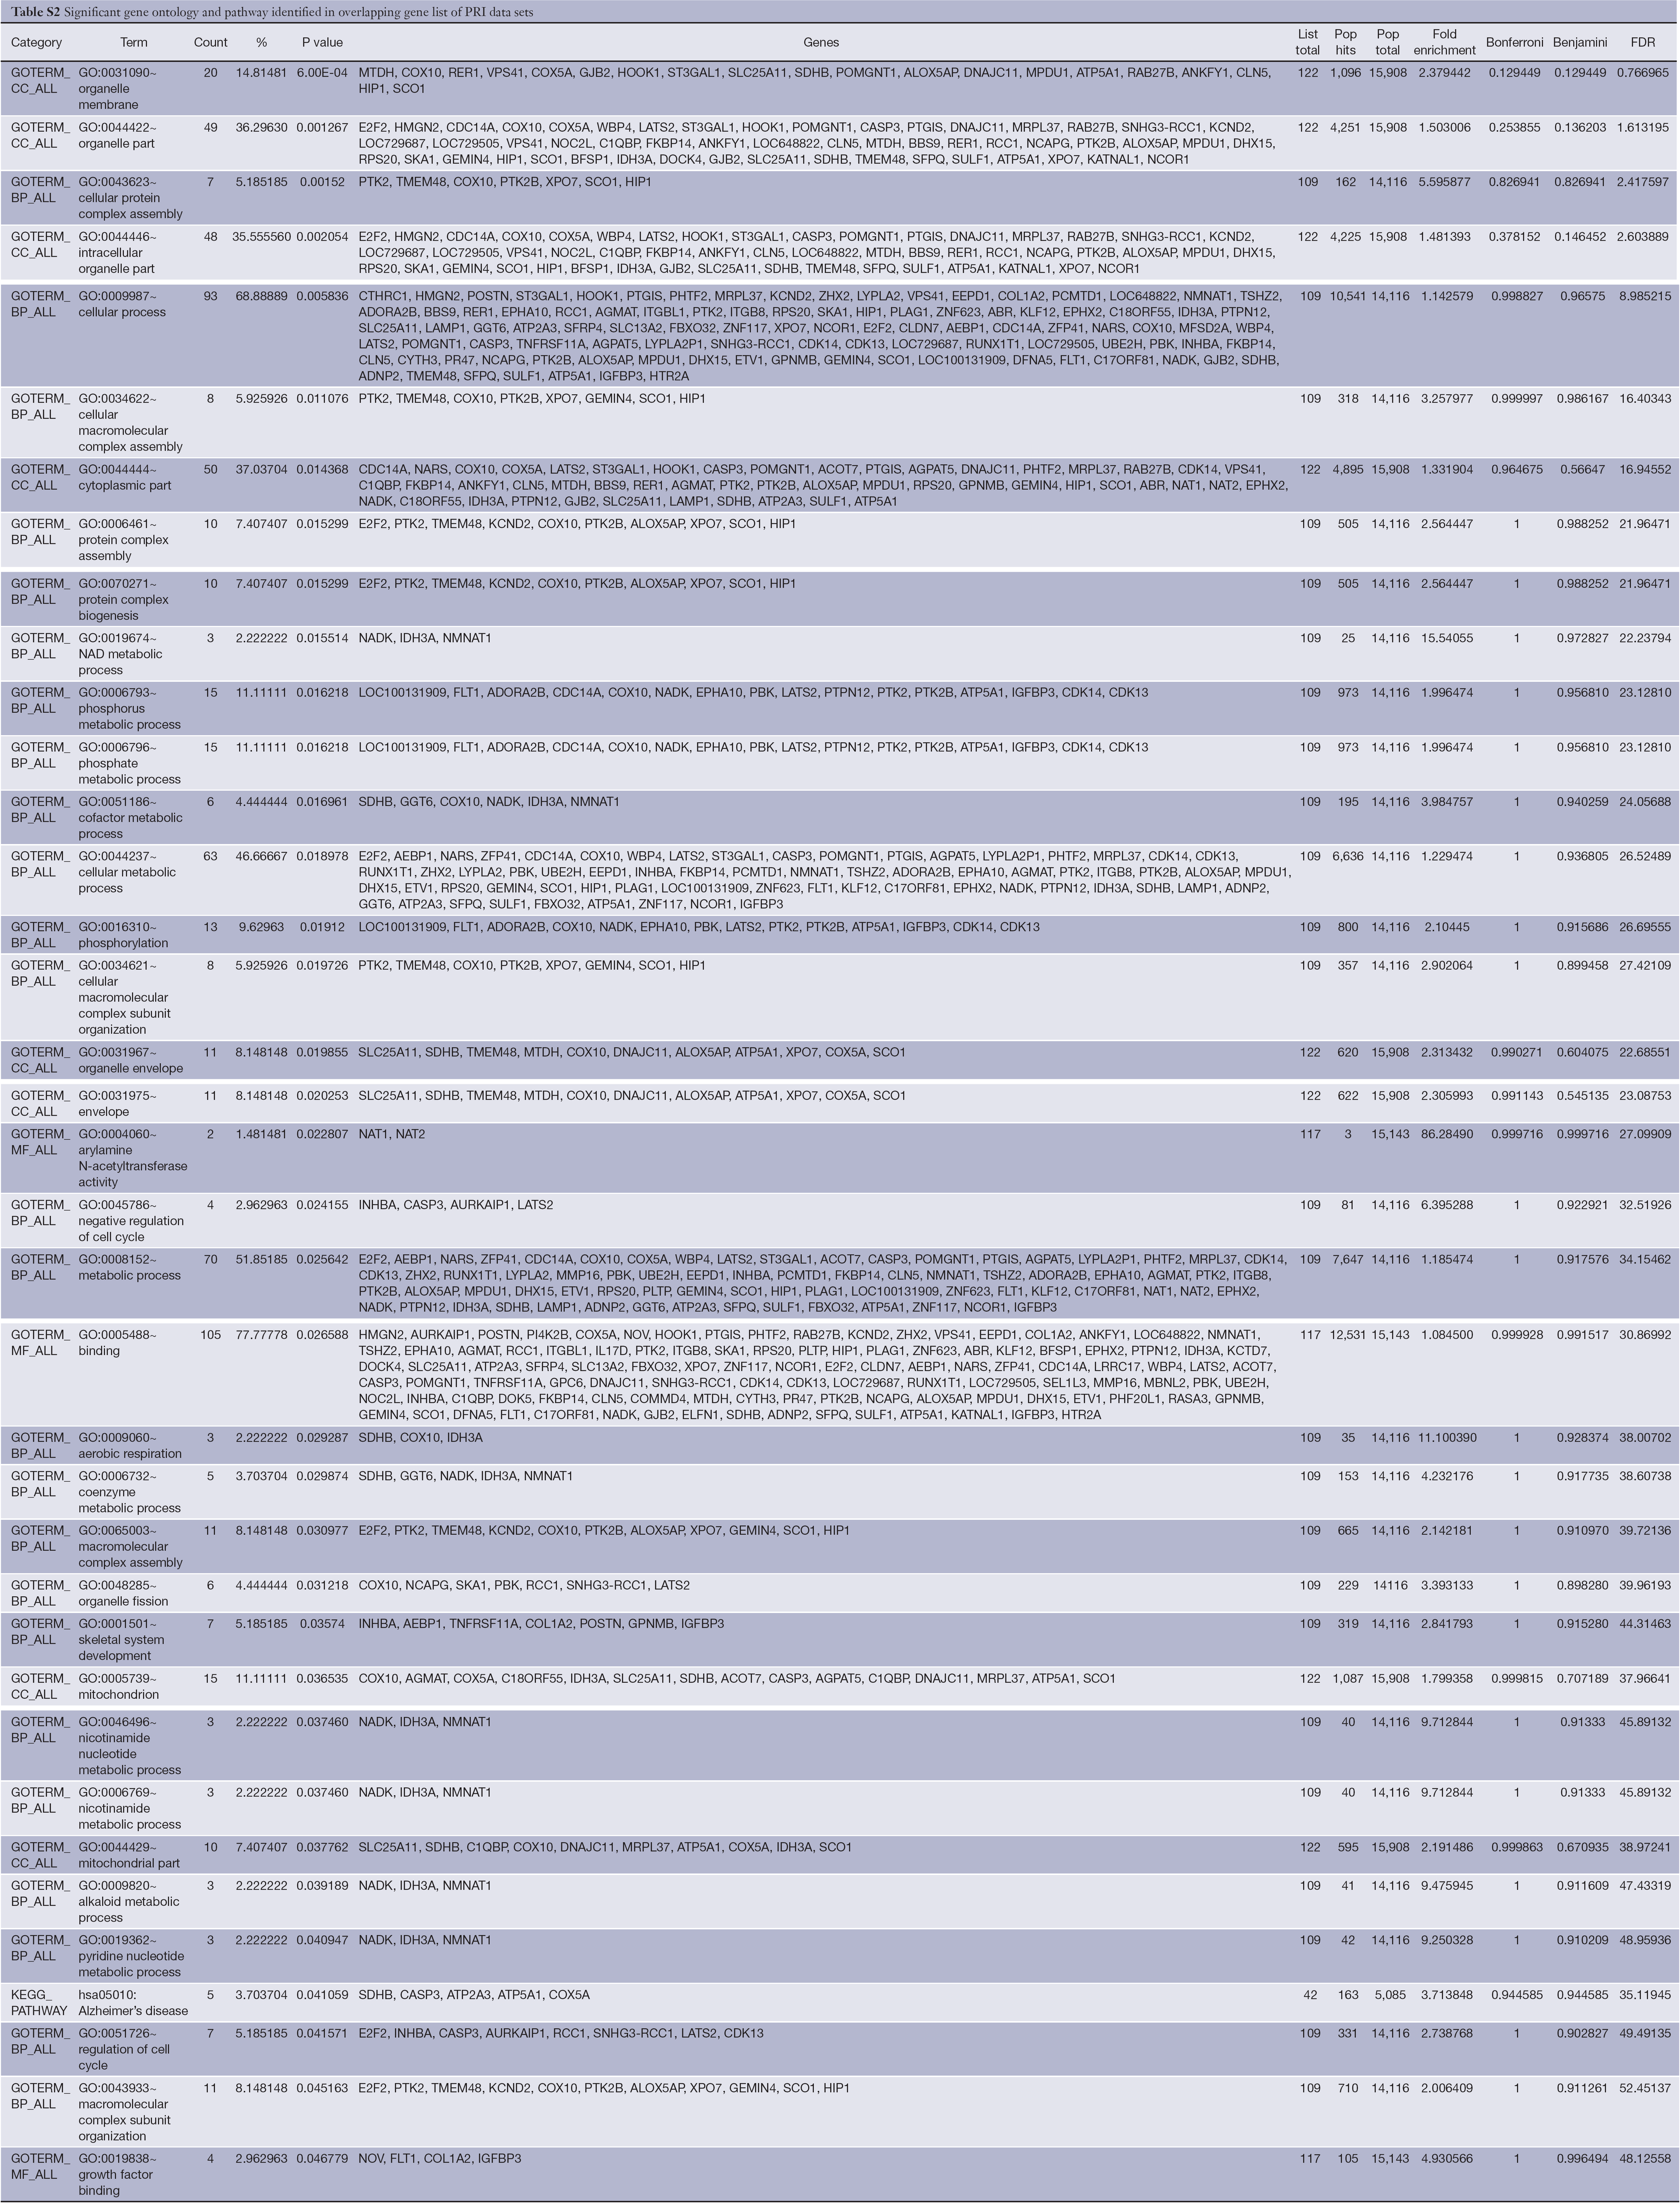
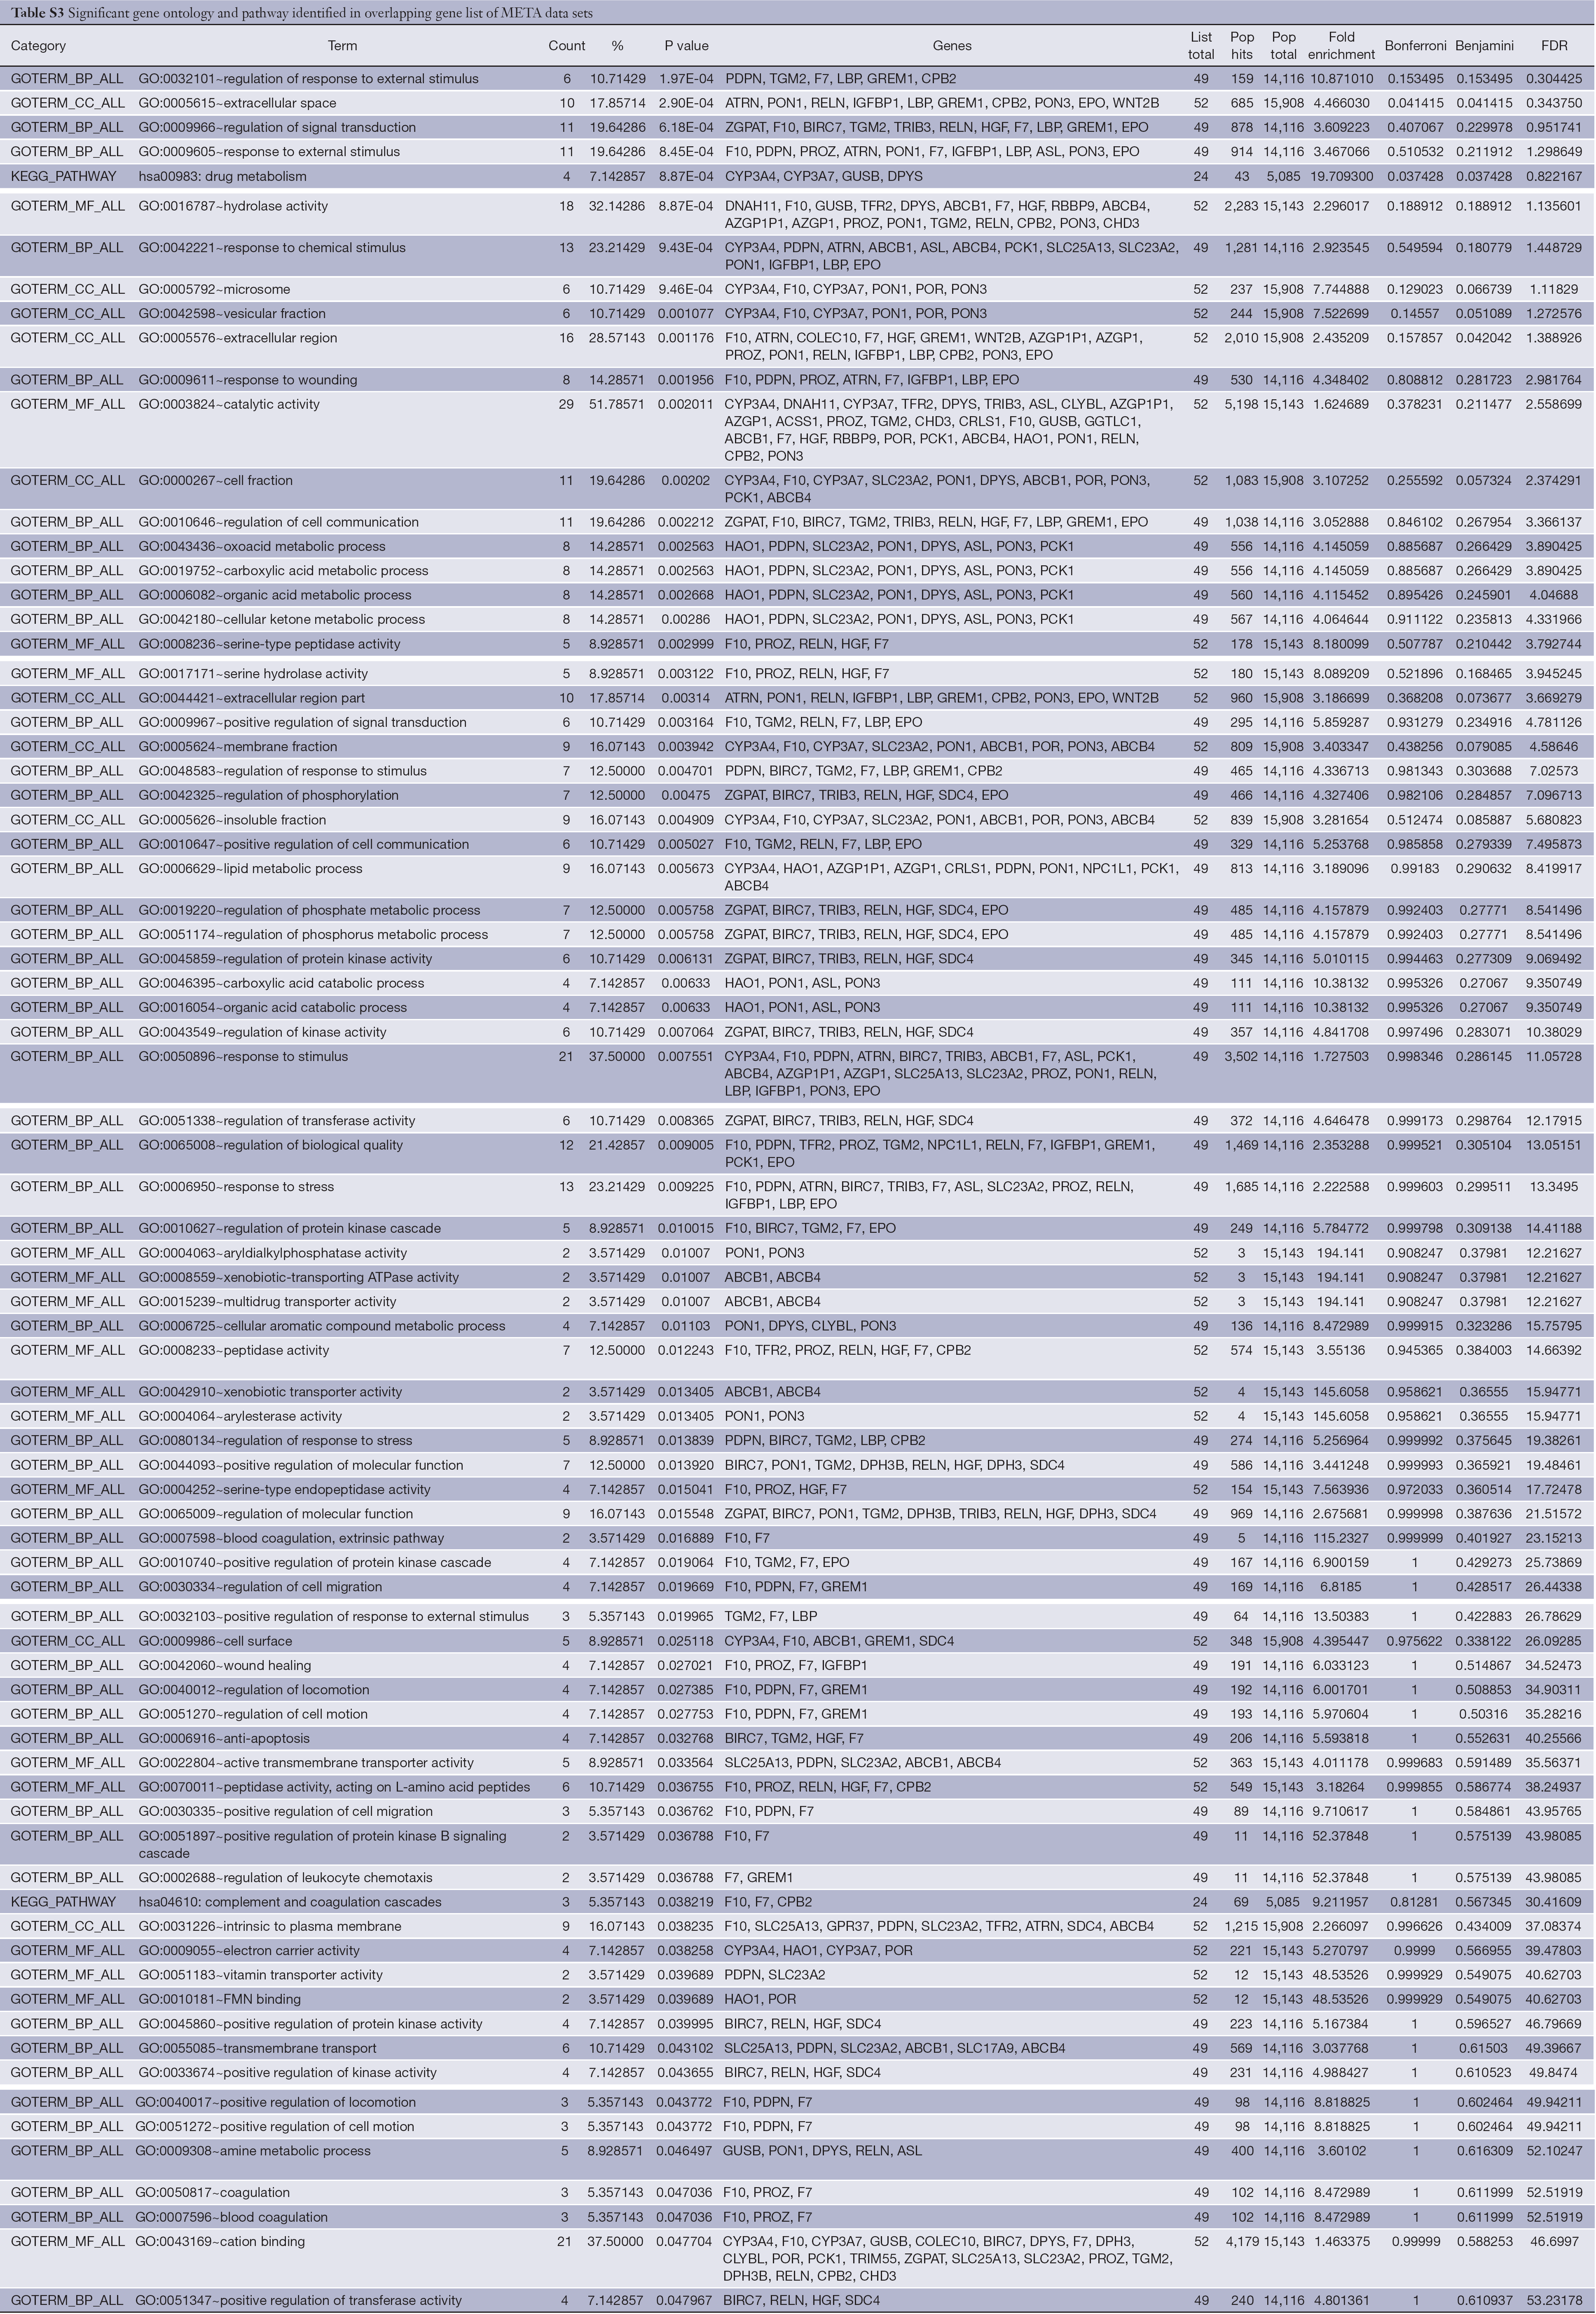
DAVID database was used to analyze the overlapping gene sets in PRI and META data sets. The Functional Annotation Chart tool was applied to analyze enriched annotations. Thirty-seven significant gene ontology and pathway (EASE score <0.05) were identified in the overlapping gene list of PRI data sets, and a detailed list is shown in Table S2. The top three significant gene annotations include organelle membrane (GO:0031090), organelle part (GO:0044422), and cellular protein complex assembly (GO:0043623). In the overlapping gene list of META data sets, 79 significant gene ontology and pathway (EASE score <0.05) were identified, and a detailed list is shown in Table S3. The top three significant gene annotations include regulation of response to external stimulus (GO:0032101), extracellular space (GO:0005615), and regulation of signal transduction (GO:0009966).
Full table
Full table
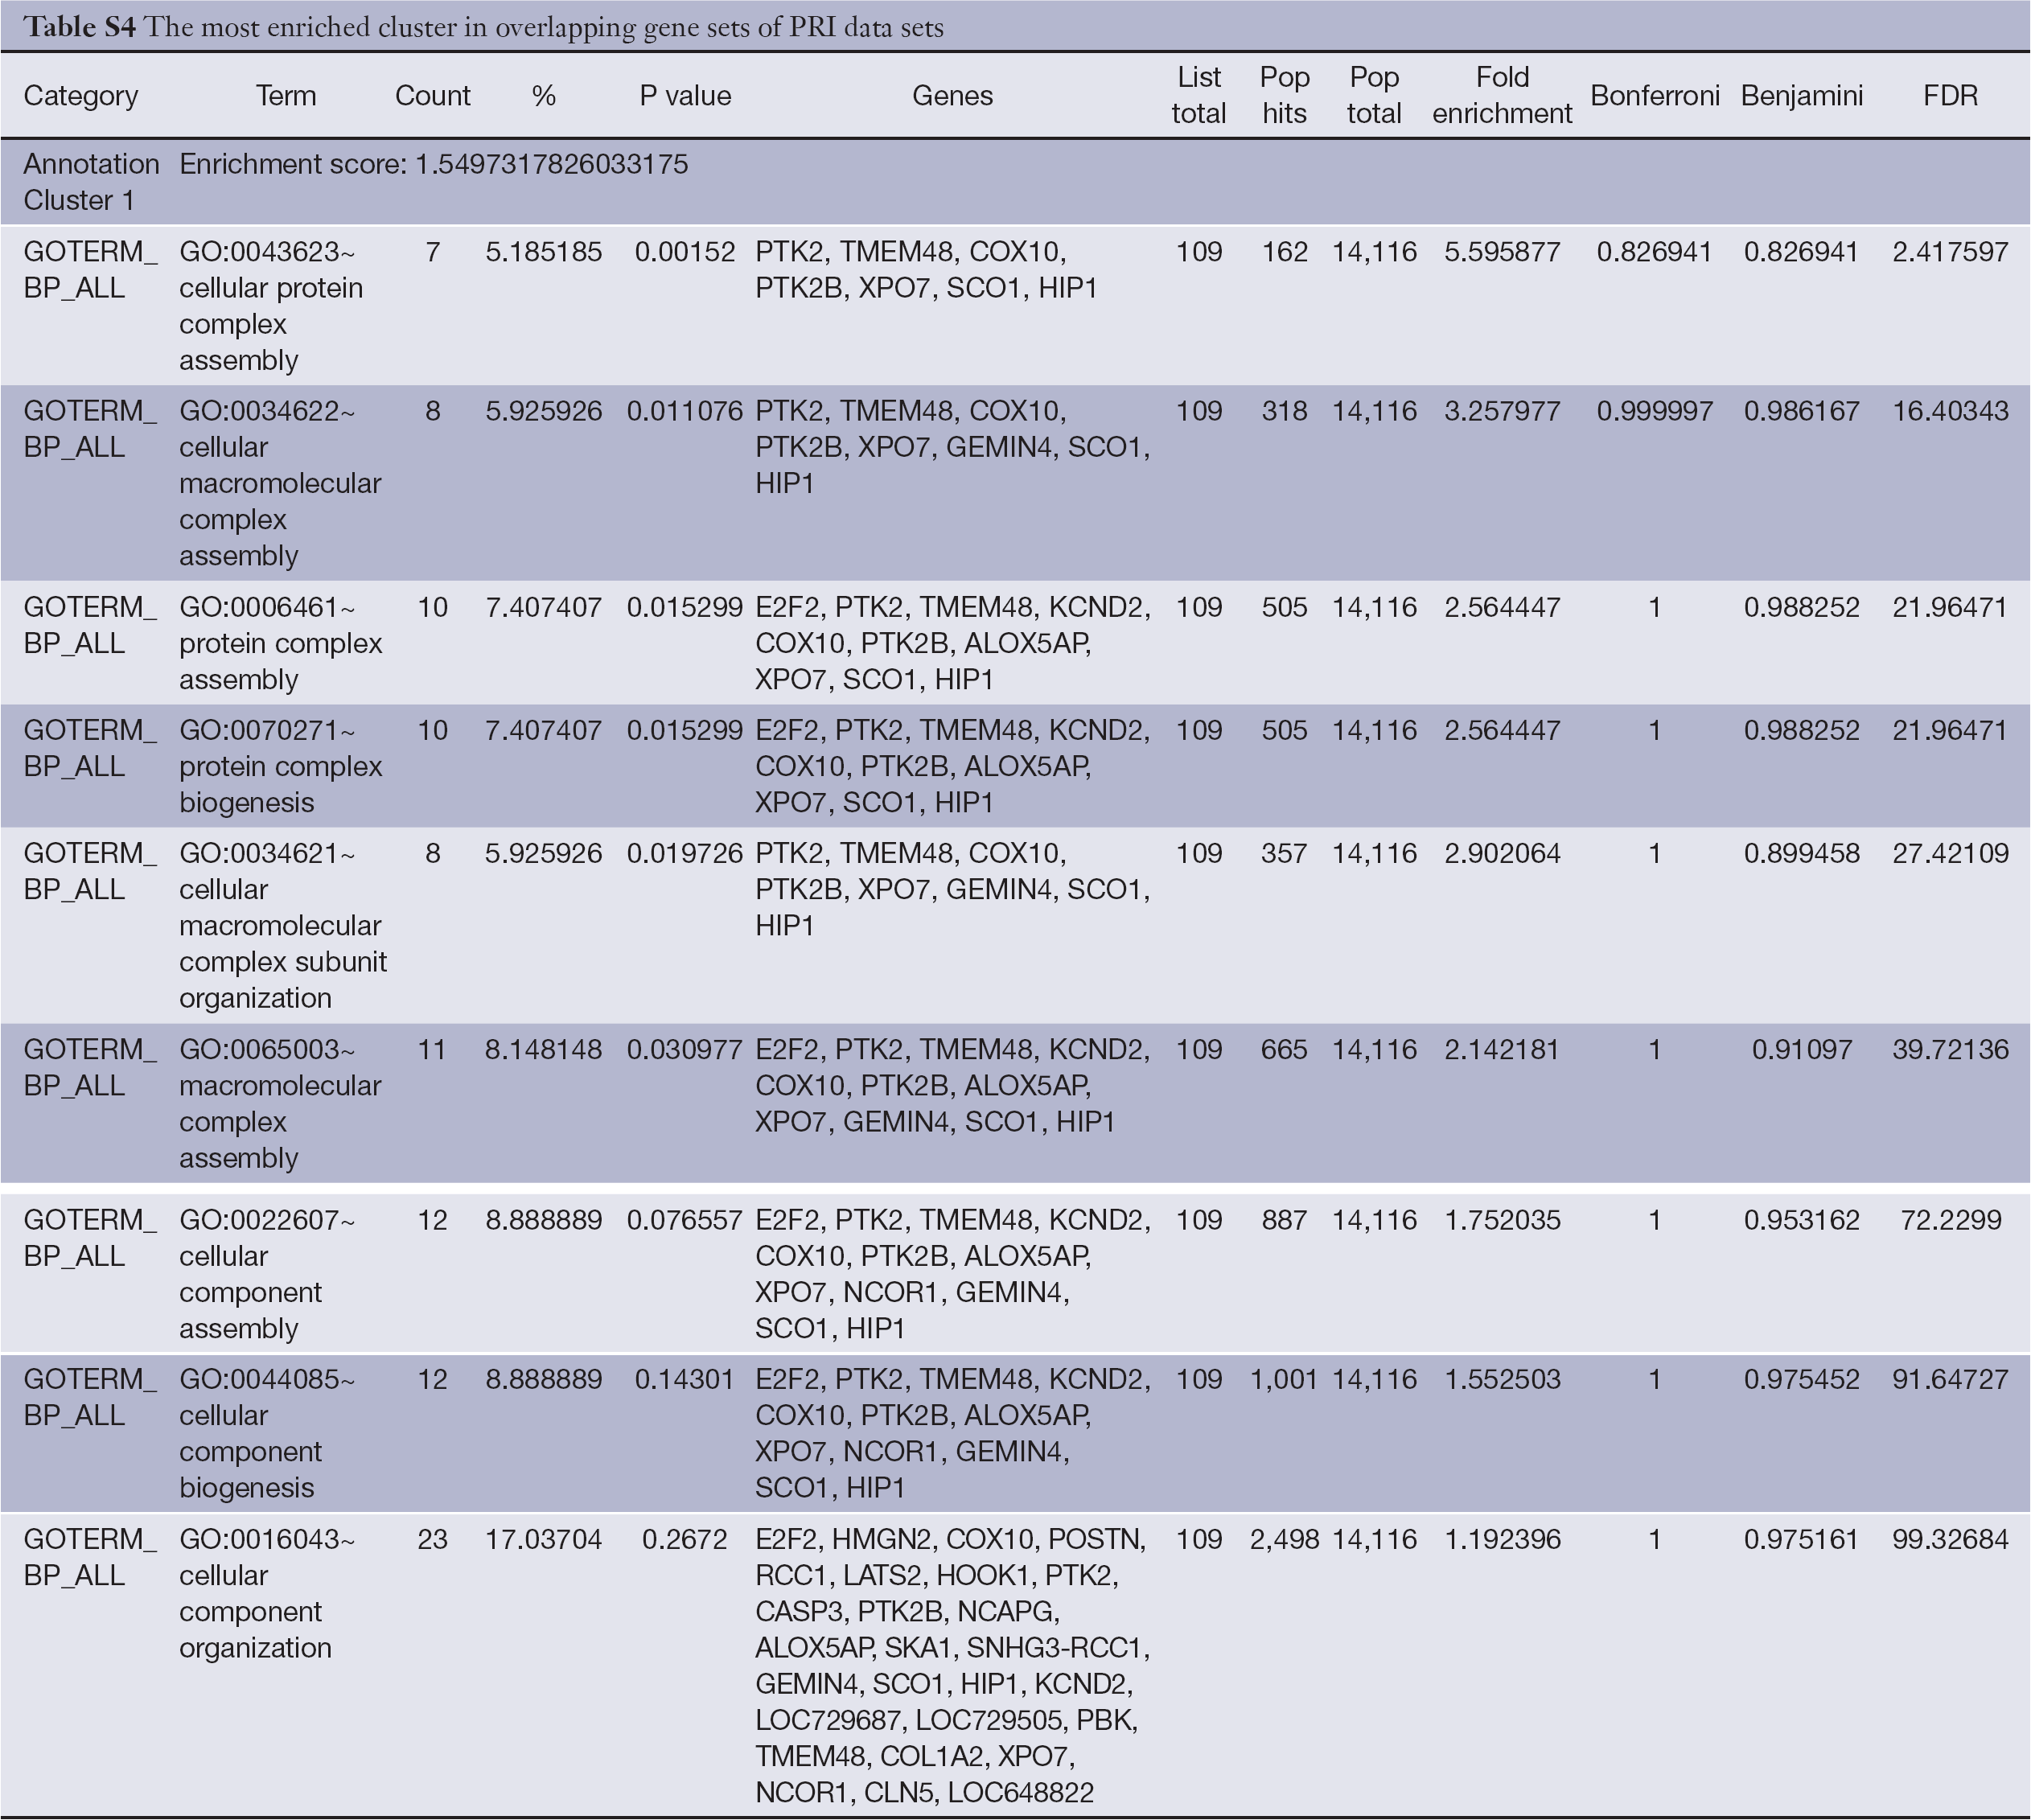
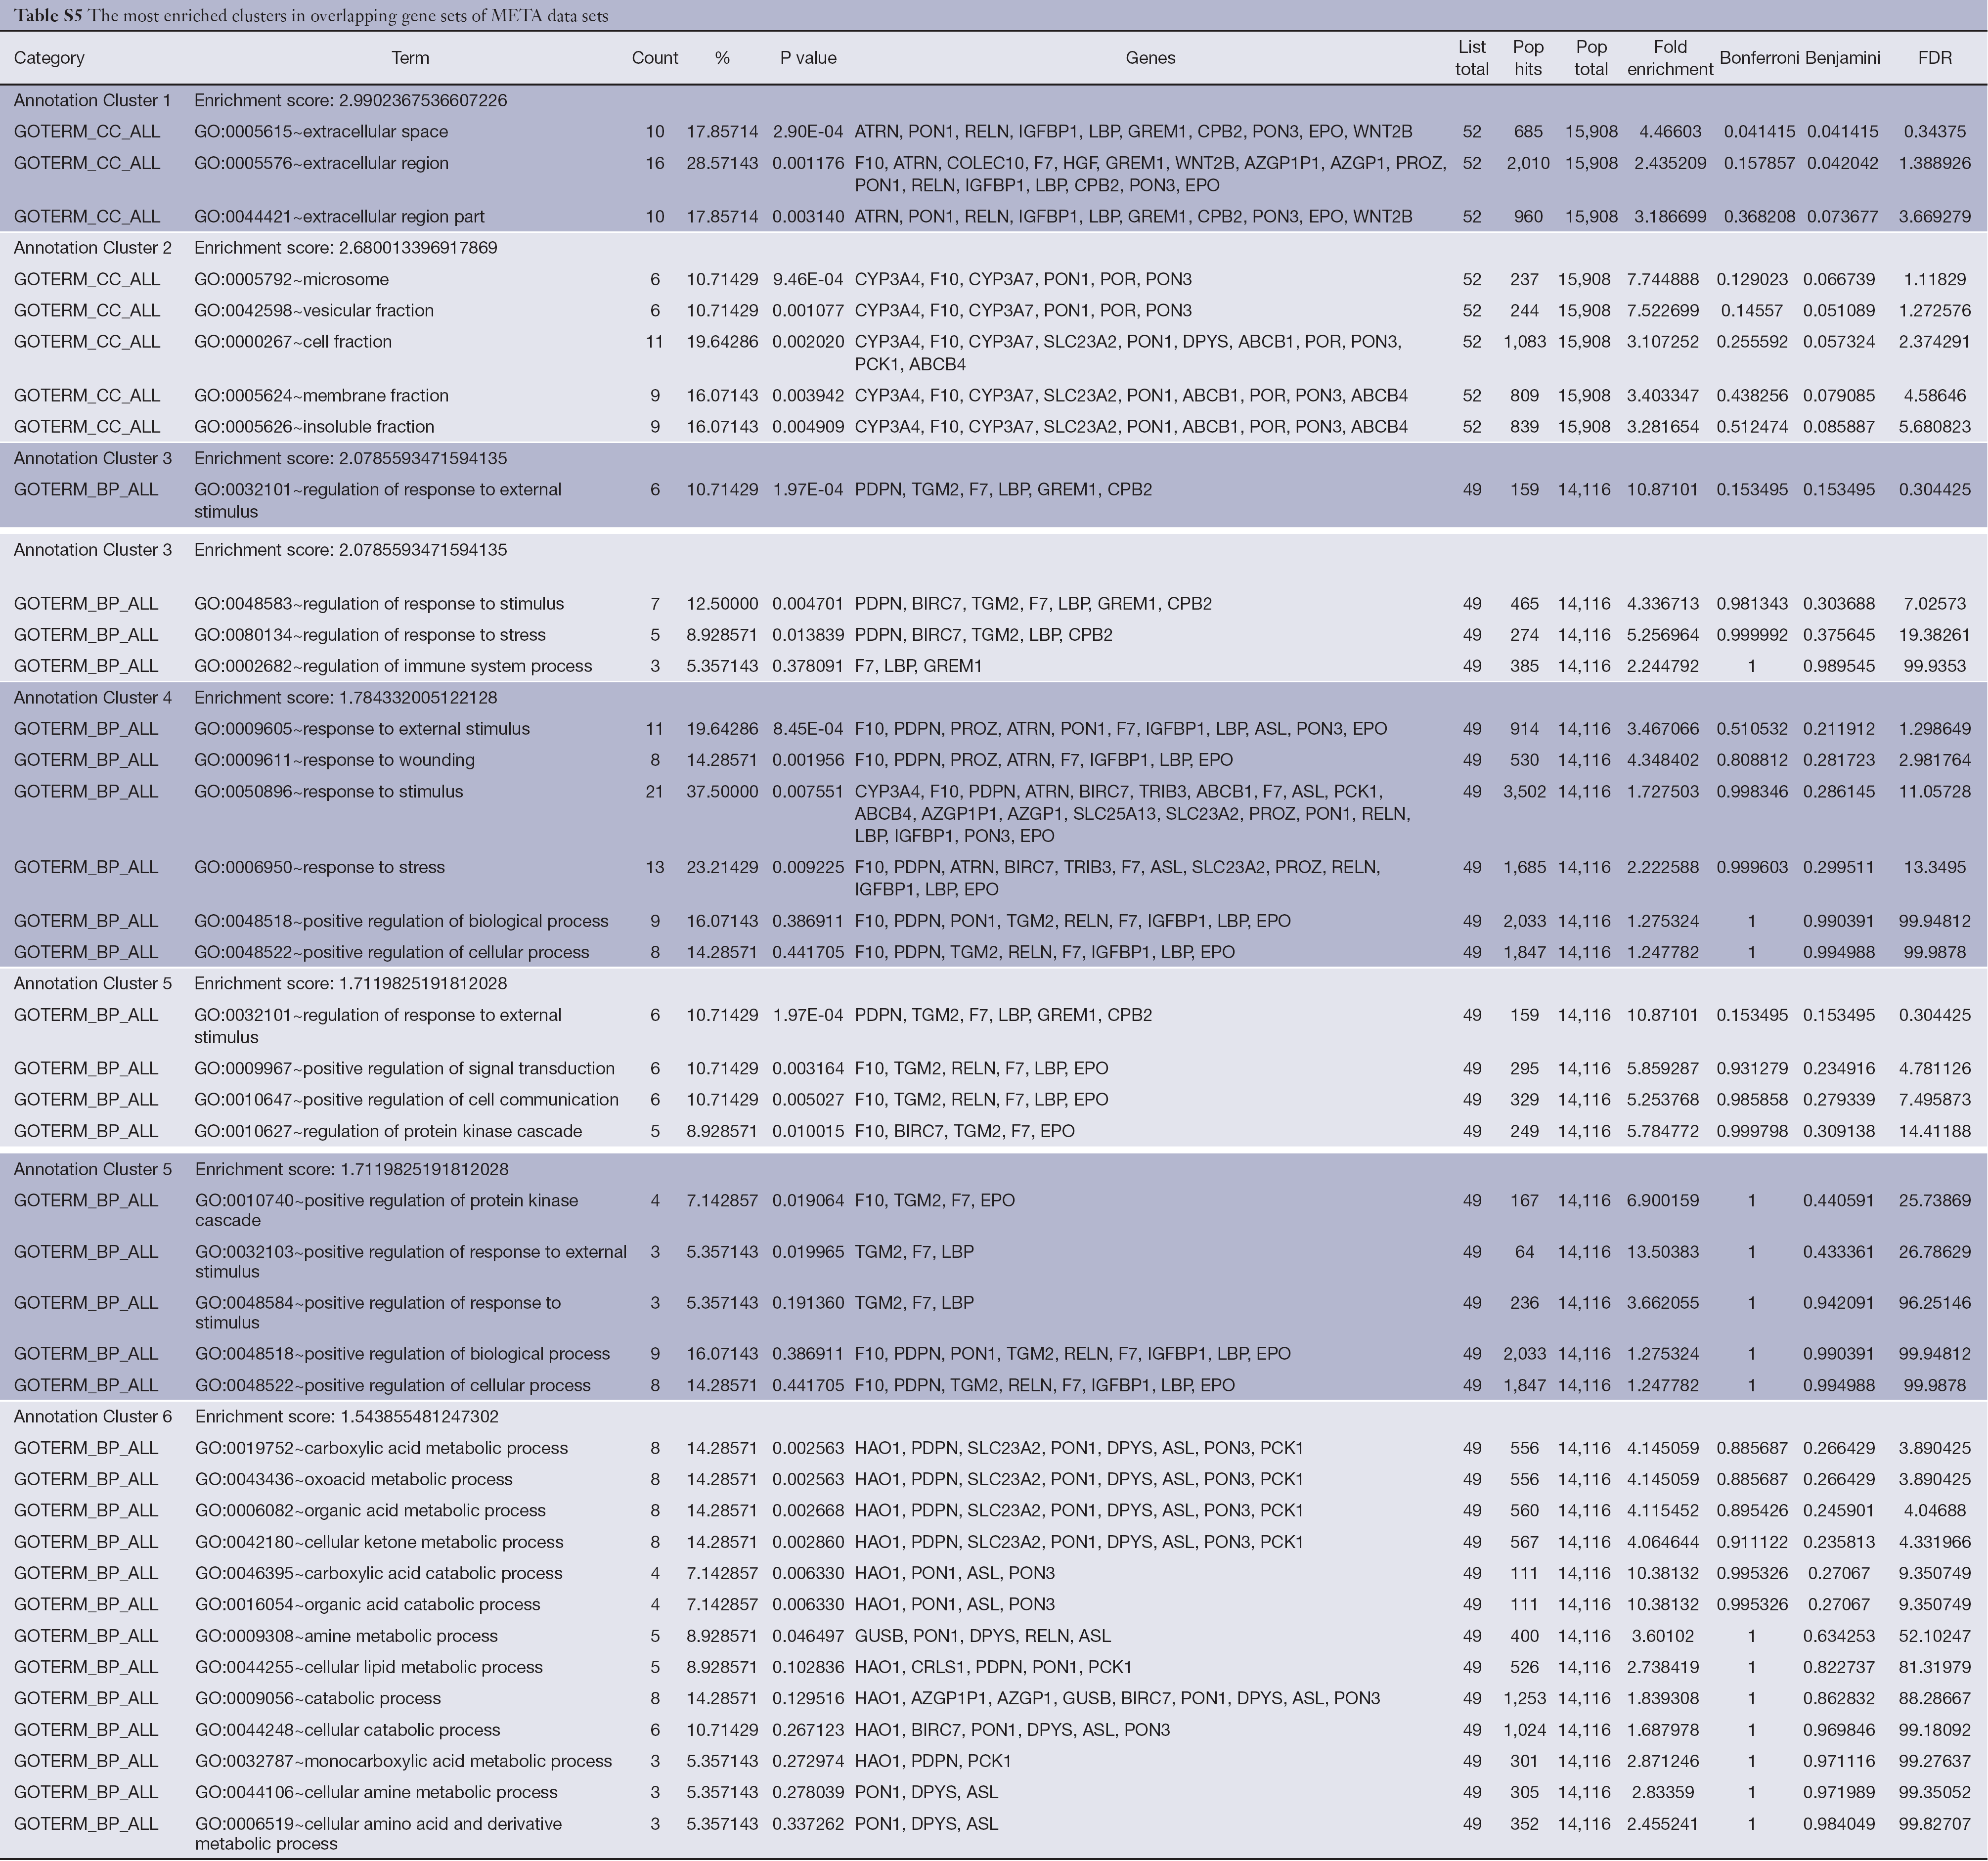
The Functional Annotation Clustering tool was applied to cluster functionally related annotations into a group, and the default settings were used (classification stringency is medium). In the overlapping gene sets of PRI data sets, the most enriched cluster is biological process of cellular component organization and cellular component biogenesis, and a detailed list is shown in Table S4 (enrichment score >1.5). The most enriched cluster in the overlapping gene sets of META data sets is cellular components of extracellular region, and a detailed list is shown in Table S5 (enrichment score >1.5).
Full table
Full table
SVM-T-RFE gene selection algorithm
SVM-T-RFE gene selection algorithm was applied to select informative genes in PRI data set. The initial overlapping gene sets (PRI-GS-OL) of PRI data set contained 161 probes. SVM-T-RFE gene selection algorithm generates ranked gene set, where the genes rank from high to low score. The number of genes was reduced from 161 to 1, and LOOCV method was used to assess the performance of the classifier. Parameter θ in SVM-T-RFE gene selection algorithm was selected from finite set {0, 0.01, 0.02,..0.98, 0.00, 1.0}, where each element increases from 0 to 1 by a step of 0.01. When parameter θ was set to 0.51, a minimum gene set was obtained with the minimum number (14) of genes, and the highest classification accuracy (100%) (Figure 2).
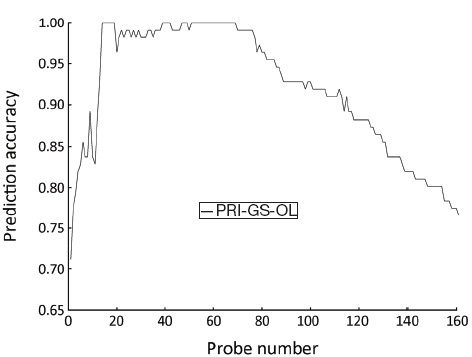
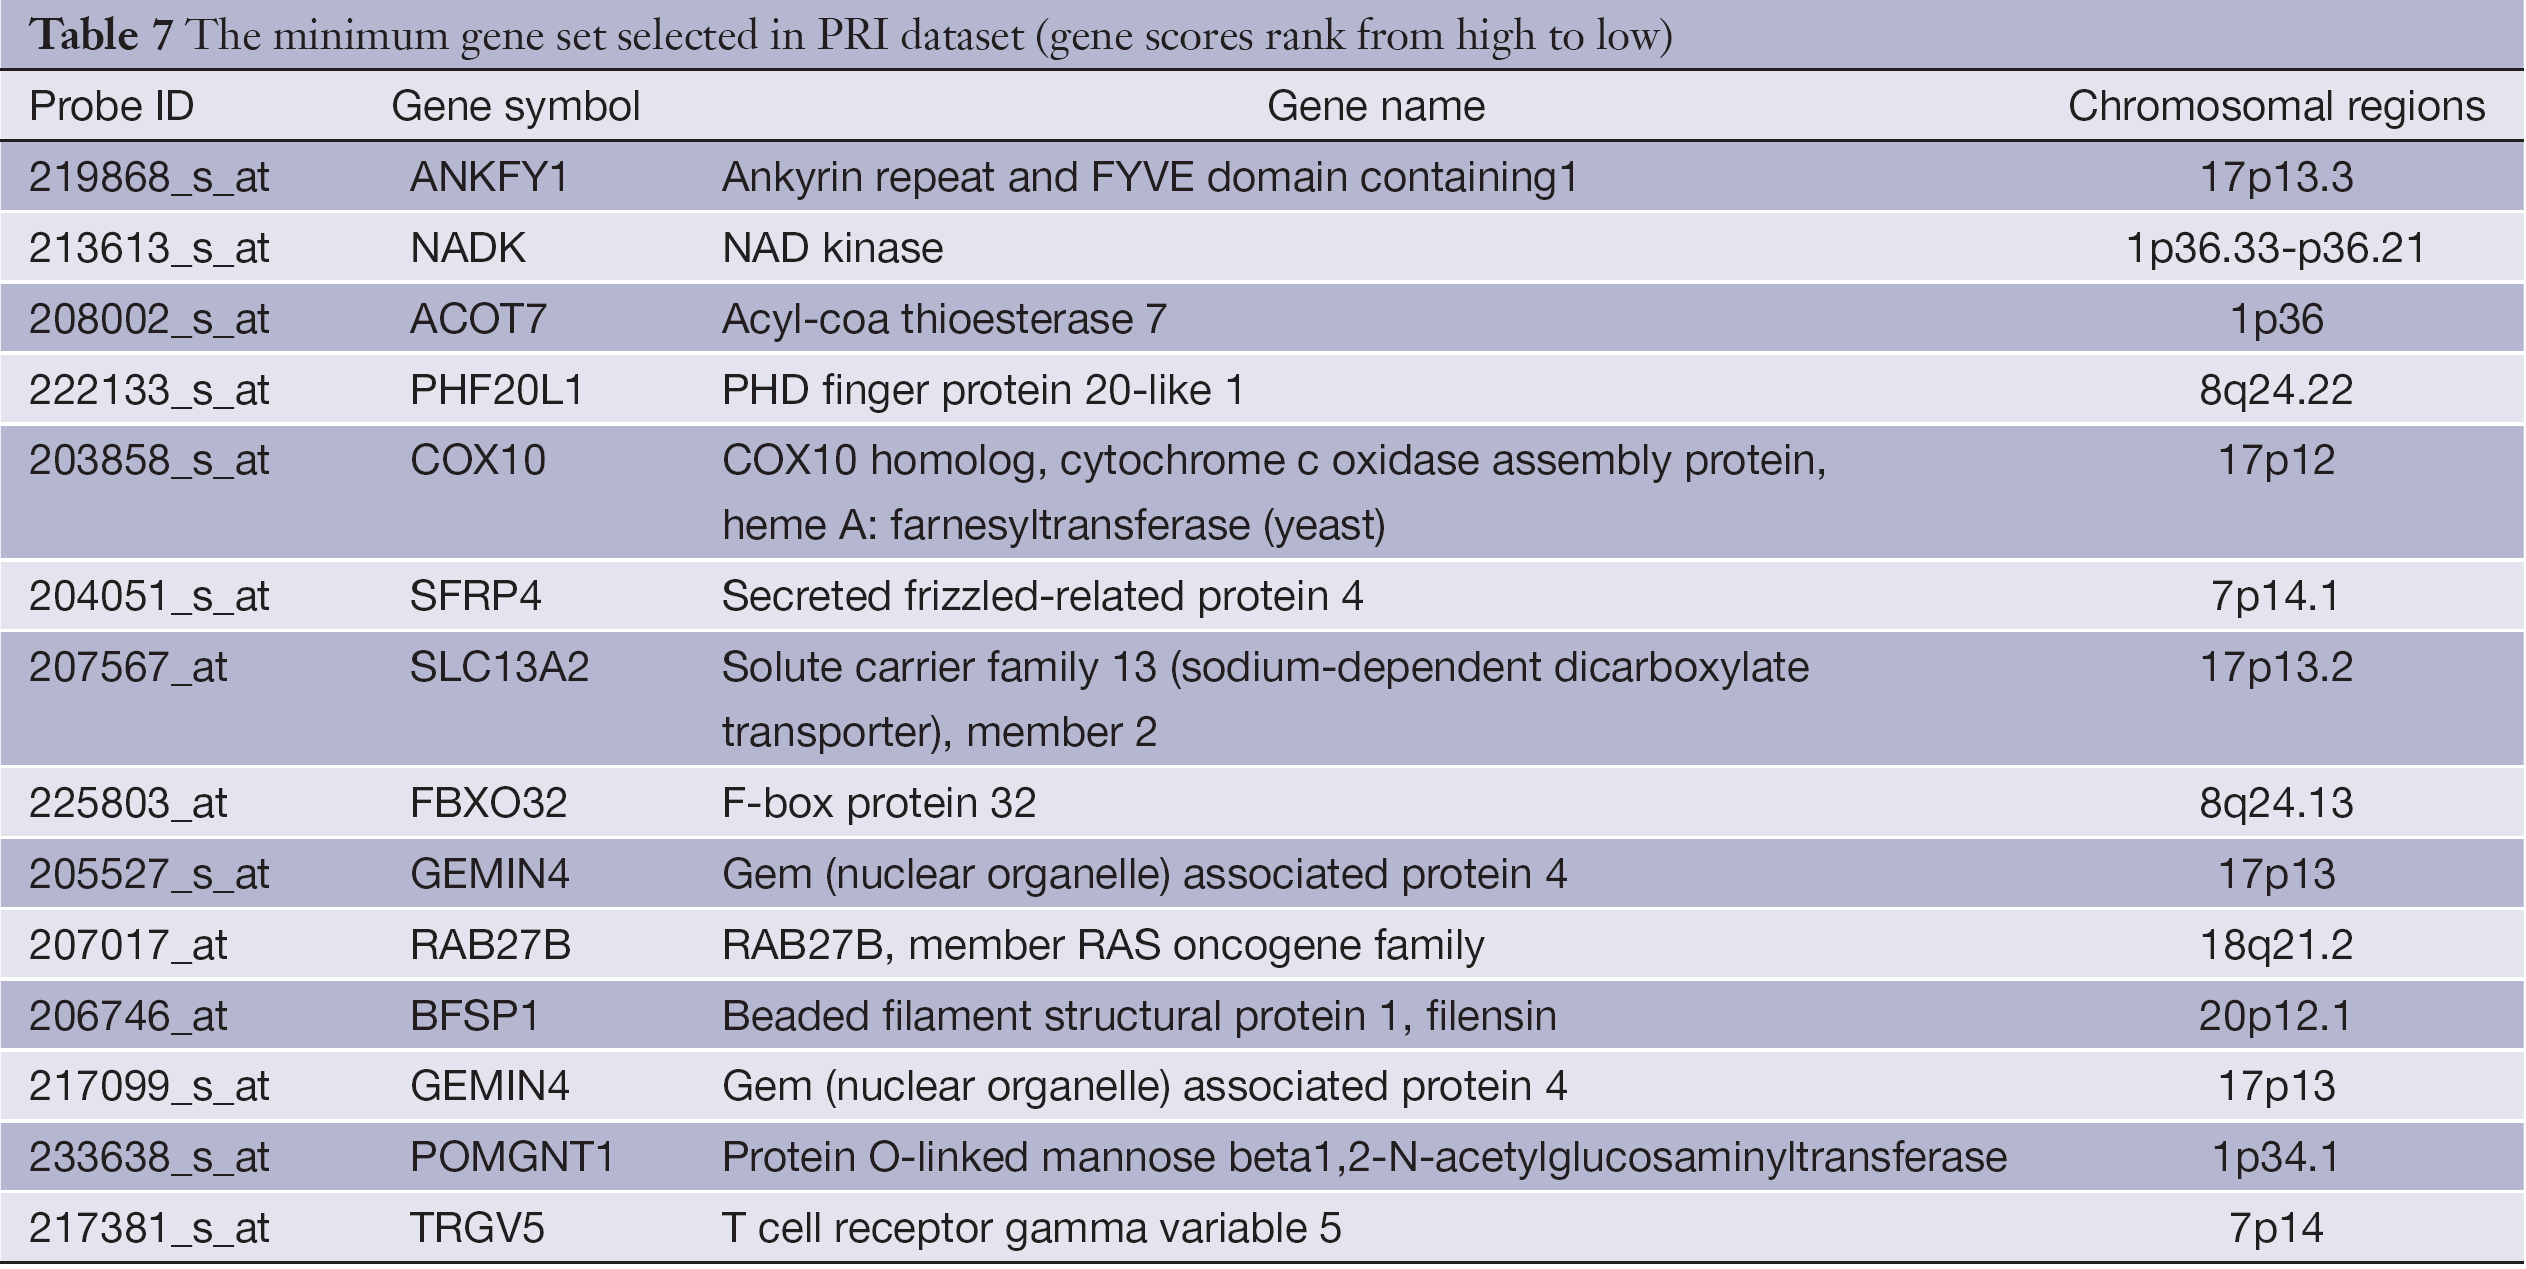
Table 7 shows the minimum gene set of PRI data set. Secreted frizzled-related protein 4 (SFRP4) (21), and RAB27B, member RAS oncogene family (RAB27B) (22,23) were reported to be associated with CRC or its metastasis.
Full table
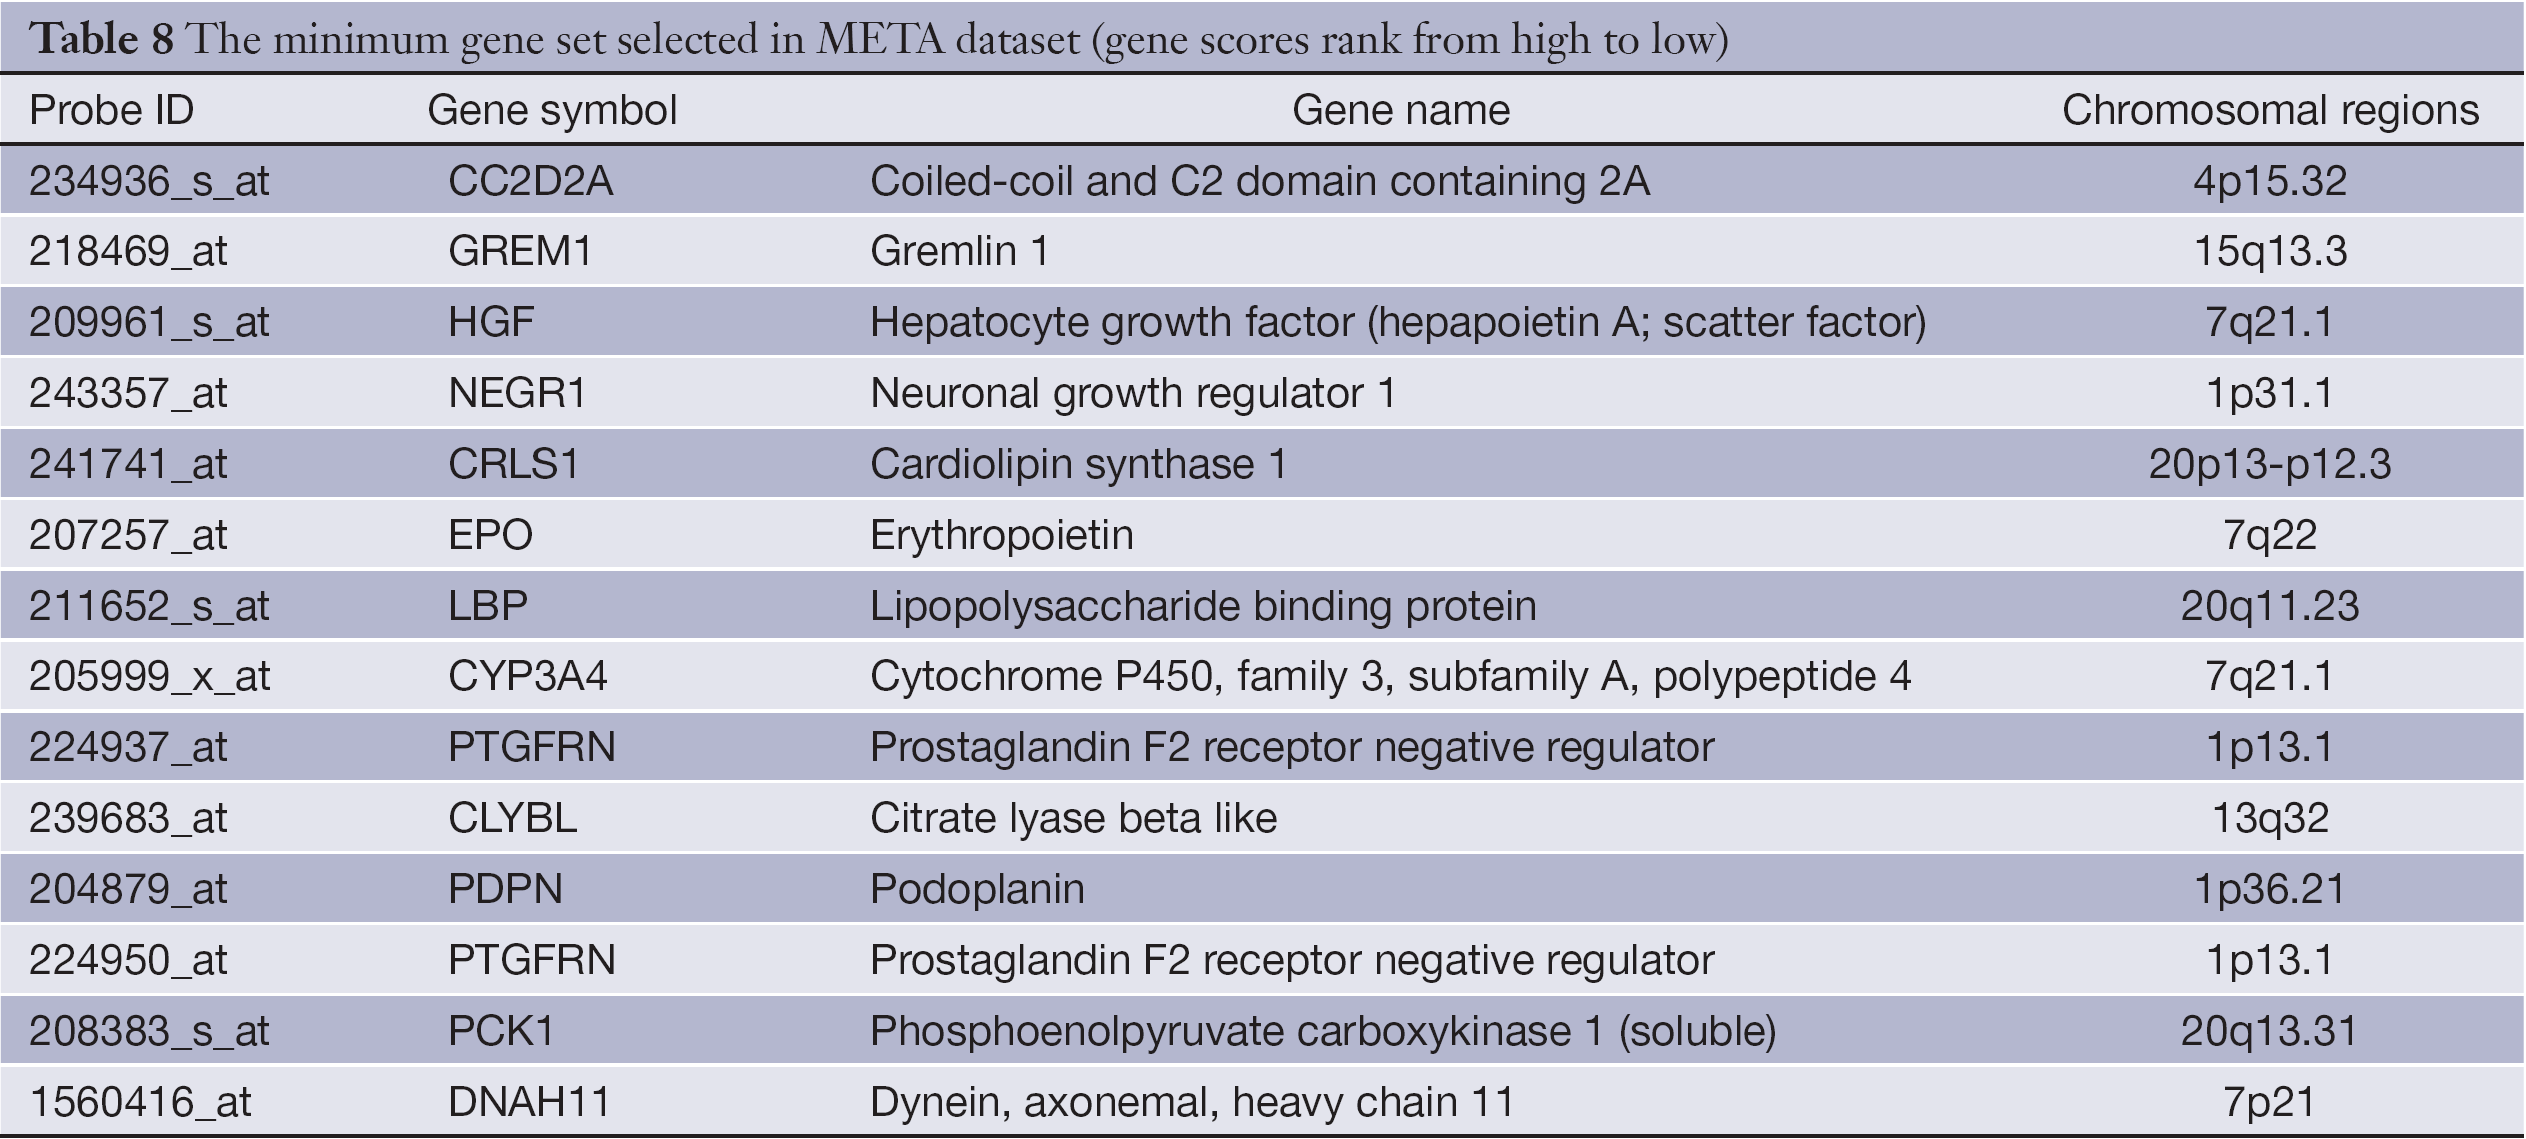
SVM-T-RFE gene selection algorithm was also carried out to select informative genes in META data set. The initial overlapping gene sets (META-GS-OL) contained 70 probes. When parameter θ was set to 0.36, a minimum gene set was obtained with the minimum number (14) of genes, and the highest classification accuracy (100%) (Figure 3).
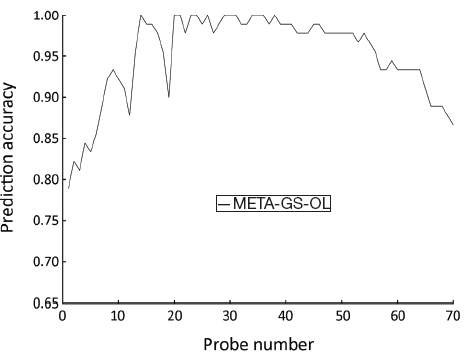
Table 8 gives the gene list of the minimum gene set in META data set. Evidence shows that hepatocyte growth factor (HGF) (24), and cytochrome P450, family 3, subfamily A, polypeptide 4 (CYP3A4) (25) are related to CRC or its metastasis.
Full table
Discussion
In recent years, due to the rapid development of molecular biology experimental techniques, a large amount of data has been accumulated, including genome, transcriptome and proteome detection platform. Previous studies often focus on data from a single platform, and rarely address the problem of integration of data from a variety of platforms. In this study, we present an integrated strategy, by combining microarray data with CGH information, in an attempt to indentify CRC metastasis-related genes.
In the minimum gene sets selected from PRI data set, at least two genes were found to have direct evidence of the associations with CRC. SFRP4, located in the region of 7p14.1, is a member of the secreted frizzled related proteins (sFRPs) family. The sFRPs are able to bind and inhibit Wnt signalling pathways. SFRP4 expression was reported to be up-regulated in CRC (21), and the up-regulation level was found to be 2.7 folds in PRI data set. RAB27B, whose chromosomal location is on 18q21.2, is a member of RAS oncogene family. RAB27B was reported to be associated with poor prognosis in human breast tumors, and crucial for the invasiveness and metastasis of breast cancer cell lines (22). Dong et al. (23) reported that RAB27B may serve as a valuable prognostic predictor for hepatocellular carcinoma patients, and they also found a close relationship between RAB27B expression and clinicopathological characteristics and prognosis in CRC.
At least two genes in the minimum gene sets of META data set were found to be associated with CRC. HGF, located in 7q21.1, regulates cell proliferation, migration, and morphogenesis by binding to the receptor of proto-oncogene c-met. Previous studies indicated that the HGF/Met pathway plays a role in the progression of CRC, and c-met gene overexpression contributes to the metastatic phenotype of CRC (24). CYP3A4, whose chromosomal location is also on 7q21.1, is a member of the cytochrome P450 superfamily, which catalyzes many reactions involved in drug metabolism as well as the synthesis of cholesterol, steroids and other lipids. CYP3A4 was reportedly the highest frequency of strong immunoreactivity of P450 in normal colon and there was significant correlation between its immunoreactivity and CRC stage (25).
Our results demonstrated that integrated analysis is an effective strategy for mining cancer-associated genes. There are corresponding oncogenes and tumor suppressor genes in chromosomal amplification and deletion regions. CRC metastasis, as the advanced stage of colorectal tumorigenesis, is a complicated, multi-step biological process. CRC metastasis has rarely been systematically addressed by previous studies, and the molecular mechanism remains far from being completely elucidated. Although many of the selected genes need to be validated in further molecular experiments, the preliminary results show that multiple oncogenes and tumor suppressor genes participate in the process of CRC metastasis. Moreover, the gene expression profiles of our study were downloaded from one single data set (GSE2109), and heterogeneous microarray data sets can be combined to discover metastasis-related genes in CRC in the future work (26). In addition, network-based approach can be used to integrate genomic, transcriptomic, and proteomic data, in an attempt to pinpoint significant genes and highlight the molecular mechanisms underlying CRC metastasis (27). In conclusion, in-depth study of these genes will lead to a better understanding of the molecular mechanisms of CRC metastasis and provide potential biomarkers and therapeutic targets for CRC metastasis.
Acknowledgements
This study was supported by a grant from the National Natural Science Foundation of China (Grant No. 61373057), and a grant from the Zhejiang Provincial Natural Science Foundation of China (Grant No. Y1110763).
Disclosure: The authors declare no conflict of interest.
References
- ACS. Global Cancer Facts and Figures 2007. Atlanta: American Cancer Society; 2007.
- ACS. Colorectal Cancer Facts and Figures 2008-2010. Atlanta: American Cancer Society; 2010.
- Boige V, Malka D, Elias D. Hepatic arterial infusion of oxaliplatin and intravenous LV5FU2 in unresectable liver metastases from colorectal cancer after systemic chemotherapy failure. Ann Surg Oncol 2008;15:219-26. [PubMed]
- Pollack JR, Sorlie T, Perou CM, et al. Microarray analysis reveals a major direct role of DNA copy number alteration in the transcriptional program of human breast tumors. Proc Natl Acad Sci U S A 2002;99:12963-8. [PubMed]
- Hyman E, Kauraniemi P, Hautaniemi S, et al. Impact of DNA amplification on gene expression patterns in breast cancer. Cancer Res 2002;62:6240-5. [PubMed]
- Tsafrir D, Bacolod M, Selvanayagam Z, et al. Relationship of gene expression and chromosomal abnormalities in colorectal cancer. Cancer Res 2006;66:2129-37. [PubMed]
- Kallioniemi A, Kallioniemi OP, Sudar D, et al. Comparative genomic hybridization for molecular cytogenetic analysis of solid tumors. Science 1992;258:818-21. [PubMed]
- Li X, Chen J, Lu BJ, et al. –8p12-23 and +20q Are Predictors of Subtypes and Metastatic Pathways in Colorectal Cancer: Construction of Tree Models Using Comparative Genomic Hybridization Data. OMICS 2011;15:37-47. [PubMed]
- Barrett T, Wilhite SE, Ledoux P, et al. NCBI GEO: archive for functional genomics data sets--update. Nucleic Acids Res 2013;41:D991-5. [PubMed]
- Natrajan R, Weigelt B, Mackay A, et al. An integrative genomic and transcriptomic analysis reveals molecular pathways and networks regulated by copy number aberrations in basal-like, HER2 and luminal cancers. Breast Cancer Res Treat 2010;121:575-89. [PubMed]
- Huang N, Shah PK, Li C. Lessons from a decade of integrating cancer copy number alterations with gene expression profiles. Brief Bioinform 2012;13:305-16. [PubMed]
- Curtis C, Shah SP, Chin SF, et al. The genomic and transcriptomic architecture of 2,000 breast tumours reveals novel subgroups. Nature 2012;486:346-52. [PubMed]
- Rakosy Z, Ecsedi S, Toth R, et al. Integrative genomics identifies gene signature associated with melanoma ulceration. PLoS One 2013;8:e54958. [PubMed]
- Li X, Peng S, Chen J, et al. SVM-T-RFE: A novel gene selection algorithm for identifying metastasis-related genes in colorectal cancer using gene expression profiles. Biochem Biophys Res Commun 2012;419:148-53. [PubMed]
- Bolstad BM, Irizarry RA, Astrand M, et al. A comparison of normalization methods for high density oligonucleotide array data based on variance and bias. Bioinformatics 2003;19:185-93. [PubMed]
- Li XB. Mathematical modeling of carcinogenesis based on chromosome aberration data. Chin J Cancer Res 2009;21:240-6.
- Tusher VG, Tibshirani R, Chu G. Significance analysis of microarrays applied to the ionizing radiation response. Proc Natl Acad Sci U S A 2001;98:5116-21. [PubMed]
- Dennis G Jr, Sherman BT, Hosack DA, et al. DAVID: Database for annotation, visualization, and integrated discovery. Genome Biol 2003;4:3. [PubMed]
- Huang W, Sherman BT, Lempicki RA. Systematic and integrative analysis of large gene lists using DAVID bioinformatics resources. Nat Protoc 2009;4:44-57. [PubMed]
- Chu G, Jun Li, Narasimhan B, et al. SAM Significance Analysis of Microarrays-Users guide and technical document. Available online: http://www-stat.stanford.edu/~tibs/SAM/sam.pdf
- Feng Han Q, Zhao W, Bentel J, et al. Expression of sFRP-4 and beta-catenin in human colorectal carcinoma. Cancer Lett 2006;231:129-37. [PubMed]
- Hendrix A, Maynard D, Pauwels P, et al. Effect of the secretory small GTPase Rab27B on breast cancer growth, invasion, and metastasis. J Natl Cancer Inst 2010;102:866-80. [PubMed]
- Dong WW, Mou Q, Chen J, et al. Differential expression of Rab27A/B correlates with clinical outcome in hepatocellular carcinoma. World J Gastroenterol 2012;18:1806-13. [PubMed]
- Di Renzo MF, Olivero M, Giacomini A, et al. Overexpression and amplification of the met/HGF receptor gene during the progression of colorectal cancer. Clin Cancer Res 1995;1:147-54. [PubMed]
- Kumarakulasingham M, Rooney PH, Dundas SR, et al. Cytochrome p450 profile of colorectal cancer: identification of markers of prognosis. Clin Cancer Res 2005;11:3758-65. [PubMed]
- Park PJ, Kong SW, Tebaldi T, et al. Integration of heterogeneous expression data sets extends the role of the retinol pathway in diabetes and insulin resistance. Bioinformatics 2009;25:3121-7. [PubMed]
- Shi M, Beauchamp RD, Zhang B. A network-based gene expression signature informs prognosis and treatment for colorectal cancer patients. PLoS One 2012;7:e41292. [PubMed]