
Nutritional assessment with different tools in leukemia patients after hematopoietic stem cell transplantation
Introduction
In recent years, hematopoietic stem cell transplantation (HSCT) is widely used in the treatment of hematologic malignancies and some solid tumors (1). Leukemia patients must receive pretreatment of high-dose chemotherapy and/or systemic irradiation before transplantation, which may cause digestive dysfunction and nutritional deficiencies. Nutritional status is an important factor in immune reconstitution and bone marrow reconstitution after HSCT (2,3). Therefore, assessing the nutritional status of HSCT patients correctly, developing nutritional support program in advance and keeping patients in good nutritional status, are all essential for successful post-transplantation immune reconstitution, reducing infection and other complications, and improving patients’ quality of life.
Nowadays, lots of nutritional assessment methods and indicators are being used both nationally and internationally, such as plasma albumin and prealbumin, serum creatinine and blood urea nitrogen, and anthropometric indexes. Although the indicators are epidemiologically related to patients’ morbidity and mortality, for single nutritional assessment method, the indicators have obvious limitations, such as poor specificity, weak detection efficiency and low predictive value (4). Commonly used clinical nutritional screening tools in publication order are: subjective globe assessment (SGA), mini nutritional assessment (MNA), malnutritional universal screening tools (MUST), and nutritional risk screening 2002 (NRS2002). This prospective study applied these tools above to assess the nutritional status of leukemia patients after HSCT, and figured out the differences among the nutritional screening tools.
Materials and methods
Subjects
From May 2011 to April 2012, 108 patients (77 males and 31 females) completing allogeneic HSCT were recruited from Hematology Department of Peking University People’s Hospital. The median age of the patients was 29 years old (range, 8-56 years old). There were 61 cases of acute lymphoblastic leukemia (ALL), 15 cases of acute myeloid leukemia (AML), 14 cases of chronic myeloid leukemia (CML), and 19 cases of myelodysplastic syndrome (MDS). The average duration of treatment in laminar flow clean wards was 30.0±4.9 d. The study was approved by the Ethics Committee of Peking University People’s Hospital, and written informed consent of all the patients was acquired.
Assessment methods
The fixed-point consecutive sampling was adopted in this study. After the patients completed HSCT and left the laminar flow clean wards, dietitians should apply the following four types of nutritional evaluation methods within 48 h to access the nutritional status of these patients.
NRS2002
NRS2002 was developed by the Danish Association of Parenteral and Enteral Nutrition (DAPEN), and was recommended by European Society for Parenteral and Enteral Nutrition (ESPEN) (5). This method built on the basis of evidence-based medicine, is simple and easy. The core components of this method include: (I) severity of the impact of primary disease on nutritional status; (II) recent changes of body weight (within the last 1 to 3 months); (III) changes in dietary intake within the last one week; (IV) body mass index (BMI); and (V) the nutritional risk score plus 1 if the age ≥70 years. NRS score ≥3 is defined as being at nutritional risk. Taking the differences in height and weight between Chinese and Western people into account, we used the Chinese Chen Chunming standard for BMI assessment (6). Adult malnutrition status was defined as nutritional deficiency if BMI <18.5 kg/m2, overweight if BMI ≥24.0 kg/m2, and obeseness if BMI ≥28.0 kg/m2. BMI is calculated as: BMI = weight (kg)/[height (m)]2.
MNA
MNA is a new method for assessing people’s nutritional status developed by Vellas et al. in the early 1990s (7,8). MNA questionnaire is composed of 18 questions in four parts: (I) anthropometric measurements: weight, height, arm circumference, calf circumference, weight loss and other issues; (II) comprehensive evaluation: six items such as type of life, medical situation, drug use and physical performance; (III) dietary questionnaire: six items including meal times, type of food, fluid intake, independent eating, and so on; and (IV) subjective evaluation: patients’ evaluation for their own health and nutritional status. The total score of the 18 questions is 30. Nutritional status can be classified into three types: well-nourished if MNA ≥24; being at risk of nutritional deficiency if 17≤ MNA ≤23.5; and undernutrition if MNA <17.
SGA
SGA is a clinical nutrition evaluation method founded by Canadian scholar in 1987, and is recommended by American Society for Parenteral and Enteral Nutrition. SGA is an assessment tool based on medical history and clinical examinations. It includes eight indicators including recent weight change, diet change, gastrointestinal symptoms, changes in activities, stress response, muscle wasting, triceps skinfold thickness, and the presence of edema. Each of the indicators is rated from A to C (9). When five or more of the eight indicators are C, the overall rating is C (severe undernutrition); when five or more are B, or the amount of C is less than 5, the overall rating is B (mild, moderate undernutrition); when the amount of B and C is less than 5, the overall rating is A (good nutrition). Judgments for mild, moderate and severe stress (corresponding to A, B and C grades) are as follows: if a patient is in very low mood, or even the tendency of depression or mental disorders after HSCT, C grade (severe stress response) is diagnosed; and if not, moderate stress response is noted.
MUST
MUST was developed in 2003 by the multidisciplinary Malnutrition Advisory Group (MAG) of the British Association for Parenteral and Enteral Nutrition. It is mainly used in protein-energy malnutrition (PEM) and its risk screening, and includes three aspects: BMI, weight loss, and reduced food intake caused by diseases (10,11). The total score results from ratings of three parts. The total score of 0 indicates no or low nutritional risk, and thus another screening is required later; 1 indicates moderate nutritional risk, and 3-day dietary should be recorded for further assessment; 2 indicates high nutritional risk, and nutritional guidance or treatment from nutrition professionals is necessary.
Nine of 108 patients are younger than 18 years old. Since they were unable to complete the NRS2002, MNA and MUST questionnaires containing the measurement of BMI, the nine patients only received SGA.
Quality control
All patients completed nutritional screening within 48 h after they left the laminar flow chamber after HSCT. All investigators were strictly trained before investigation; uniform nutritional assessment questionnaire was used for screening and assessment; height of patients was measured without shoes; weight was measured for patients with empty stomachs, with ward clothes and without shoes. Type RGZ-120-type body-weight balance (China Weighing Apparatus Factory, Jiangsu, China) was used for measuring body weight. Weight measurement was calibrated to ±0.2 kg, and height ruler was calibrated to ±0.5 cm. Skinfold thickness was measured with the National Sports Commission skinfold thickness measuring instrument, body circumferences were measured with soft tape ruler, and all data were accurate to 0.1 mm.
Statistical analysis
A database was created by using Epi-data software. Statistical analyses were performed with SPSS 17.0 (SPSS Inc., Chicago, IL, USA). Quantitative data were expressed as  , and qualitative data were expressed as percentage. Differences in qualitative data were measured by chi-square test or Fisher’s exact test (comparison of nutritional status in both genders and all age groups). P<0.05 was considered statistically significant.
Results
NRS2002 screening results
Enrolled patients out of laminar flow chamber were all at nutritional risk, among whom, 25 (25.3%) scored 3, 8 (8.1%) scored 4, 3 (3.0%) scored 5, and 63 (63.6%) scored 6. In the section of “severity of primary disease impact on nutritional status”, the scores of all entries are 3, and significant intake or weight reduction appeared in 63.6% of the patients.
MNA screening results
MNA evaluation results
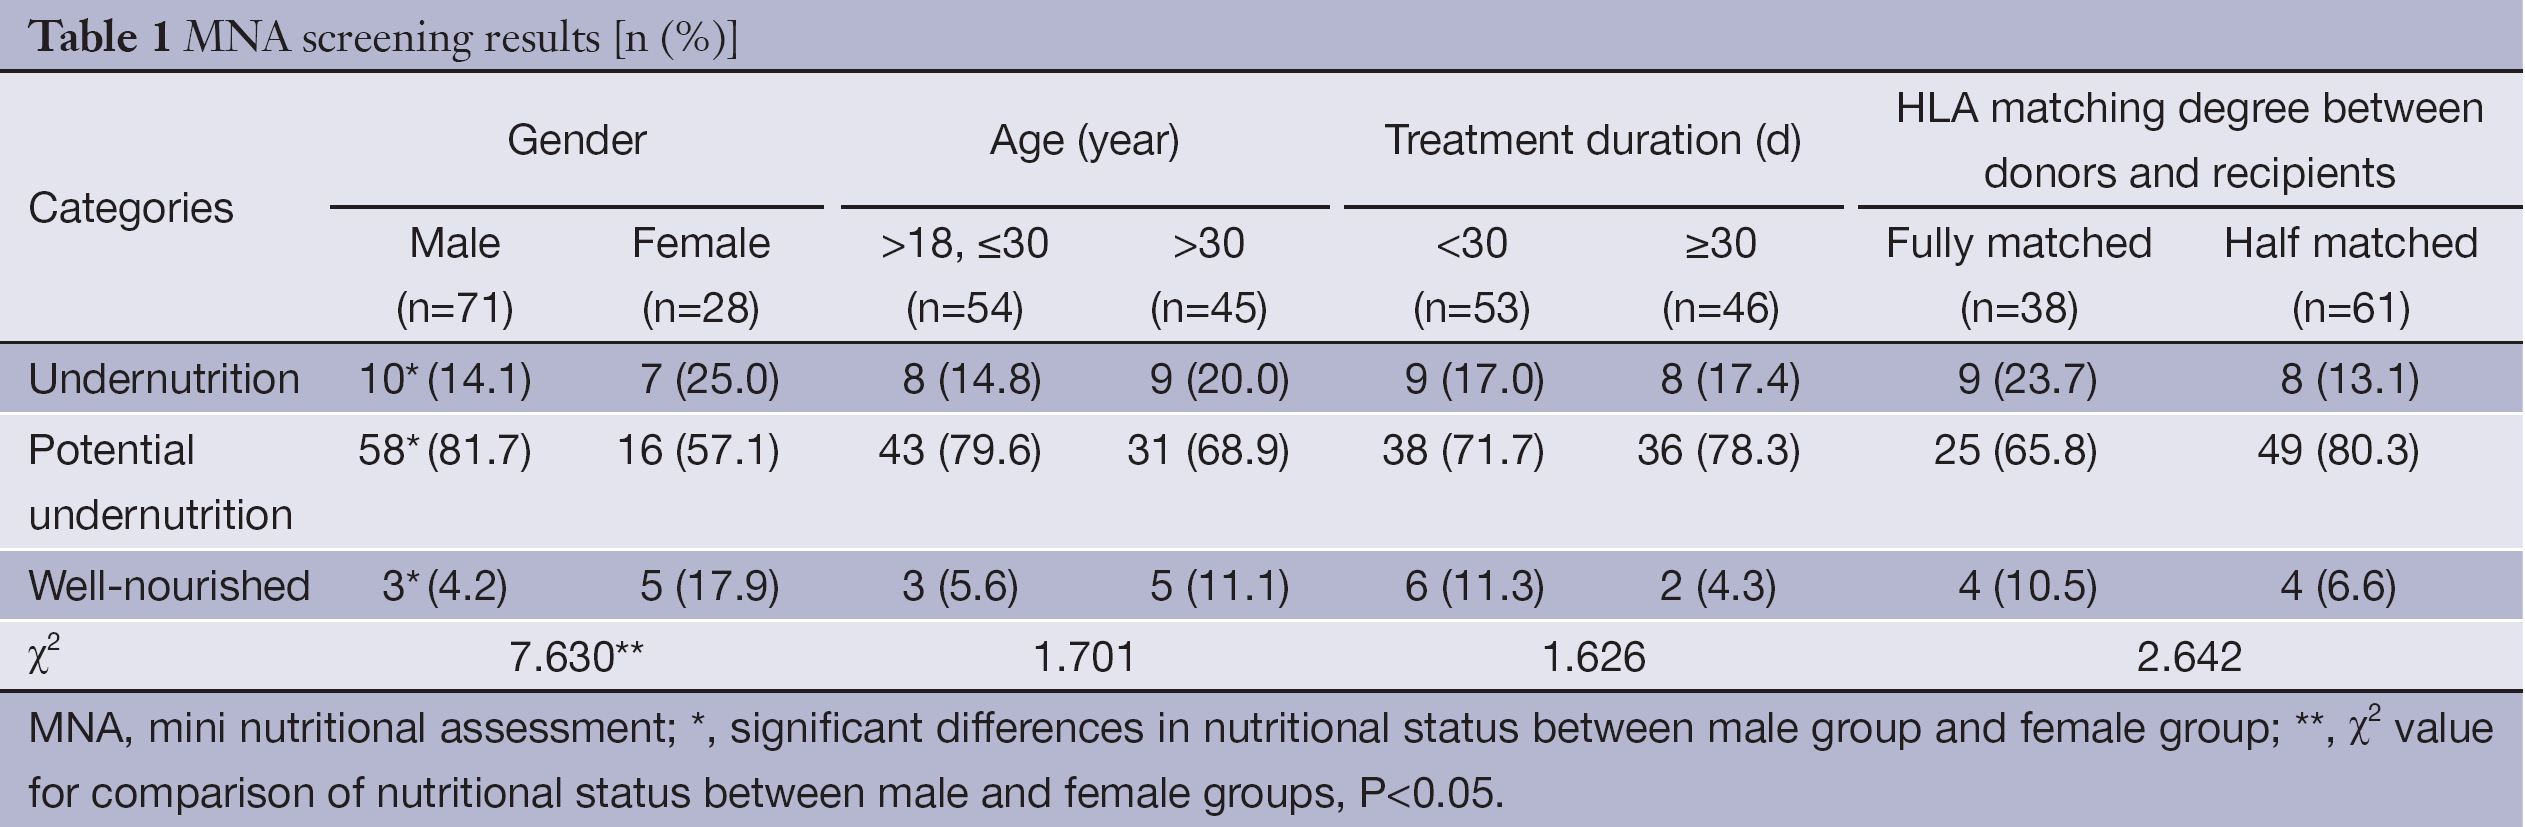
Among 99 leukemia patients, the MNA scores of 17 cases (17.2%) were lower than 17, who were determined as undernutrition; 74 cases (74.7%) were between 17 and 23.5, and determined as potential undernutrition; and the rest 8 cases (8.1%) were higher than 23.5, and determined as good nutrition state.
Comparison of MNA screening results between different groups
The candidates were categorized by gender, age, laminar flow chamber treatment duration, and consistency of stem cells between donors and recipients, and the differences in incidence of undernutrition among groups were analyzed. The results showed significant differences in nutritional status by genders (P<0.05), and in females, the incidence of undernutrition and the proportion of good nutrition state were both significantly higher than those in males (P<0.05). The incidence of potential undernutrtion in female patients was significantly lower than that in males (P<0.05). No significant differences were found in nutritional status according to age, laminar flow chamber treatment duration, and degree of consistency between donors and recipients (P>0.05). The details are showed in Table 1.
Full table
SGA screening results
SGA questionnaire results
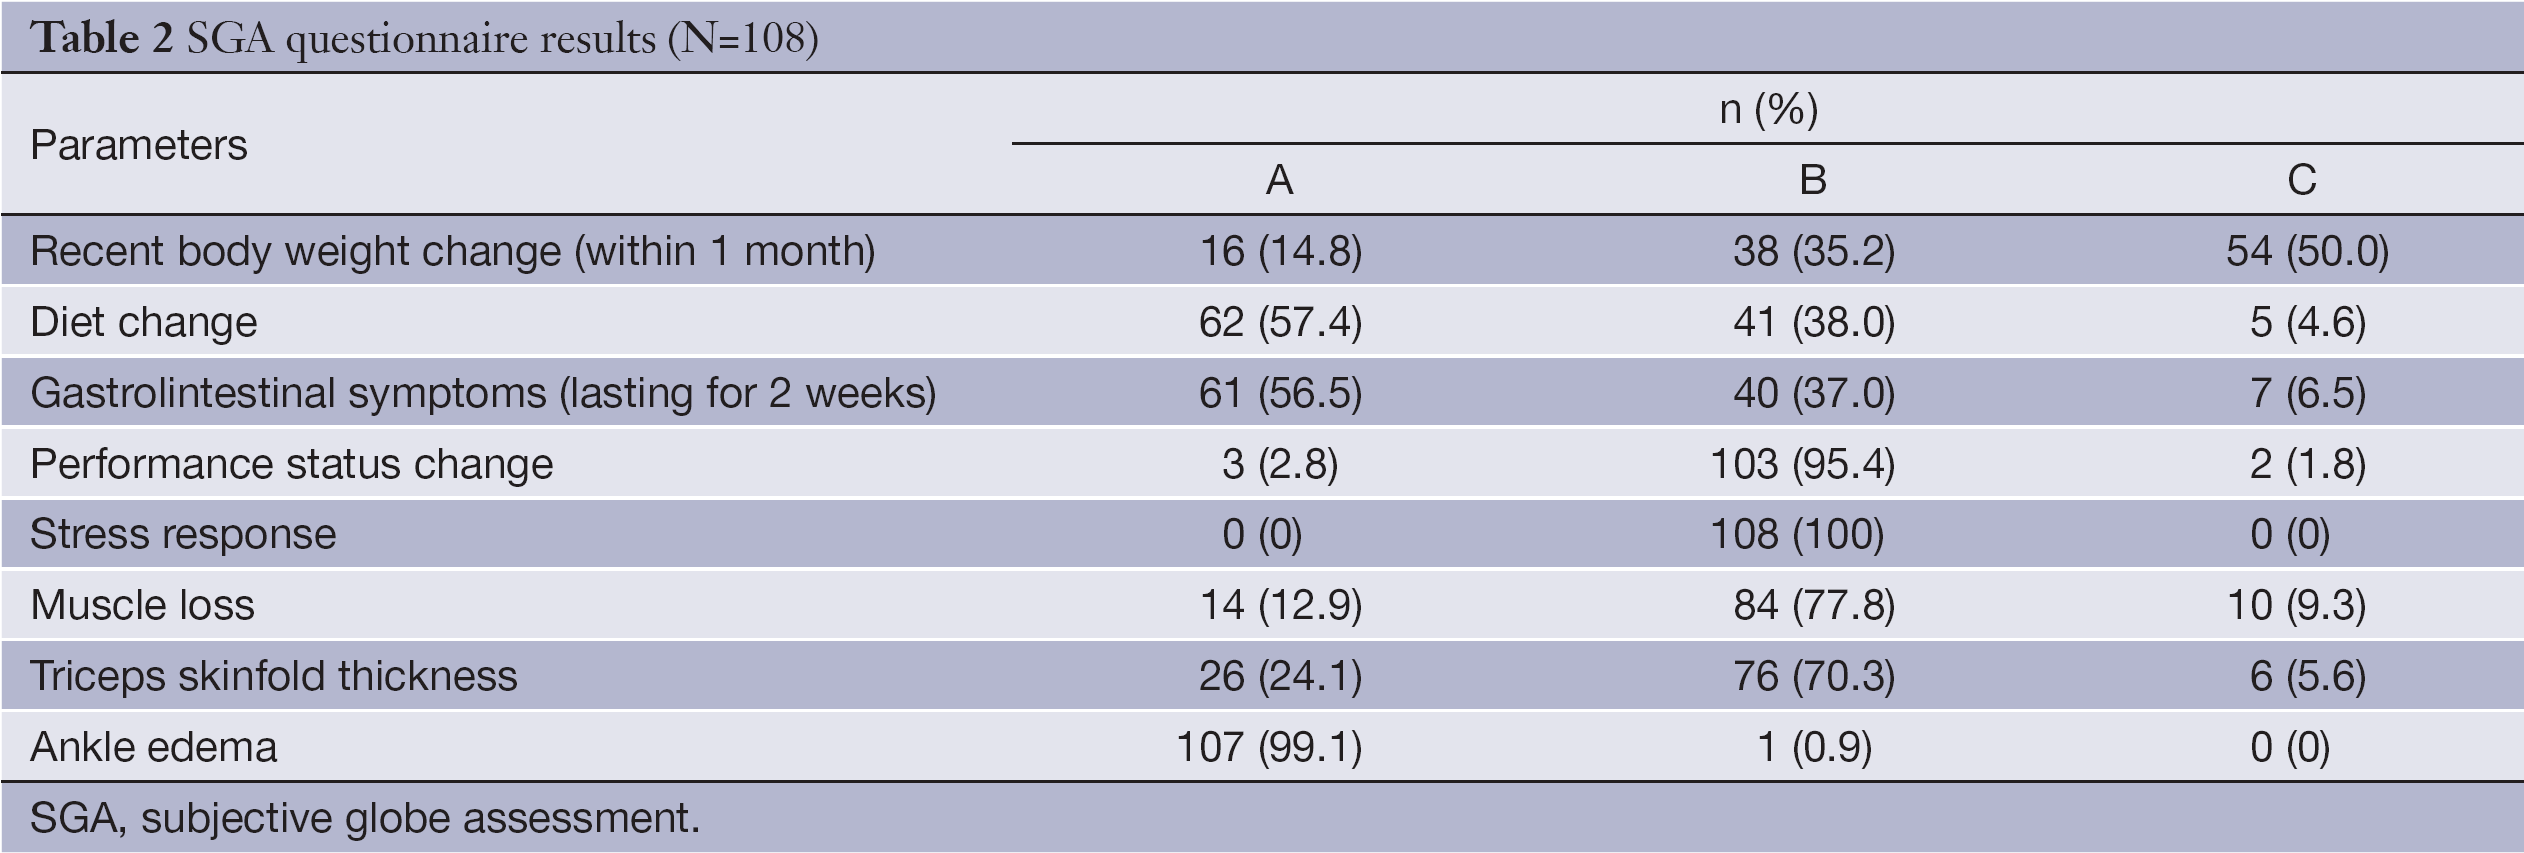
SGA screening was conducted among 108 enrolled patients. The results indicated: in laminar flow room, 85.2% of the patients lost weight during treatment, and 50% lost weight more than 5%; 42.6% reduced food intake, and only 5 (4.6%) patients had nothing or low-calorie liquid food. The severity of gastrointestinal symptoms was consistent with those from the dietary changes. In performance status, only three patients had no decline after leaving laminar flow chamber, 95.4% needed to stay in the general ward of Hematology Department for continuing treatment, and two patients were capable of only staying in bed due to severe complications. After HSCT, 87.1% of the patients presented muscle wasting, wherein, 9.3% were severe muscle wasting, which was in consistent with the measurement results of triceps skinfold thickness. Few ankle edemas were found in HSCT patients (0.9%) (Table 2).
Full table
Comparison of SGA evaluation results between different groups
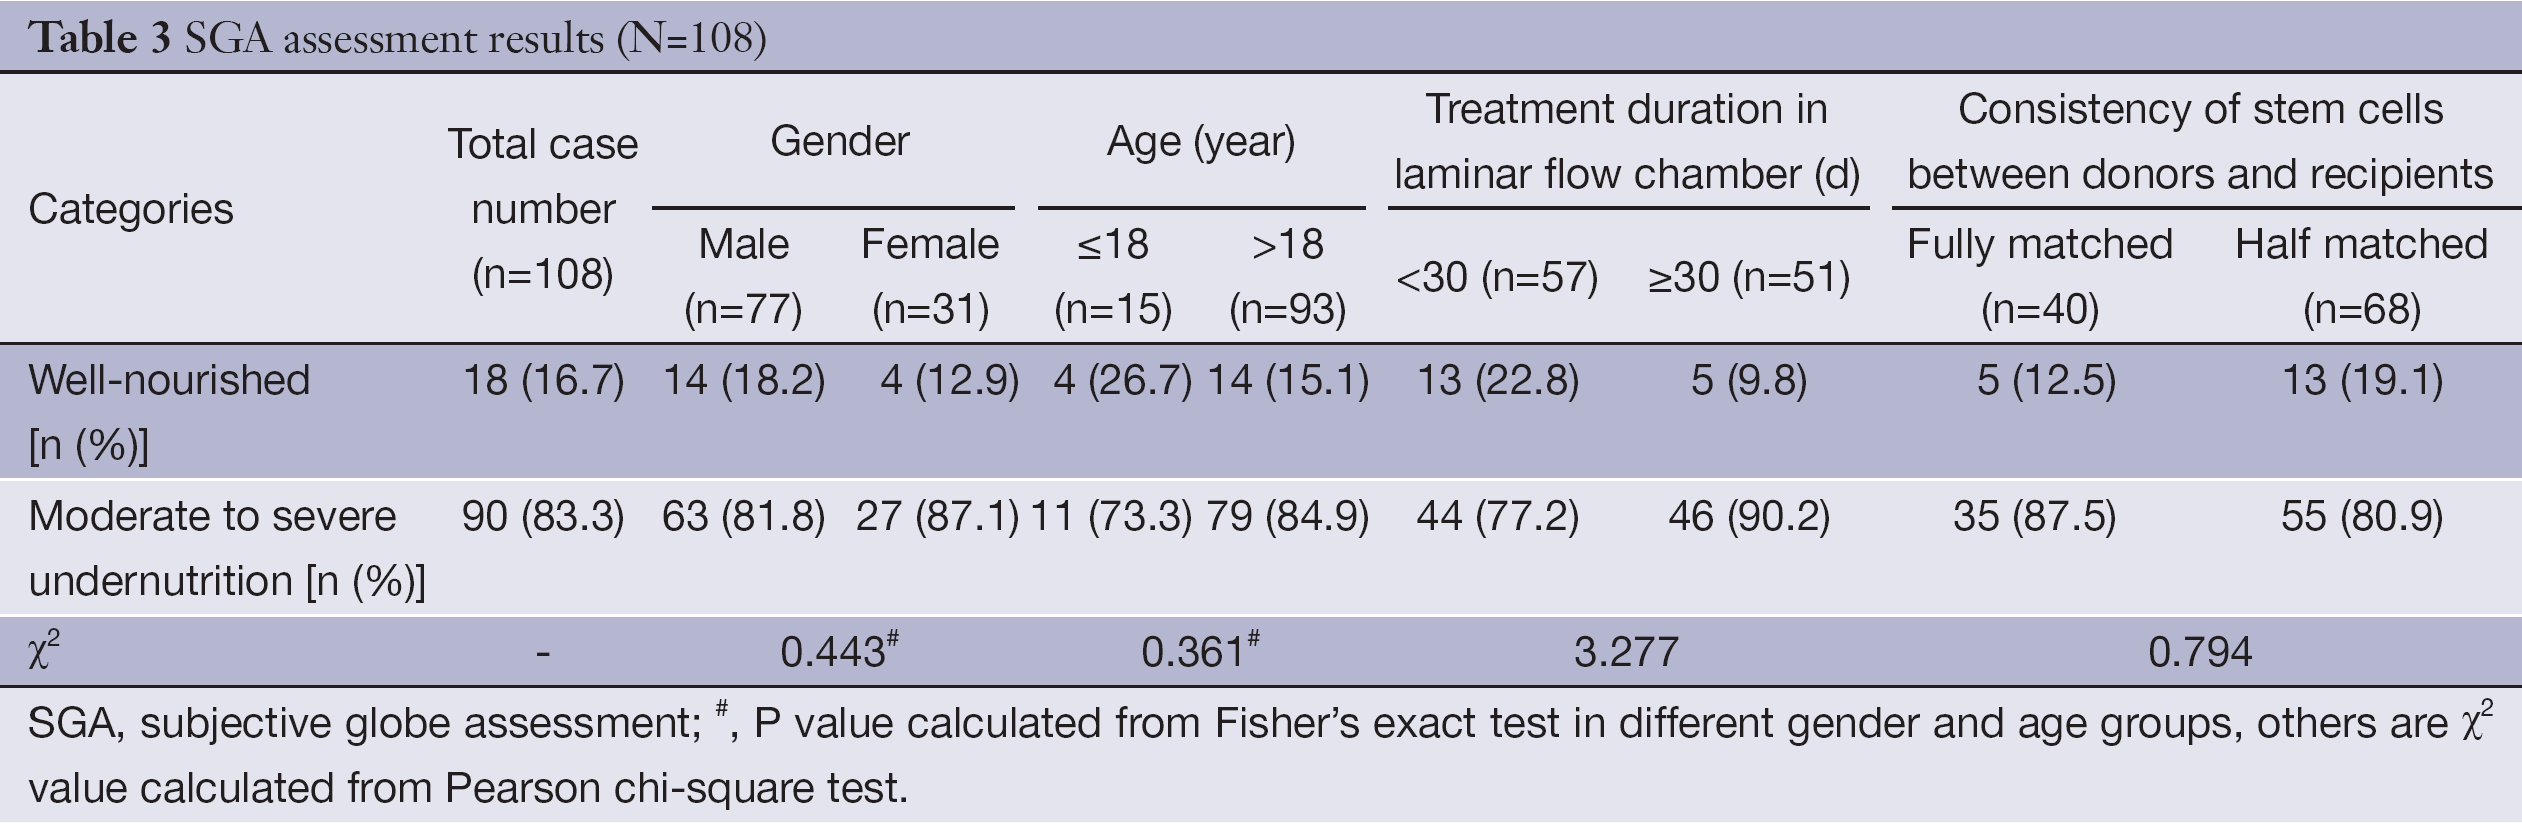
In the 108 candidates, 90 were diagnosed as moderate to severe undernutrition (83.3%), and the average treatment duration in laminar flow chamber was 30.0±4.9 d. Twenty-seven female patients were determined as moderate undernutrition (87.1%), and no patients were severe undernutrition. For males, 63 (81.8%) were diagnosed as moderate to severe undernutrition, and 1 was severe undernutrition. The average treatment duration in laminar flow chamber was 29 d for the undernutrition group and 30 d for the well-nourished group, and there was no significant difference between the two groups. When stratifying according to age, treatment time in laminar flow ward, and consistency of stem cells between donors and recipients, no significant differences were found in the incidence of undernutrition among different groups. The details are shown in Table 3.
Full table
MUST screening results
MUST questionnaire results
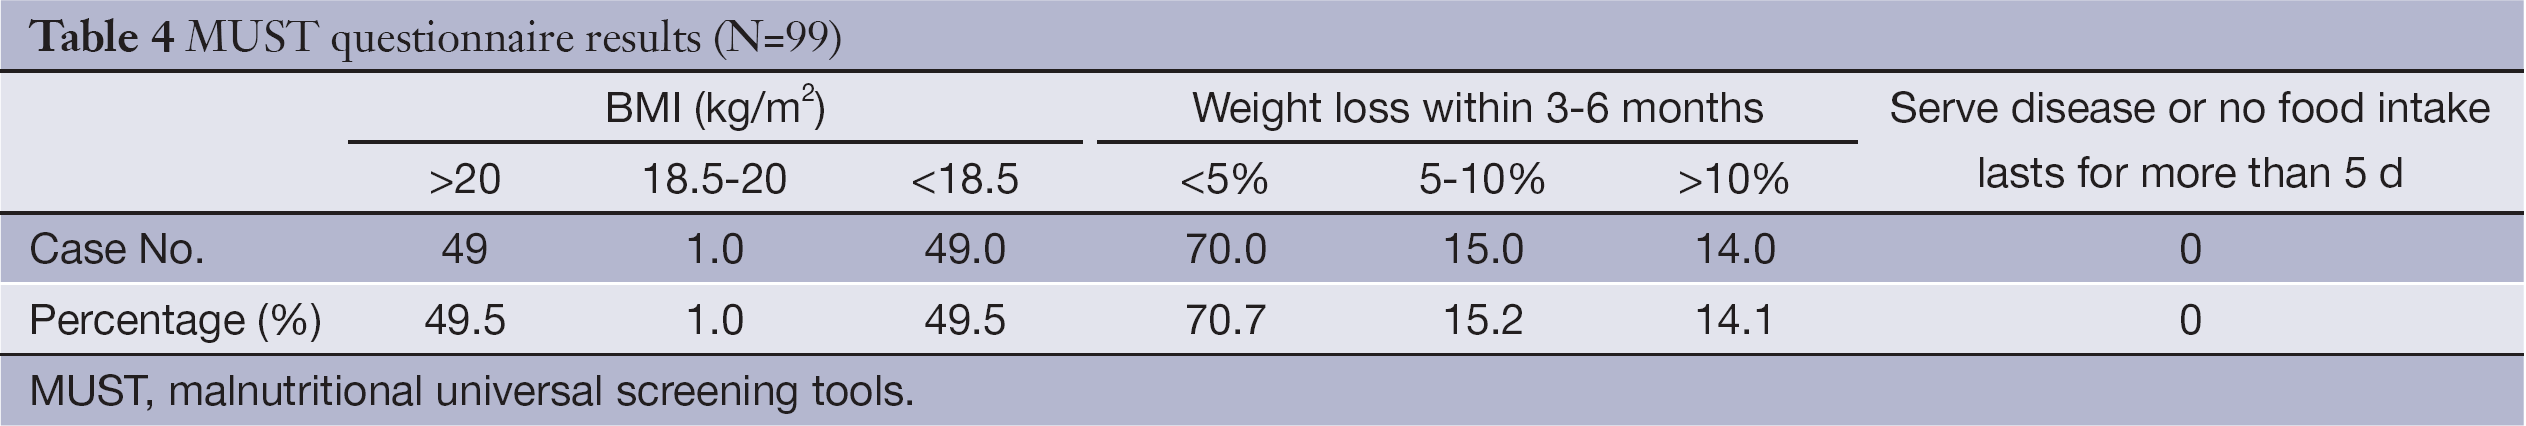
No severe complication or severe disease except leukemia occurred in the enrolled 99 patients. There was no patient fasting for more than 5 d. Fourteen (14.1%) patients in laminar flow chamber had weight loss greater than 10% (Table 4).
Full table
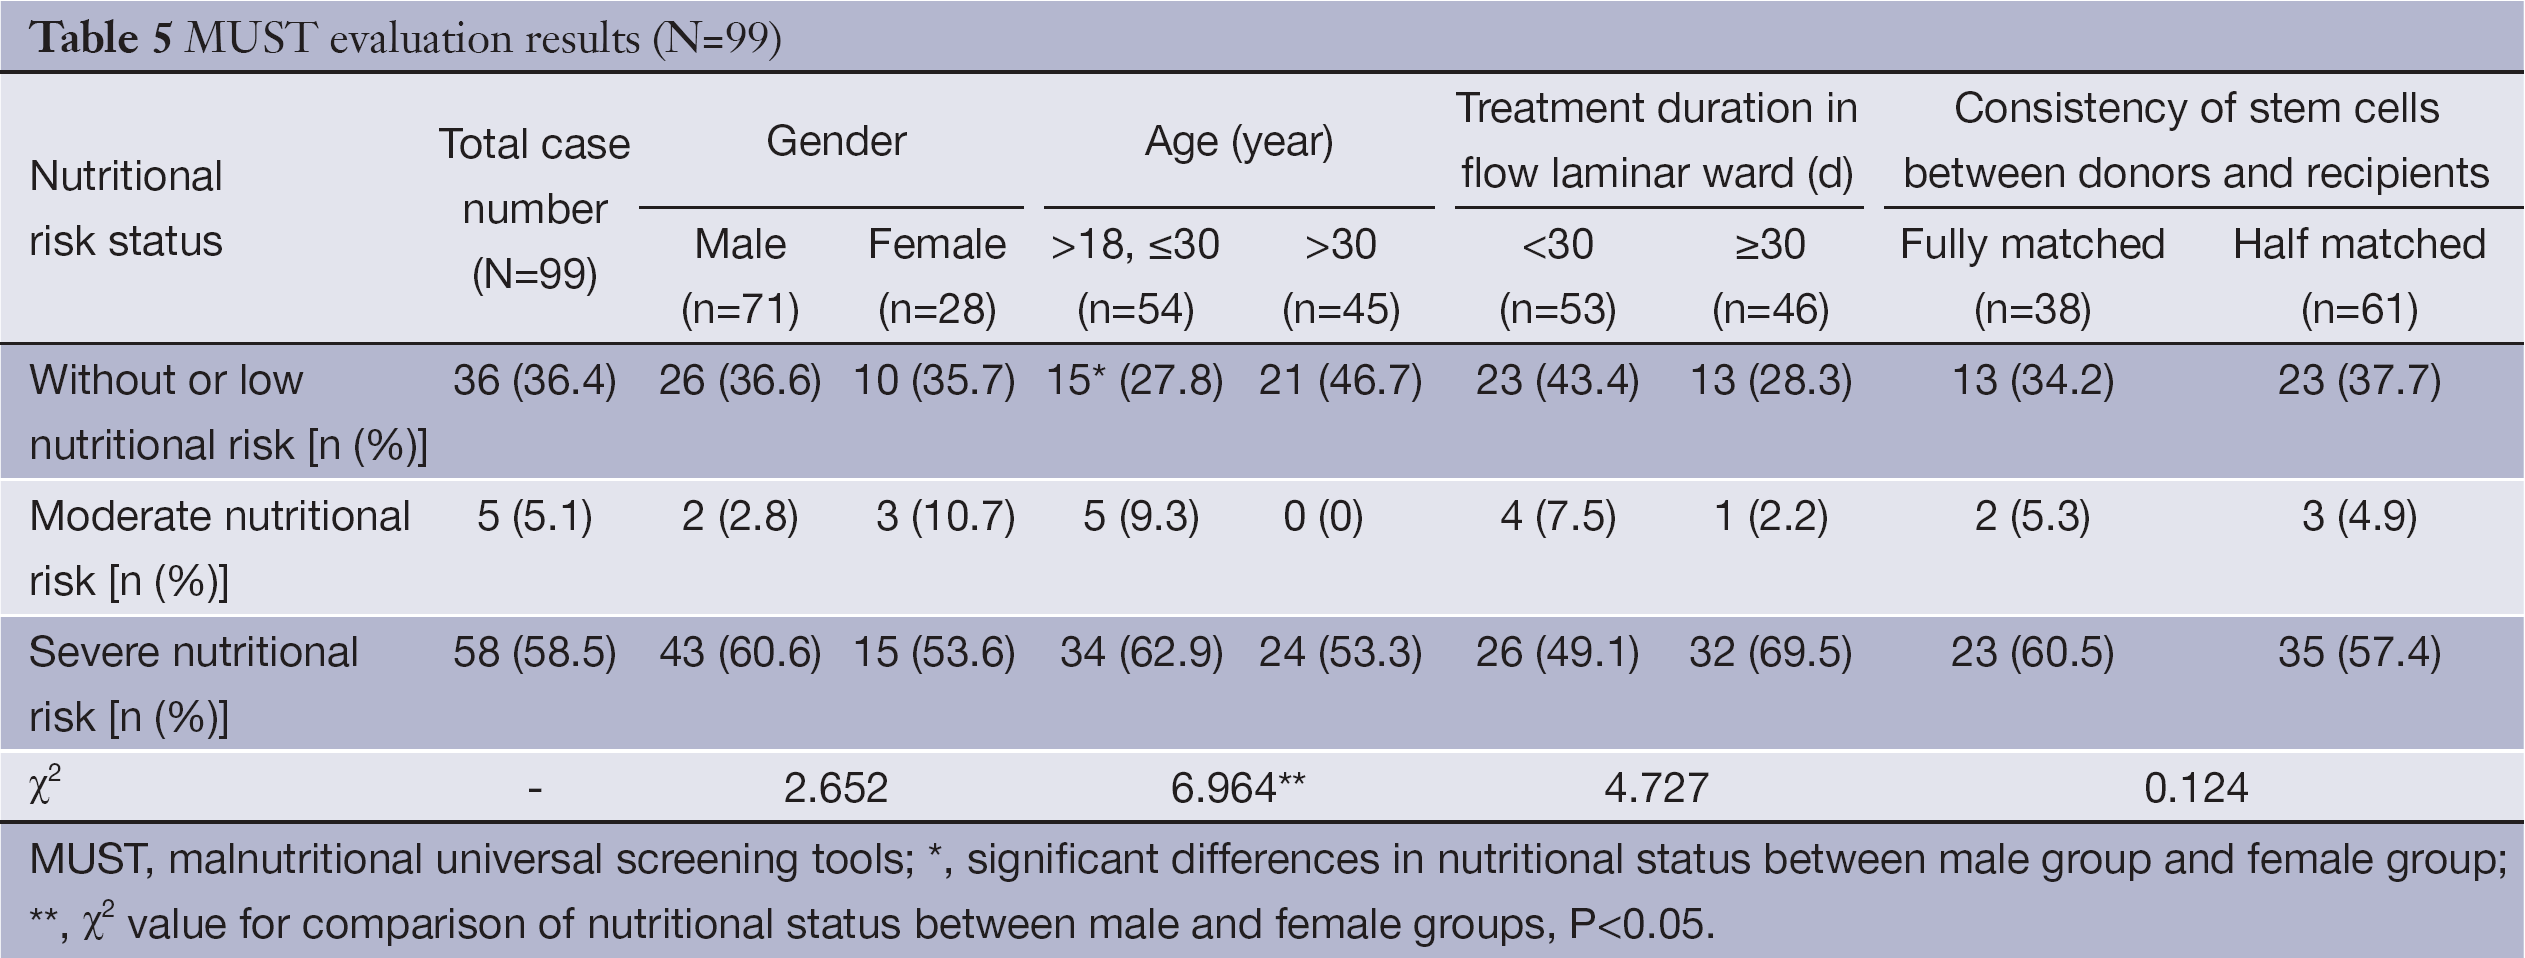
Comparison of MUST evaluation results between different groups
Among the enrolled 99 patients, 58 had high nutritional risk (58.5%). There was a significant difference in nutritional risk status between each two groups by age (P<0.05). After HSCT, the incidence of moderate to severe nutritional risk in leukemia patients aged 30 years and younger was 72.2%, which is significantly greater than that of patients older than 30 years (53.3%, P<0.05). The nutritional status of any two groups was not significantly different. The details are shown in Table 5.
Full table
Comparison of evaluation results of NRS2002, MNA, SGA and MUST
For the diagnosis of nutritional risk, the positive rate measured by NRS2002 (100%) was significantly different from those measured by MNA (74.7%) and MUST (63.6%) (P<0.05). For the diagnosis of undernutrition, the positive rate measured by SGA (83.3%) was significantly greater than that measured by MNA (17.2%) (P<0.05).
In the eight patients diagnosed as well-nourished by MNA, six were diagnosed as moderate to severe undernutrition by SGA, and the other two were measured as well-nourished by SGA. In the 74 patients measured as potential undernutrition by MNA, 15 were determined as well-nourished by SGA, and the other 59 were diagnosed as moderate to severe undernutrition by SGA.
Discussion
Importance of nutritional assessment in leukemia patients during and after HSCT
Due to the speciality of the treatment, leukemia patients are prone to appetite loss, absorption decrease, utilization barrier, and consumption increase. Undernutrition is one of the reasons for complications during and after transplantation process, which affects hematopoietic reconstitution, immune reconstitution, and transplantation efficacy (2,12). Therefore, assessing nutritional status of leukemia patients after transplantation correctly to develop nutritional support programs in advance and ensure good nutritional status of patients, is essential for successful completion of immune reconstitution, reduced complications, and improved quality of life. In this study, the results of four screening methods (NRS2002, MNA, SGA, and MUST) showed that, in 108 leukemia patients after transplantation, the incidence rates of nutritional risk or moderate to severe undernutrition were 100%, 91.9%, 83.3%, and 63.6%, respectively, indicating that nutritional problems exist in the majority of leukemia patients after transplantation, of which, 85.2% had weight loss during the treatment of transplantation, including 50% with weight loss >5% and 42.6% with significantly reduced food intake. At the same time, Liu et al. (13,14) evaluated nutritional risk in leukemia patients before HSCT with NRS2002 and MNA, and found that the incidence rates of nutritional risk and undernutrition were 14.0% and 2.0%, respectively. Thus, we suggested that dietitians should correctly evaluate the nutritional status of leukemia patients during and after the transplantation so as to detect nutritional risk or undernutrition timely, and develop appropriate nutritional support program in order to keep patients in good nutritional status during transplantation and complete the entire bone marrow reconstitution and immune reconstitution successfully.
Specificity of NRS2002 is not high, but it can be used in evaluation of nutritional deficiency
In our study, all patients after transplantation were at nutritional risk. The incidence rate was significantly higher than that of Cui’s study (15) on nutritional screening results of 3-A hospital inpatients in Beijing. It is also significantly higher than the incidence rate of the leukemia patients before HSCT (14.0%) (14). It is mainly due to the characteristics of leukemia and its treatment method. When using NRS2002, these patients were diagnosed as “marrow transplantation”, and the disease-related score was 3, therefore, the total scores of the patients were greater than or equal to 3. Meanwhile, significant intake or weight reduction appeared in 63.6% of the patients. Thus, as a nutritional risk screening tool, the specificity of NRS2002 is not high, but it can be used in the evaluation of nutritional deficiency.
MNA is applicable to nutritional risk screening in leukemia patients after HSCT, but not suitable for assessment of nutritional deficiency
MNA is the first method for evaluating the nutritional status of elderly population. MNA is simple and can be completed within ten min, and as both a screening tool and an assessment tool, it can be applied without further invasive procedures. With the research progress, MNA has also been used in cancer patients (16,17). In this study, MNA results showed that, among the 99 cases of leukemia patients after HSCT, 17.2% were diagnosed as undernutrition, which was significantly lower than that reported in related literature (18,19), and also lower than the incidence rate of undernutrition measured by other assessment methods in this study. The incidence of potential undernutrition measured by MNA was 74.7%. Therefore, for evaluating the nutritional status of leukemia patients after HSCT, the sensitivity of MNA was too low. MNA was only applicable for measuring whether these patients were potential undernurition. At the same time, it was found that the incidence of potential undernutrition in male patients was significantly higher than that in female patients. Thus, medical staff should pay more attention to patients after HSCT, and other screening methods should also be used.
For patients after HSCT, combination of different screening tools should be applied
Nutritional screening for patients and nutritional support for patients at nutritional risk are highly recommended in Parenteral and Enteral Nutrition Clinical Practice Guidelines (2006 edition) (20). So far, many assessment methods and indicators for nutritional status have been reported, but no one is regarded as the “gold standard”. This study used four common nutritional assessment methods, NRS2002, MNA, SGA, and MUST, to assess the nutritional status of 108 leukemia patients after HSCT. For the diagnosis of nutritional risk, the positive rate of NRS2002 was significantly different from MNA and MUST, and no significant difference was found between screening results of MNA and MUST. For the diagnosis of undernutrition, the positive rate with SGA was significantly higher than that with MNA. At the same time, it was found that among 8 well-nourished patients diagnosed by MNA, 6 were diagnosed as moderate to severe undernutrition by SGA; among 74 patients diagnosed as potential undernutrition by MNA, 15 were diagnosed as well-nourished and 59 were moderate to severe undernutrition by SGA. It is mainly due to the assessment aspects of MNA and SGA is not exactly the same. Thus, the combination of different assessment tools and other clinical indicators, such as plasma albumin, hemoglobin, immunological indicators, infection and postoperative complications, is necessary to improve the accuracy of nutritional status assessment.
Suggestion
The nutritional status of leukemia patients is poor during and after HSCT. NRS2002 is not suitable for nutritional screening in leukemia patients after HSCT; MNA is applicable for nutritional risk screening, but not good for the assessment of nutritional deficiency; the combination of different screening tools and clinical laboratory indicators is necessary for accurate and comprehensive nutritional status assessment. Meanwhile, the patients younger than 30 years of age and female patients after HSCT should be noticed. On the basis of screening results, timely intervention in patients undernourished or at nutritional risk is suggested to improve patients’ nutritional status during HSCT, which is essential for patients to complete the whole transplantation process.
Acknowledgements
Disclosure: The authors declare no conflict of interest.
References
- Huang XJ. Hematopoietic stem cell transplantation in China: current status and prospects. Am J Blood Res 2011;1:90-7. [PubMed]
- Martin-Salces M, de Paz R, Canales MA, et al. Nutritional recommendations in hematopoietic stem cell transplantation. Nutrition 2008;24:769-75. [PubMed]
- Skop A, Kolarzyk E, Skotnicki AB. Improtance of parenteral nutrition in patients undergoing hemopoietic stem cell transplantation procedures in the autologous system. JPEN J Parenter Enteral Nutr 2005;29:241-7. [PubMed]
- White M, Murphy AJ, Hastings Y, et al. Nutritional status and energy expenditure in children pre-bone-marrow-transplant. Bone Marrow Transplant 2005;35:775-9. [PubMed]
- Kondrup J, Allison SP, Elia M, et al. ESPEN guidelines for nutrition screening 2002. Clin Nutr 2003;22:415-21. [PubMed]
- Cooperative Meta-Analysis Group of the Working Group on Obesity in China, International Life Sciences Institute, Focal Point in China. The recommendation of Chinese adult body mass index classification. Zhonghua Yu Fang Yi Xue Za Zhi (in Chinese) 2001;35:349-50.
- Vellas B, Guigoz Y, Garry PJ, et al. The Mini Nutritional Assessment (MNA) and its use in grading the nutritional state of elderly patients. Nutrition 1999;15:116-22. [PubMed]
- Rullier L, Lagarde A, Bouisson J, et al. Nutritional status of community-dwelling older people with dementia: associations with individual and family caregivers’ characteristics. Int J Geriatr Psychiatry 2013;28:580-8. [PubMed]
- Hanisah R, Suzana S, Lee FS. Validation of screening tools to assess appetite among geriatric patients. J Nutr Health Aging 2012;16:660-5. [PubMed]
- Isenring EA, Banks M, Ferguson M, et al. Beyond malnutrition screening: appropriate methods to guide nutrition care for aged care residents. J Acad Nutr Diet 2012;112:376-81. [PubMed]
- Stratton RJ, Hackston A, Longmore D, et al. Malnutrition in hospital outpatients and inpatients: prevalence, concurrent validity and ease of use of the ‘malnutrition universal screening tool’ (‘MUST’) for adults. Br J Nutr 2004;92:799-808. [PubMed]
- Zatarain L, Savani BN. The role of nutrition and effects on the cytokine milieu in allogeneic hematopoietic stem cell transplantation. Cell Immunol 2012;276:6-9. [PubMed]
- Liu P, Yan X, Wang BS, et al. Three methods assess nutritional status of leukemia patients before hematopoietic stem cell transplantation. Chin Med J (Engl) 2012;125:440-3. [PubMed]
- Liu P, Zhang ZF, Cai JJ, et al. NRS2002 assesses nutritional status of leukemia patients undergoing hematopoietic stem cell transplantation. Chin J Cancer Res 2012;24:299-303. [PubMed]
- Cui LY, Zhang ST, Yu K, et al. Prevalence of nutritional risk, malnutrition (undernutrition), overweight/obesity and nutritional support in major hospitals in Beijing. Zhongguo Lin Chuang Ying Yang Za Zhi 2008;16:341-5.
- Gioulbasanis I, Georgoulias P, Vlachostergios PJ, et al. Mini Nutritional Assessment (MNA) and biochemical markers of cachexia in metastatic lung cancer patients: interrelations and associations with prognosis. Lung Cancer 2011;74:516-20. [PubMed]
- Tsai AC, Hsu WC, Chan SC, et al. Usefulness of the mini nutritional assessment in predicting the nutritional status of patients with liver cancer in Taiwan. Nutr Cancer 2011;63:334-41. [PubMed]
- Cuyac Lantigua M, Santana Porbén S. The Mini Nutritional Assessment of the elderly in the practice of a hospital geriatrics service: inception, validation and operational characteristics. Arch Latinoam Nutr 2007;57:255-65. [PubMed]
- Gioulbasanis I, Baracos VE, Giannousi Z, et al. Baseline nutritional evaluation in metastatic lung cancer patients: Mini Nutritional Assessment versus weight loss history. Ann Oncol 2011;22:835-41. [PubMed]
- The Chinese medical association. Clinical diagnosis and treatment guidelines. Enteral and parenteral nutrition fascicle. Beijing: People’s Medical Publishing House, 2007:15-9.