
Role of the texture features of images in the diagnosis of solitary pulmonary nodules in different sizes
Introduction
Diagnosis of solitary pulmonary nodules (SPNs) in clinical radiology is mainly based on radiographic sign analyses of lesions, such as the position, size, number, morphology, margin, density and changes of adjacent structures. Since it was up to the clinical experience of radiologists, there is a subjective factor involved in this process. Moreover, different diseases might share same radiological findings, and different radiological presentation might also be observed in different stages or types for a single disorder. Therefore, radiologists might make totally different diagnoses based on the same radiological changes.
If radiological findings could be segmented by a computer aided approach to extract regions of interest and to provide quantitative graphic variables in relevance to diagnosis, appropriate graphic features could be selected for the diagnosis of specific lesions, resulting in minimization of inter-radiologist variations and delivery of objective and quantitative radiological data. Utility of computer-aided approaches contributes to improved confidence of radiological diagnosis (1-4).
In this study, the role of textural features in the differentiation of SPNs has been investigated. Segmentation and extraction of SPNs, as well as their spatial structures and grey-scale, were quantitatively described, in expectation to find appropriate statistical variables to improve the diagnostic specificity of SPNs.
Materials and methods
General data and CT scans
Totally 379 cases of SPNs, including 120 benign lesions and 259 malignant lesions were collected and confirmed by clinical pathology or biopsy. There were 38 cases of SPNs sized ≤10 mm (20 benign lesions and 18 malignant lesions), 178 cases of SPNs sized 11-20 mm (51 benign lesions and 127 malignant lesions) and 163 cases of SPNs sized >20 mm (49 benign lesions and 114 malignant lesions). There were 211 men and 168 women aged 21 to 87 years (median: 53 years). CT scanning conditions: helical scan; slice thickness of 2-5 mm, the interlamination of 2-5 mm, scanning from pulmonary apex to the basis.
Image analysis
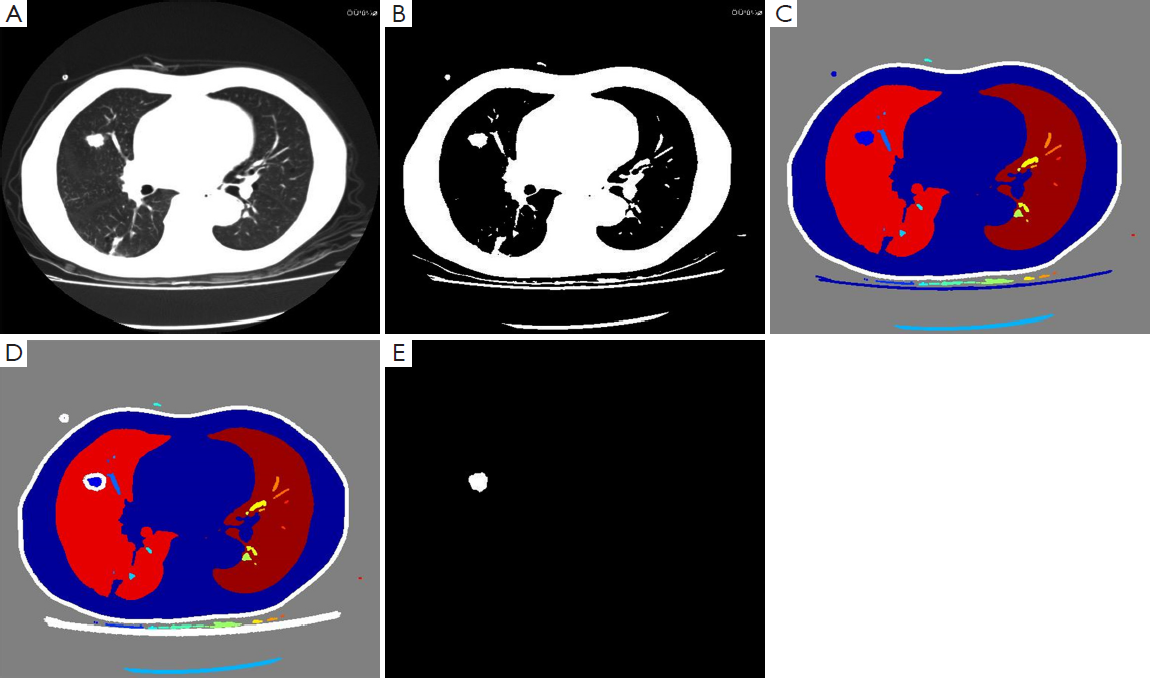
The maximal slice was selected and segmented by using the strategy of 2D Otsu threshold method (5) upon these 379 SPNs. In combination with morphological approaches, open and close calculations were implemented for binary images to eliminate the influence of micro-vessels. Objects were isolated from the narrow parts of target area with the edge smoothing, but the target area and morphology remained unchanged. Profiling tracking was conducted for binary images, and the maximal gradient point was selected as the starting point of boundary tracking from the gradient map, with the maximal gradient boundary determined by eight neighborhood searching methods.
With natural contrast and high difference in grayscale between SPNs and normal lung tissues, self-adaptive threshold segmentation method was employed to locate SPNs and to achieve segmentation automatically. After segmentation, the edge of SPNs was highly consistent with that of SPNs in original images (Figure 1).
Extraction of texture features
Texture features of segmented SPNs were analyzed by the method of grey level co-occurrence matrix (GLCM). The variables of texture features include contrast, homogeneity, correlation, energy and entropy (6). GLCM can be used to analyze the spatial distribution of image texture features through different spatial position and angle (7,8), with 0°, 45°, 90° and 135° as the angles generally used. The average values of texture features from four directions were used in this study, so that the texture features might not be influenced by the angle of rotation.
- Energy, the square sum of each matrix element, reflects the grayscale distribution homogeneity of images and texture crudeness. Same values of all co-occurrence matrix resulted in small energy profiles; on the contrary, high energy might be expected in case of unequal values among co-occurrence matrix values.
^{2}") |
[1] |
- Contrast reflects the sharpness of images and the depth of texture grooves. Deeper texture grooves were associated with high contrast and better visual sharpness; on the contrary, low contrast led to shallow grooves and blurred images. Higher number of pixels with high difference in grayscale (e.g., contrast profile) is associated with higher values of contrast.
^{2}p_{d,\theta }\left ( i.j \right )") |
[2] |
- Entropy reflects the non-uniformity and complexity of image texture.
\mathrm{log}\left ( p_{d,\theta }\left ( i.j \right ) \right )") |
[3] |
- Correlation reflects the consistency of image texture.
\left ( j-\mu _{y} \right )p_{d,\theta }\left ( i.j \right )}{\sigma _{x}\sigma _{y}}") |
[4] |
in which  ,
,  ,
,  , and
, and  were described as follows:
 "\mu _{x}=\sum_{i=1}^{N_{g}}\sum_{j=1}^{N_{g}}ip\left ( i,j \right )") |
[5] |
 "\mu _{y}=\sum_{i=1}^{N_{g}}\sum_{j=1}^{N_{g}}jp\left ( i,j \right )") |
[6] |
^{2}p\left ( i,j \right )}") |
[7] |
^{2}p\left ( i,j \right )}") |
[8] |
if, 
\left ( j-\mu _{y} \right )p_{d,\theta }\left ( i,j \right )}{\sigma ^{2}}") |
[9] |
- Homogeneity reflects the homogeneity of image textures and scaled the local changes of image texture. High values of homogeneity denote the absence of intra-regional changes and locally homogenous distribution in image textures.
}{1+\left | i-j \right |}") |
[10] |
Statistical analysis
SPSS 17.0 software is employed in the statistical analyses of this study. Inter-group comparison of texture variables between benign and malignant SPNs were analyzed by t-test. Differential analyses were performed upon SPNs of different sizes based on texture features, and a discrimination function was established to calculate the discrimination efficiency.
Results
Comparison of texture features between benign and malignant SPNs
The texture features of 379 SPNs were extracted successfully. The entropy, contrast and correlation of malignant SPNs were higher than those of benign SPNs. However, the energy, homogeneity and correlation were higher in benign SPNs than in malignant SPNs. Therefore, there were statistically significant differences in the variables of texture features (Table 1). Thus, the heterogeneity or complexity of malignant SPNs was higher than those of benign SPNs, while more homogenous and uniform appearances were observed for benign SPNs.
Full table
Texture feature-aided diagnosis of SPNs in different sizes
Qualitative diagnosis of SPNs remained to be highlights and challenges of medical imaging, especially in the diagnosis of patients with small SPNs. In this study, the texture features of radiological images were quantitatively analyzed. SPNs were classified according to the specified sizes and were utilized to determine the nature of SPNs, with different models of standardized linear discrimination function given.
Group of SPNs ≤10 mm
The standardized linear discrimination function and discrimination outcomes were provided for SPNs ≤10 mm, as shown Table 2.
Full table
D1 = –0.665Correlation + 3.194Entropy – 2.359Contrast + 3.194Energy – 1.986Homegenetiy
According to the weighing position of classification system, malignant SPNs might be determined if the value of discrimination function >0, while the value <10 denoted benign SPNs, with 83.3%, 90.0% and 86.6% for the sensitivity, specificity and overall discrimination accuracy, respectively.
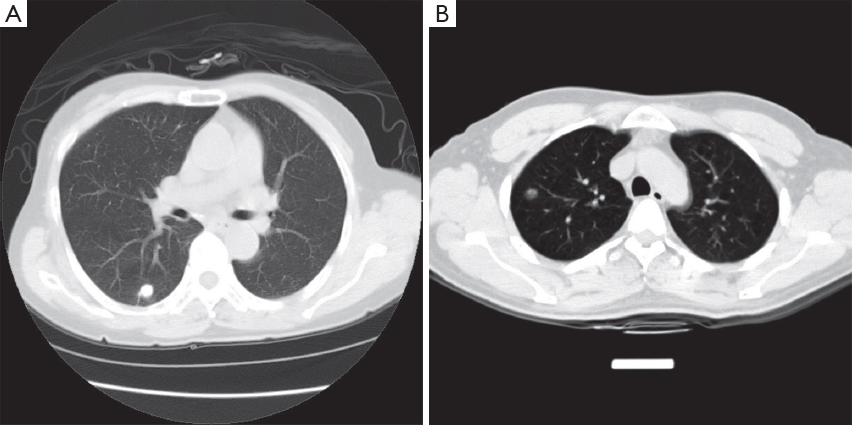
Case analysis (Figure 2).
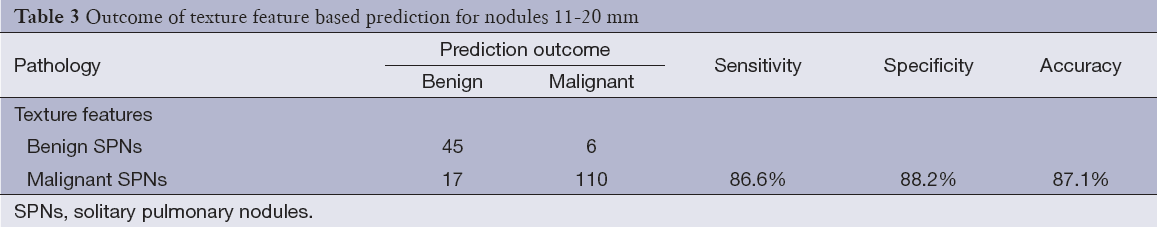
Group of SPNs 11-20 mm
The standardized linear discrimination function and discrimination outcomes were provided for SPNs with the size of 11-20 mm, as shown Table 3.
Full table
D1 = 0.137Correlation – 0.562Entropy + 2.454Contrast – 1.776Energy + 2.938Homegenetiy
According to the weighing position of classification system, benign SPNs might be determined if the value of discrimination function >0, while the value <10 denoted malignant SPNs, with 86.6%, 88.2% and 87.1% for the sensitivity, specificity and overall discrimination accuracy, respectively.
Case analysis (Figure 3).
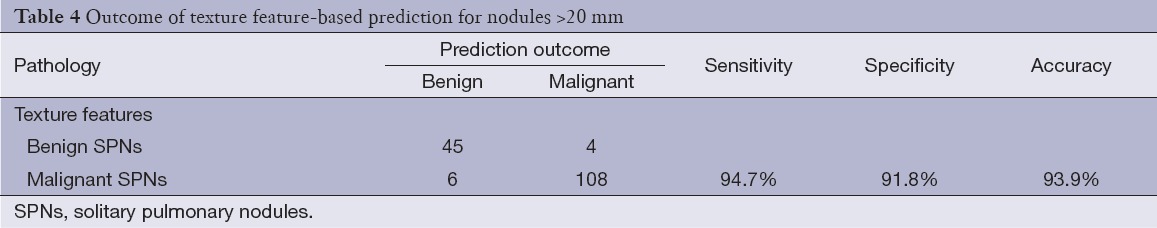
Group of SPNs >20 mm
The standardized linear discrimination function and discrimination outcomes were provided for SPNs with the size of >20 mm, as shown Table 4.
Full table
D1 = –0.465Correlation + 0.133Entropy + 2.231Contrast –1.344Energy + 3.288Homegenetiy
According to the weighing position of classification system, benign SPNs might be determined if the value of discrimination function >0, while the value <10 denoted malignant SPNs, with 94.7%, 91.8% and 93.9% for the sensitivity, specificity and overall discrimination accuracy, respectively.
Case analysis (Figure 4).
Discussion
The texture features of 379 segmented SPNs were extracted in our current study. The entropy and contrast of malignant SPNs have been demonstrated to be higher in comparison to those of benign SPNs, while the energy, homogeneity correlation of malignant SPNs were lower than those of benign SPNs. There were statistically significant differences in the texture features of radiological images between malignant and benign SPNs.
The energy of images was identified to be a scale to measure the grayscale distribution homogeneity of images and texture crudeness. Homogenous greyscale distribution and coarser particles were associated with higher energies; absence of local regions and homogenous local distribution in image textures were associated with higher homogeneity; correlation reflects the relevance of grey-scale in image texture; and higher values of matrix elements and finer image textures were associated with higher values of correlation (9,10). In this study, the energy, homogeneity and correlation were higher in benign SPNs than in malignant SPNs, suggesting the features of relatively homogenous grey-scale distribution, normal local texture regularity and relatively lower grey-scale contrast for benign SPNs; however, messy local texture, uneven grey-scale distribution and significant grey-scale contrast could be observed in malignant SPNs. Texture is known as a feature of tissue, which is composed of cells. Therefore, the texture changes of malignant SPNs was proposed to be associated with different cell sizes, irregular cell alignment, and cell polarity disorders in nodules involved.
Contrast reflects the sharpness of images and the depth of texture grooves. Higher grey-scale diversity (e.g., contrast) was associated with more pixels and higher contrast. Entropy reflects the non-uniformity and complexity of image texture. More complicated images were associated with higher entropy (11,12). The contrast and entropy were lower in benign SPNs than in malignant nodules, which showed malignant nodules were associated with deeper grooves in image texture and more complicated grey-scale in local images. In contrast, benign SPNs were associated with shallow image textures and relatively homogenous distribution of grey-scale. These results were consistent with the relative complicated nature of malignant tumors. Malignant tumors are often concomitant with hemorrhage, liquefaction and necrosis, in addition to their inconsistent characteristics of cell size, morphology and polarity, which constituted the pathological basis of texture changes.
For SPNs of different size groups, texture feature based differential diagnosis showed satisfactory accuracies for the groups of ≤10, 11-20, and >20 mm, with the sensitivity of 83.3%, 86.6% and 94.7%, the specificity of 90.0%, 88.2% and 91.8%, and the accuracy of 86.8%, 87.1% and 93.9%, respectively. For texture features, based on the results of intergroup differentiation of nodules in different sizes, the accuracy of differential diagnosis was increased in proportion to the size of pulmonary nodule, mainly due to the continuous elevation of sensitivity without significant changes of specificity.
The texture features of images were important in the differential diagnosis of benign and malignant SPNs. Texture features might be useful to depict certain repeated local patterns and arrangement regularity in specified regions of images, could be used to describe local characteristics of images, and could provide characteristic metrics such as smoothness, roughness and regularity (13,14). In this study, the texture features of SPNs were investigated by the GLCM method, which could be used to determine the correlation between two greyscale points different in both distance and directions to each other based on the co-occurrence matrix model, and reflected the integrated information of direction, spacing and magnitude of changes in image greyscales to describe the roughness and repeated directions of image texture (15-17).
In this study, the diagnostic sensitivities were increased in proportion to the size of nodules in different size-groups of SPNs, without notable changes of the specificity. This was due to the features of benign SPNs, such as regular local texture and relatively homogeneous spreading, without notable texture changes in response to the size increase of nodules. Therefore, the changes of specificity were limited. However, with the size increase of nodules, they were more vulnerable to develop uneven distribution of texture, heterogeneity and even evolvement, resulting in uneven distribution of texture, increased contrast of greyscales and complicated greyscale of local images, and increase of entropy. Thus, with the size increase of malignant SPNs, more notable changes of texture characteristics might be observed, resulting in improved diagnostic sensitivity.
According to CT-based diagnosis of SPNs, the relevant risk factors such as age, size, glitches, lobulation, vascular aggregation, air cavity density and so on were analyzed using binary Logistic regression analysis (18). Since those radiological findings were up to the clinical experience of radiologists, there is a subjective factor involved in this process. Radiological findings segmented by a computer aided approach would be more objective with quantitative texture features, which are truly relevant with benign SPNs and 2 malignant SPNs.
Conclusions
The texture features of images were very important for the differential diagnosis of SPNs. However, due to the retrospective nature of this study, no prospective analysis was implemented. Only CT plain images of SPNs were used and changes of texture features pre- and post-enhancement of SPNs were not analyzed.
Acknowledgements
This study was supported by National Natural Science Fund project [81202284], Guangdong Provincial Natural Science Fund project [S2011040004735], Project for Outstanding Young Innovative Talents in Colleges and Universities of Guangdong Province [LYM11106], and Special Research Fund for Basic Scientific Research Projects in Central Universities [21612305, 21612101]. Guangzhou Municipal Science and Technology Fund project [2014J4100119].
Disclosure: The authors declare no conflict of interest.
References
- White CS, Pugatch R, Koonce T, et al. Lung nodule CAD software as a second reader: a multicenter study. Acad Radiol 2008;15:326-33. [PubMed]
- Retico A, Delogu P, Fantacci ME, et al. Lung nodule detection in low-dose and thin-slice computed tomography. Comput Biol Med 2008;38:525-34. [PubMed]
- Sahiner B, Chan HP, Hadjiiski LM, et al. Effect of CAD on radiologists’ detection of lung nodules on thoracic CT scans: analysis of an observer performance study by nodule size. Acad Radiol 2009;16:1518-30. [PubMed]
- Szucs-Farkas Z, Patak MA, Yuksel-Hatz S, et al. Improved detection of pulmonary nodules on energy-subtracted chest radiographs with a commercial computer-aided diagnosis software: comparison with human observers. Eur Radiol 2010;20:1289-96. [PubMed]
- Sahoo PK, Arora G. A thresholding method based on two-dimensional Renyi’s entropy. Pattern Recognition 2004;37:1149-61.
- Sutton RN, Hall EL. Texture Measures for Automatic Classification of Pulmonary Disease. IEEE Transactions on Computers 1972;21:667-76.
- Mahmoud-Ghoneim D, Toussaint G, Constans JM, et al. Three dimensional texture analysis in MRI: a preliminary evaluation in gliomas. Magn Reson Imaging 2003;21:983-7. [PubMed]
- Zhan Y, Shen D. Deformable segmentation of 3-D ultrasound prostate images using statistical texture matching method. IEEE Trans Med Imaging 2006;25:256-72. [PubMed]
- Materka A. Texture analysis methodologies for magnetic resonance imaging. Dialogues Clin Neurosci 2004;6:243-50. [PubMed]
- Herlidou-Même S, Constans JM, Carsin B, et al. MRI texture analysis on texture test objects, normal brain and intracranial tumors. Magn Reson Imaging 2003;21:989-93. [PubMed]
- Siew LH, Hodgson RM, Wood EJ. Texture Measures for Carpet Wear Assessment. IEEE Transactions on Pattern Analysis and Machine Intelligence 1988;10:92-105.
- Jain AK, Farrokhnia F. Unsupervised texture segmentation using gabor filters. Pattern Recognition 1991;24:1167-1186.
- Wang H, Bai X, Wang H. Wood texture classification and recognition based on GLCM. Forest Engineering 2007;23:32-6.
- Gandhi DK, Sagale KS, Gupta V. Detection of brain tumor and extraction of texture features using magnetic resonance images. IJEIR 2012;1:412-14.
- Tahir MA, Bouridane A, Kurugollu F. An FPGA Based Coprocessor for GLCM and Haralick Texture Features and their Application in Prostate Cancer Classification. Analog Integrated Circuits and Signal Processing 2005;43:205-215.
- Mohamed SS, Li J, Salama MM, et al. Prostate tissue texture feature extraction for suspicious regions identification on TRUS images. J Digit Imaging 2009;22:503-18. [PubMed]
- Mougiakakou SG, Valavanis IK, Nikita A, et al. Differential diagnosis of CT focal liver lesions using texture features, feature selection and ensemble driven classifiers. Artif Intell Med 2007;41:25-37. [PubMed]
- Shi CZ, Zhao Q, Luo LP, et al. Size of solitary pulmonary nodule was the risk factor of malignancy. J Thorac Dis 2014;6:668-76. [PubMed]