
Fused monochromatic imaging acquired by single source dual energy CT in hepatocellular carcinoma during arterial phase: an initial experience
Introduction
Computed tomography (CT) is one of the most important modalities for hepatic tumors’ detection, diagnosis, staging and treatment outcomes evaluation. The delineation of the tumor must be sufficiently different from that of the adjacent liver parenchyma, which should be detected by investigators.
Single source dual energy CT (ssDECT) imaging can reconstruct any monochromatic image from 40 to 140 keV. Monochromatic images have reduced beam-hardening effects, and the energy level can be further adjusted to optimally reduce any remaining beam-hardening artifacts (1,2). The attenuation of a material increases as its photon energy decreases (3). Materials with higher atomic numbers, such as iodine, exhibit a much greater attenuation increase as the photon energy decrease, which provide the basis for the greater attenuation separation between tumor and liver parenchyma in the enhanced arterial phase (4). Monochromatic images are of excellent image quality, offering high contrast-to-noise ratio. Various keV levels of monochromatic images can detect various structures including minute internal structures within a single lesion (5,6). The clinical practice of ssDECT imaging remains nascent, and some research focused on high-quality tumor imaging (7-9), but the imaging quality of the surrounding tissues is also very important for diagnosing. Most of hepatocellular carcinomas (HCCs) show obvious enhancement in arterial phase, which is very useful for detecting and diagnosing (10). Unfortunately, we found that the optimal monochromatic images for HCC tumors and liver parenchyma were not at the same level.
The purpose of this study is to explore whether ssDECT can improve liver tumor detection and delineation by monochromatic CT images and fusion of monochromatic images in patients with HCC during hepatic arterial phase.
Materials and methods
Patients
This study was approved by Institutional Review Board of Beijing Cancer Hospital, and written informed consent was obtained. From June 2010 to December 2011, fifty-seven HCC patients who underwent contrast-enhanced ssDECT scans at Department of Radiology, Beijing Cancer Hospital were retrospectively enrolled in this study. There were 51 males and 6 females, with an age range from 23 to 78 years (mean age, 55.4±11.1 years). The size of the HCC tumors ranged from 0.6 to 18.4 cm, with an average size of 4.2 cm. The patients’ body mass indices (BMIs) ranged from 17.60 to 24.01 (mean, 20.02±1.57).
Imaging technique
All of the patients underwent plain CT scan and three enhancement phase (arterial, portal, and delayphase) CT scans with a single-tube, rapid dual kVp (80 and 140 kVp) switching technique on a high-definition Discovery CT750 HD (GE Healthcare, Wisconsin, USA). The scan coverage extended from the top of the diaphragm to the lower border of the liver. The ssDECT scan was conducted using the following parameters: helical scanning, a 0.8 s tube rotation time, a 40 mm detector coverage, a pitch factor of 0.985:1, and a 35 cm display field of view (DFOV). The examinations were at a moderate dose level [mean CTDI (vol) =17.11 mGy]. A non-ionic contrast medium (300 mg I/mL iohexol at a dose of 1.5 mL/kg) was injected through the median cubital vein using a power injector at a rate of 3 mL/s. The arterial-phase was performed 30 s after the injection. The reconstruction thickness was 5 mm, with intervals of 5 mm.
Data processing
Twenty-one sets of monochromatic images from 40 to 140 keV were reconstructed at 5 keV intervals by AW 4.4 viewer software (GE Healthcare, Wisconsin, USA). The optimal contrast-noise ratio (CNR) monochromatic images of the liver tumor and the lowest-noise monochromatic images of the liver were selected for image fusion by AW 4.4 volume viewer software.
The CT values of the tumor, liver parenchyma, abdominal aorta and air around the abdominal wall were measured in all twenty-one sets of monochromatic images and fused images respectively. The contrast of the tumor is a relative value which was defined as the CT value difference between the tumor and liver parenchyma. The CNR between the tumor and liver parenchyma was measured using three types of imaging, including optimal-CNR monochromatic images, lowest-noise monochromatic images and fused monochromatic axial images. A circular region of interest (ROI) with pixels ranging from 100 to 400 was placed onto various areas to measure the mean CT values and image noise. The ROI was placed on the active tumor (avoiding necrosis and hemorrhage area), the adjacent normal liver parenchyma (avoiding blood vessels) and the air space around the abdominal wall. The ROI was copied from one image to another. The CNR was defined according to the following formula: CNR =|CTVLP–CTVLT|/SDA. Where CTVLT denotes the liver active tumor’s CT value, CTVLP denotes the CT value of the liver parenchyma adjacent to the tumor in the same slice, and SDA denotes the mean background image noise. The standard deviation of the CT value of the air around the abdominal wall was used as the mean image noise, SDA (11).
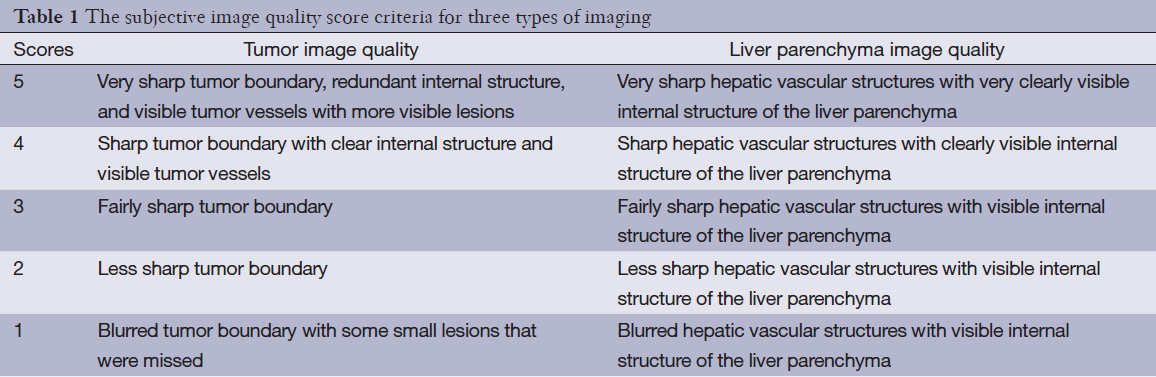
Two radiologists with at least 10 years of experience in abdominal CT independently performed a blinded qualitative analysis of CT images. The criteria for image grading were consensually established before the start of image reading. The image quality of the liver tumor was assessed with subjective scores on CT images, according to the hepatic vessels and the liver structures of all three image types. Each case was evaluated using scores of 1-5, depending on the contrast of the tumor, the boundary of the tumor, the internal structure of the tumor, the distinctness of the tumor vessels, and the distinctness of the basic structure of the liver parenchyma as the criteria shown in Table 1. The scores of the optimal monochromatic images, the lowest-noise monochromatic images and the fused monochromatic images were compared at the same window width, window level and FOV.
Full table
Statistical analysis
SPSS 13.0 software (SPSS for Windows, Ver.13.0; SPSS Inc., Chicago, IL, USA) was used for the statistical analyses. Paired Student’s t-tests and Wilcoxon signed-rank tests were conducted to compare the background noises, CNRs and subjective image scores from the optimal monochromatic, lowest-noise level monochromatic and fused monochromatic images. Bonferroni correction was used for multiple comparisons. A two-tailed P value of <0.05 was defined to be statistically significant. For each parameter, an average score was obtained and used as the subjective criterion for the evaluation of the image quality. Interobserver agreement between the two reviewers was calculated using Kappa statistics for data of the sum subjective image scores.
Results
In all twenty-one monochromatic image sets, the contrast among the HCC tumors and the adjacent liver parenchyma increased when a set of monochromatic images was selected at a lower keV level (Figure 1A). The lowest-noise monochromatic image set was 65 keV based on the boxplot drawn by the SPSS software based on the data base of all 57 cases (Figure 1B). The liver parenchyma was displayed most clearly in 65-keV monochromatic images. The optimal CNRs of the liver tumor were obtained at 50-keV monochromatic images based on the boxplot (Figure 1C), which were quite similar to the optimal CNR keV level for the liver tumor automatically generated by the viewer software (Figure 1D).
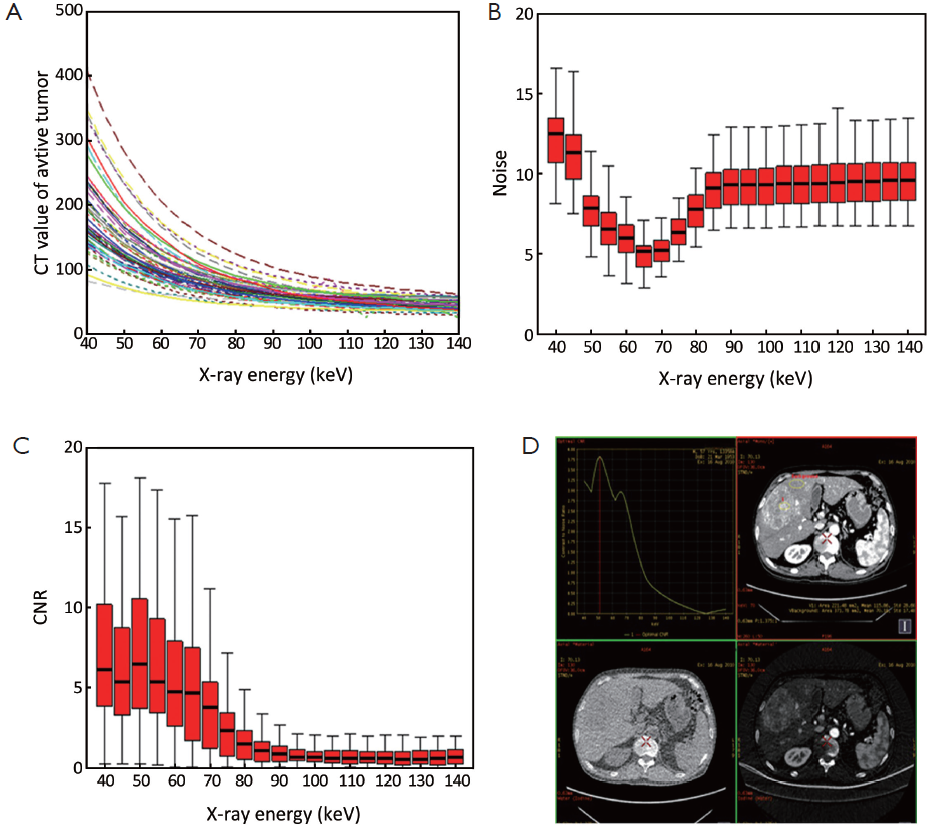
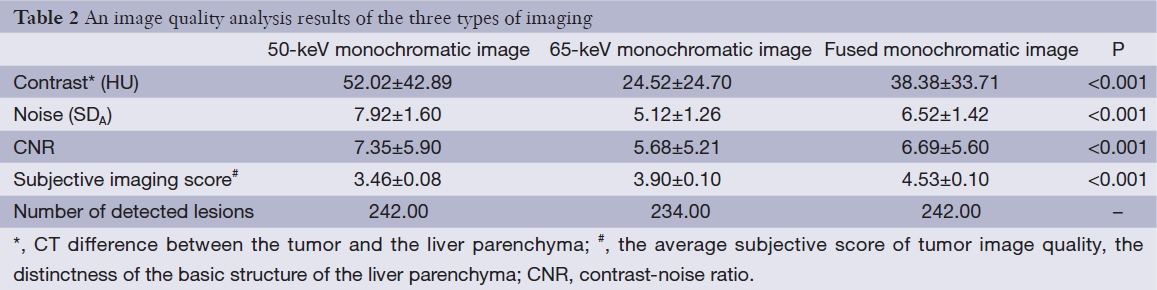
Based on our results, 50-keV monochromatic image set was the optimal CNR monochromatic image that displayed the tumor and vascular structures, and 65-keV monochromatic image set had the least noise among all of the monochromatic images of the abdomen. Therefore, these two sets were overlaid by the AW 4.4 volume viewer software as the fused monochromatic image. The contrast between the tumor and the liver parenchyma, the CNR measurements of the liver tumor, the noise level, the imaging scores and the numbers of detected lesions were compared across these three types of images, including 50-keV monochromatic images, 65-keV monochromatic images and fused monochromatic axial images. The results are shown in Table 2.
Full table
The largest difference in the CT values of the tumors and liver parenchyma was found in 50-keV monochromatic images. Furthermore, the difference in the CT values between tumors and liver parenchyma in the fused monochromatic images was significantly higher than that in the 65-keV monochromatic images (P<0.001).
The least background noise was obtained from 65-keV monochromatic images. There was a statistically significant difference in the CNRs between the tumors and liver parenchyma in all three types of images (P<0.001). The best CNR was obtained from 50-keV monochromatic images, followed by the fused monochromatic images (Figure 2).
The Kappa value of the data from the two radiologists is 0.745, indicating moderate agreement. There was a statistically significant difference in the subjective image quality scores across all three types of images, based on the investigators’ judgment and analysis of the structural details of the tumor and liver (P<0.001). The fused monochromatic images had the highest score, which was slightly superior to that of 65-keV monochromatic images.
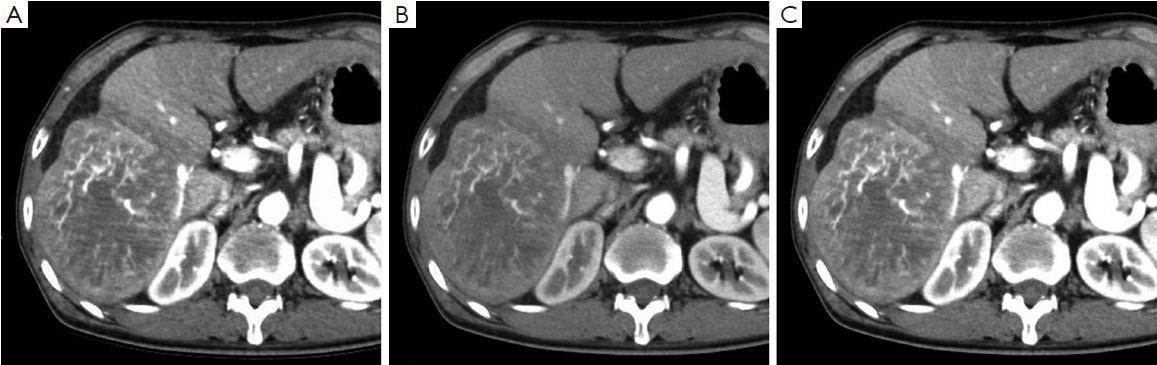
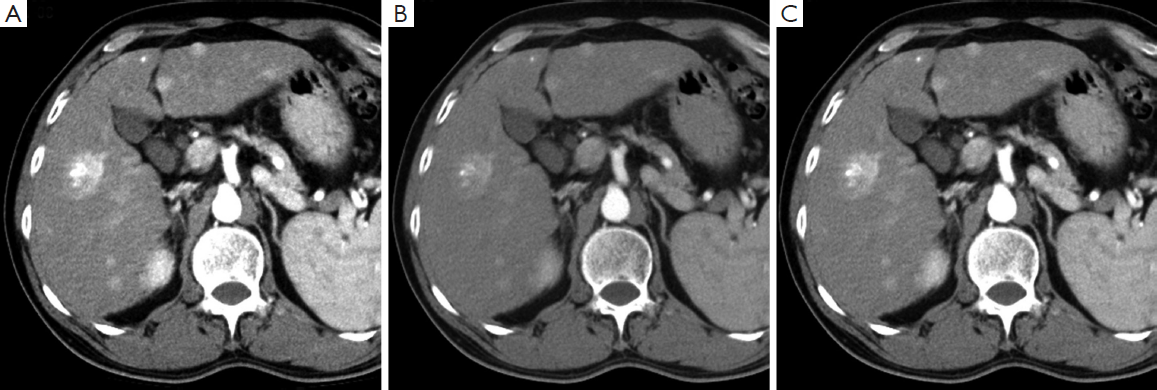
The liver tumor lesions were detected to the greatest extent both in the fused monochromatic images and 50-keV monochromatic images. A total of 242 liver tumor lesions were detected equally. Although 234 liver tumor lesions were detected in 65-keV monochromatic images, their lesion-detecting ability slightly inferior to that of the former type of images (Figure 3).
Discussion
All of the 57 HCC cases included in this study all showed hypervascular characteristics with remarkable enhancement during arterial phase in enhanced CT scans. Previous studies using a dual-source CT scanner have demonstrated that a low-tube-voltage (80 kVp) scan provides better contrast and conspicuity than a high-voltage (140 kVp) scan for detecting hypervascular liver tumors, because the low-tube-voltage scan takes advantage of the attenuation property of the iodinated contrast material at 80 kVp (12,13). The attenuation value of the contrast material (e.g., iodine) increases with the use of a low-voltage X-ray because of an increased photoelectric effect, although the resulting image contains more noise (14).
Single source dual energy spectral CT scans with a single-tube, rapid dual kVp (80 and 140 kVp) switching technique, which efficiently eliminates beam-hardening artifacts and provides the monochromatic images. ssDECT imaging can reconstruct a monochromatic image set at any keV level from 40 to 140 keV. Various keV levels of monochromatic images can detect various tissue characteristics and various minute internal structures within a single lesion. In addition, the 101 monochromatic image sets generated by the spectral imaging provided the opportunity to select the optimal energy level for the best CNR to display the liver tumors (15,16). In our study, the monochromatic energy level of 50 keV achieved the best CNR for the liver tumors and hepatic vascular structures, and 65 keV achieved the least noise in the abdominal images. These are similar to the results of the study by Matsumoto (17,18).
Our results indicate that the corresponding CNRs of the HCC tumors and hepatic vascular structures are 9.34±0.92 at 50 keV, which is the highest CNR of all monochromatic images. The CNR plays an important role in improving liver CT imaging. Although 50-keV monochromatic image noise was about 50% higher than the lowest-noise monochromatic image noise (65-keV monochromatic image), 10 more lesions were detected in 50-keV monochromatic images. However, the liver parenchyma can’t be clearly displayed in 50-keV monochromatic images due to the increased noise, and the subjective score was also lower than that of the 65-keV monochromatic images.
We fused the optimal CNR monochromatic image set and the lowest-noise monochromatic image to acquire a certain image set which can not only detect the liver tumor lesions and hepatic vessels clearly, but also display the liver parenchyma distinctly. 50-keV monochromatic images and 65-keV monochromatic images were selected as the optimal CNR monochromatic images and the lowest noise monochromatic images which can be overlaid as fused monochromatic images by the AW 4.4 volume viewer software. Our results indicate that even though the CNR and noise of the fused monochromatic images were slightly inferior to those of 50-keV monochromatic images, but the fused monochromatic images had equal performances to detect liver tumor lesions. Furthermore, the subjective image scores of the fused monochromatic images (based on the investigators’ judgment and analysis of the structural details of the tumor and liver) were much higher than those of 50-keV monochromatic images.
In general, the liver tumor image quality was significantly improved in 50-keV monochromatic imaging. The fused monochromatic images have the advantages of the optimal CNR monochromatic images and the lowest noise monochromatic images, as which can display the liver tumors, vascular structures and liver parenchyma clearly and simultaneously in the same CT images. In the future, this advantage and the proportion of different images for fusing, which also modify the general visual impression of the fused image, should be investigated further (19,20).
Our study has several potential limitations. First, we cannot find pathology evidence as gold standard for all of the HCC tumors, so the true number of lesions was not indicated. We calculated the number of the tumors mainly based on the typical enhanced CT image features. Second, this is a retrospective study. Most of the HCC tumors were hypervascular lesions, which are significantly enhanced during arterial phase. All arterial phases were acquired with a fixed delay of 30 seconds, which is a routine scanning method for abdomen in our department. It is probably not the best way to do so. Third, we cannot compare monochromatic CT images with conventional polychromatic energy CT images, because the patients cannot be underwent these two CT scanning mode at the same time.
In conclusion, monochromatic images can be obtained using ssDECT, which can enhance the CT attenuation of the iodine contrast media at certain lower keV levels. We achieved high enough image quality by fusing the optimal-CNR monochromatic images of the liver tumors and the lowest-noise hepatic monochromatic images, which can display the liver tumors and the anatomical structures more clearly. The fused monochromatic images were helpful for identifying more and smaller liver tumor lesions.
Acknowledgements
We thank Liping Qi, Kun Cao, Zhilong Wang and Yanling Li for editorial support and reviewing the manuscript.
Funding: This work was supported by the National Basic Research Program of China (973 Program) (Grant No. 2011CB707705), National Natural Science Foundation of China (Grant No. 81371715; 81201215) and the Capital Characteristic Clinical Application Research (Grant No. Z121107001012115).
Disclosure: The authors declare no conflict of interest.
References
- Yamada M, Jinzaki M, Kuribayashi S, et al. Beam-hardening correction for virtual monochromatic imaging of myocardial perfusion via fast-switching dual-kVp 64-slice computed tomography: a pilot study using a human heart specimen. Circ J 2012;76:1799-801. [PubMed]
- Pessis E, Campagna R, Sverzut JM, et al. Virtual monochromatic spectral imaging with fast kilovoltage switching: reduction of metal artifacts at CT. Radiographics 2013;33:573-83. [PubMed]
- Schindera ST, Torrente JC, Ruder TD, et al. Decreased detection of hypovascular liver tumors with MDCT in obese patients: a phantom study. AJR Am J Roentgenol 2011;196:W772-6. [PubMed]
- Marin D, Nelson RC, Samei E, et al. Hypervascular liver tumors: low tube voltage, high tube current multidetector CT during late hepatic arterial phase for detection--initial clinical experience. Radiology 2009;251:771-9. [PubMed]
- Yu L, Christner JA, Leng S, et al. Virtual monochromatic imaging in dual-source dual-energy CT: radiation dose and image quality. Med Phys 2011;38:6371-9. [PubMed]
- Zhang D, Li X, Liu B. Objective characterization of GE discovery CT750 HD scanner: gemstone spectral imaging mode. Med Phys 2011;38:1178-88. [PubMed]
- Lv P, Lin XZ, Li J, et al. Differentiation of small hepatic hemangioma from small hepatocellular carcinoma: recently introduced spectral CT method. Radiology 2011;259:720-9. [PubMed]
- Tsurusaki M, Sugimoto K, Fujii M, et al. Combination of CT during arterial portography and double-phase CT hepatic arteriography with multi-detector row helical CT for evaluation of hypervascular hepatocellular carcinoma. Clin Radiol 2007;62:1189-97. [PubMed]
- Yu Y, Lin X, Chen K, et al. Hepatocellular carcinoma and focal nodular hyperplasia of the liver: differentiation with CT spectral imaging. Eur Radiol 2013;23:1660-8. [PubMed]
- van Leeuwen MS, Noordzij J, Feldberg MA, et al. Focal liver lesions: characterization with triphasic spiral CT. Radiology 1996;201:327-36. [PubMed]
- Spielmann AL, Nelson RC, Lowry CR, et al. Liver: single breath-hold dynamic subtraction CT with multi-detector row helical technology feasibility study. Radiology 2002;222:278-83. [PubMed]
- Schindera ST, Nelson RC, Mukundan S Jr, et al. Hypervascular liver tumors: low tube voltage, high tube current multi-detector row CT for enhanced detection--phantom study. Radiology 2008;246:125-32. [PubMed]
- Sakane M, Kim T, Hori M, et al. Effects of High-concentration contrast material and low-voltage CT on contrast for multiphasic CT of the upper abdomen: comparison using the simulation with virtual monochromatic imaging obtained by fast-switch kVp dual-energy CT. Springerplus 2014;3:234. [PubMed]
- Nakayama Y, Awai K, Funama Y, et al. Abdominal CT with low tube voltage: preliminary observations about radiation dose, contrast enhancement, image quality, and noise. Radiology 2005;237:945-51. [PubMed]
- Cui Y, Gao SY, Wang ZL, et al. Which should be the routine cross-sectional reconstruction mode in spectral CT imaging: monochromatic or polychromatic? Br J Radiol 2012;85:e887-90. [PubMed]
- Yamada Y, Jinzaki M, Tanami Y, et al. Virtual monochromatic spectral imaging for the evaluation of hypovascular hepatic metastases: the optimal monochromatic level with fast kilovoltage switching dual-energy computed tomography. Invest Radiol 2012;47:292-8. [PubMed]
- Matsumoto K, Jinzaki M, Tanami Y, et al. Virtual monochromatic spectral imaging with fast kilovoltage switching: improved image quality as compared with that obtained with conventional 120-kVp CT. Radiology 2011;259:257-62. [PubMed]
- Lv P, Lin XZ, Chen K, et al. Spectral CT in patients with small HCC: investigation of image quality and diagnostic accuracy. Eur Radiol 2012;22:2117-24. [PubMed]
- Kim KS, Lee JM, Kim SH, et al. Image fusion in dual energy computed tomography for detection of hypervascular liver hepatocellular carcinoma: phantom and preliminary studies. Invest Radiol 2010;45:149-57. [PubMed]
- Behrendt FF, Schmidt B, Plumhans C, et al. Image fusion in dual energy computed tomography: effect on contrast enhancement, signal-to-noise ratio and image quality in computed tomography angiography. Invest Radiol 2009;44:1-6. [PubMed]