
Role of MR-DWI and MR-PWI in the radiotherapy of implanted pulmonary VX-2 carcinoma in rabbits
Introduction
Lung cancer is the leading cause of cancer-related deaths worldwide (1). The overall 5-year survival rate is only 5% even after surgical removal, radiotherapy, chemotherapy, and gene therapy (2). Thus, early identification and early treatment are key to improving the survival rate of patients with lung cancer (3). Along with the rapid development of new technology such as superconducting high-field magnets, the observation of the changes after tumor radiotherapy has become possible by using magnetic resonance imaging (MRI) and some software with special features. As a non-invasive approach, MRI, which includes magnetic resonance diffusion-weighted imaging (MR-DWI) and magnetic resonance perfusion weighted imaging (MR-PWI), has increasingly been applied for evaluating the therapy response in patients with lung cancer. As we know, detection and quantitative analysis are particularly important during the treatment of the in situ or infiltrative lung cancer.
MR-DWI is the only available approach for detecting the water molecule movement in vivo. The speed of water molecule movement can be presented as the apparent diffusion coefficient (ADC) values, which can be quantified on DWI. The changes in ADC values can indirectly reflect the proliferation or suppression of tumor cells (4). The in vivo distribution of water molecules is mainly inside cells, outside cells, and among tissues.
In particular, the water molecule movement outside cells exerts a dominant effect on the DWI signal. When cells undergo necrosis or apoptosis, the extracellular spaces are dramatically enlarged and the water molecule movement increases, resulting in increased ADC values. The density of tumor cells becomes higher after extensive proliferation; as a result, the limitation of the biofilm structure on the diffusion of water molecules becomes more obvious, and thus the ADC value declines.
PWI-MRI can, in a non-invasive manner, reflect the vascularization and flood flow in tissues, after a particular treatment and quantitatively analyze the hemodynamics of tissues and tumors (5,6). Tumor angiogenesis plays a key role in the occurrence, development, invasion, and metastasis of solid tumors and will remarkably affect the biological behaviors and prognosis of tumors (7-9). Tumor vessels not only supply nutrients needed for tumor growth and transport the metabolites but also provide channels for tumor cell dissemination (10,11). The presence of a large number of blood vessels of lung tumor increases the chances of tumor cells circulating in the blood circulation. The vascular basement membranes are often cracked; compared with the mature blood vessels, they are easier to leak and penetrated by tumor cells; as a result, metastasis occurs (12,13). Gd-DPTA, as an extracellular contrast agent, is mainly distributed in blood vessels and extracellular space. The distribution of the contrast agent determines the signal densities of the normal tissues and tumors after enhancement. Thus, it can directly reflect the blood perfusion in tissues and indirectly reflect the distribution of microvessels in tissues (14,15).
The rabbit tumor models have similar respiratory systems as human beings. These models can be easily established and fed, and therefore have been widely applied in animal experiments. In the clinical treatment of tumors, the enlarging or shrinking of tumors is often used for predicting the prognosis. However, a small number of microvessels and tumor tissues may still exist after the treatment even when all the tumor cells die. The absorption or excretion of tumor tissue will need a certain period of time. In our current study, we used DWI diffusion coefficient ADC and the perfusion coefficient of PWI to identify the hemodynamic changes in tumor cells and angiogenesis after radiotherapy in rabbit VX2 lung cancer models, with an attempt to assess the apoptosis of tumor cells and residual tumor angiogenesis after the radiotherapy and thus avoid excessive clinical treatment.
Materials and methods
Equipment and instrument
MR-DWI and MR-PWI were separately performed using a Philips Acheiva 1.5 T MRI machine (Philips, Netherland).
Animals and methods
Totally 62 healthy New Zealand white rabbits were provided by the Laboratory Animal Center of Peking University [animal production permit number: S (Beijing) 2009-0014]. These male or female rabbits weighed 2-3 kg (mean: 2.68 kg) and aged 4-6 months were fed under normal conditions. In one New Zealand rabbit, 0.3-0.5 mL VX2 cancer cell suspension (2×10⁷ cells/mL, provided by the laboratory of the Department of Interventional Therapy, Peking University Institute of Clinical) was injected subcutaneously to induce tumors. The tumorigenicity criteria were as follows: Firm soft tissue mass with limited mobility was palpable subcutaneously, which was pathologically confirmed to be squamous cell carcinoma. Two weeks after tumor implantation, tumors were removed from the tumor-bearing rabbits for preparing suspensions. In another 61 New Zealand rabbit, CT-guided lung puncture was performed to inject the suspensions into lungs. Modeling was successful in 56 rabbits and not in 5 rabbits. The criteria for success were: Plain MRI showed irregular soft tissue mass opacities, and enhancement of the lesions was observed under contrast-enhanced MRI.
The rabbits were randomly assigned into the treatment (n=28) and control groups (n=28). In the treatment group, the radiotherapy was performed 21 days later on a once weekly dosage of 1,000 cGy. MR-DWI and MR-PWI examinations were performed on days 21, 28, 35, 42, 49, and 56 (Figure 1).

Scanning protocol and parameters
On the examination day, rabbits in the treatment group and control group were fasted for 12 hours. A venous indwelling needle was inserted via the auricular vein before the scanning. After having been anesthetized with pentobarbital sodium, the rabbits were placed in supine position on a plate. A belly-belt was applied to reduce the respiratory motion. The concentration of sodium pentobarbital solution was 0.1 mmol/L, and the injection dosage was 1 mL/kg.
Perfusion imaging using static and single-level dynamic spiral CT (DSCT) scanning was performed. After the contrast agent Gd-DPTA (3-4 mL) was injected at a speed of 0.4 mL/s using a high-pressure syringe, the scans were performed after a delay of 1 s. Images were acquired using a continuous scanning mode.
The type of coil was “SENSE-body”. The DWI/ADC parameters were as follows: FOV, 150 mm; TR, 2,529; TED, 55; TI, 180; NSA, 16; and thickness, 3 mm. The PWI parameters were as follow: FOV, 150 mm; TR, 4.8; TE, 2.4; Flip, 10; NSA, 1; and thickness, 1 mm.
MR perfusion
MRI image processing was performed using special perfusion software and the WORKSPACE advanced workstation for MRI. The regions of interest (ROI) included the center and edge of the tumor lesion. Both MMR-DWI and ADC values were measured. The main parameters of MR-PWI included: wash in rate (WIR), wash out rate (WOR), and maximum enhancement rate (MER).
MRI image processing was performed using special perfusion software and the WORKSPACE advanced workstation for MRI. The ROI included the center and edge of the tumor lesion. Selection of ROI: the center and edge of the tumor lesion were selected at the same time point from both the treatment group and control group to measure their ADC values, WIR, WOR, and MER.
The acquired parameters were applied for image reconstruction and false color staining using special perfusion software and the WORKSPACE advanced workstation for MRI. Thus, the ADC values as well as the WIR, WOR, and MER images were obtained. The dynamic curves were drawn to evaluate the cellular activities and perfusion status at the lesions during the treatment.
Radiotherapy
In the treatment group, the radiotherapy was performed 21 days later using on a Siemens PRIMUS linear accelerator once weekly dosage of 1,000 cGy to yield a total dosage of 5,000 cGy.
Immunohistochemical determination
Streptomycin avidin-peroxidase method (SP) was applied. CD34 expression was judged as positive if the cell membrane or cytoplasm of the vascular endothelial growth factor (VEGF) showed yellow or brown staining. The expressions of VEGF were divided into four levels: –, 1+, 2+, and 3+. Five visual fields were randomly selected in each tumor section under a microscope (×200) to determine the brown-yellow-stained lymphatic vessel count. The results were interpreted based on the percentage of the positively stained cells: <5%, negative (–); 5-25%, weakly positive (1+); 26-50%, moderately positive (2+); and >50%, strongly positive (3+). Microvessel density (MVD) was determined by CD34 staining. The histological evaluations were performed independently by two senior pathologists.
Statistical analysis
Statistical analysis was performed using SPSS 13.0 software. Independent sample t-test was applied for the analysis of the ADC values and perfusion parameters of the centers and edges of the tumor lesions in the treatment group and control group. A value of P<0.05 was considered significantly different, and a value of P<0.01 was considered to be “highly significant”.
Results
ADC values in the ROI of the implanted pulmonary VX-2 carcinoma in rabbits
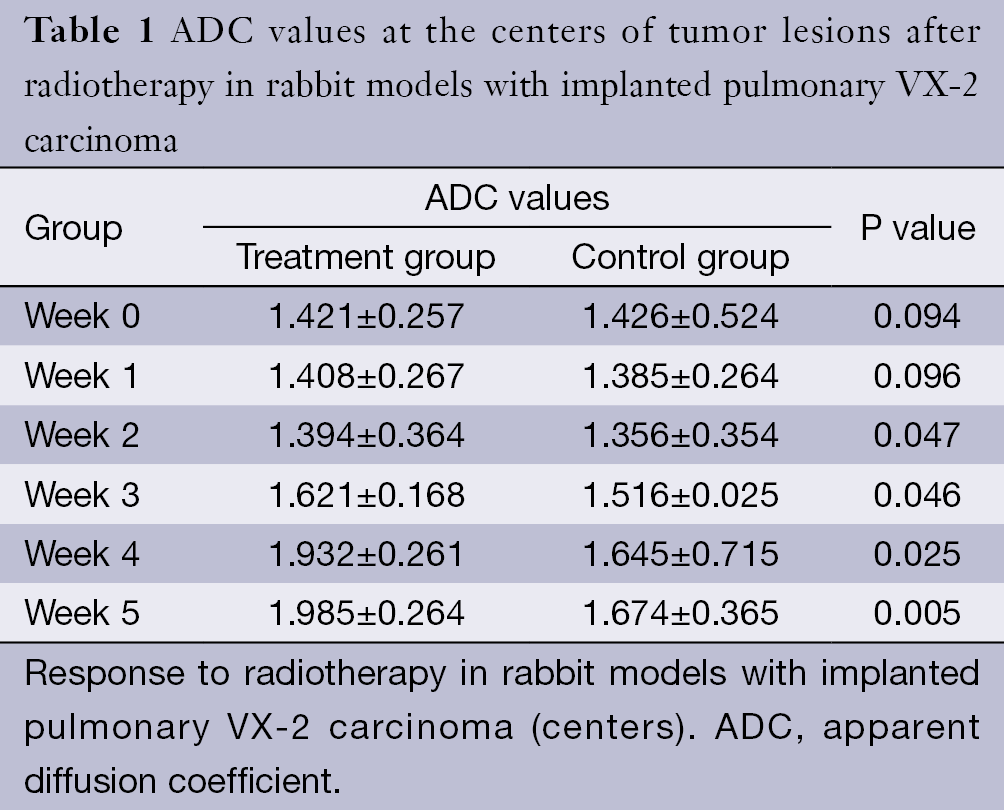
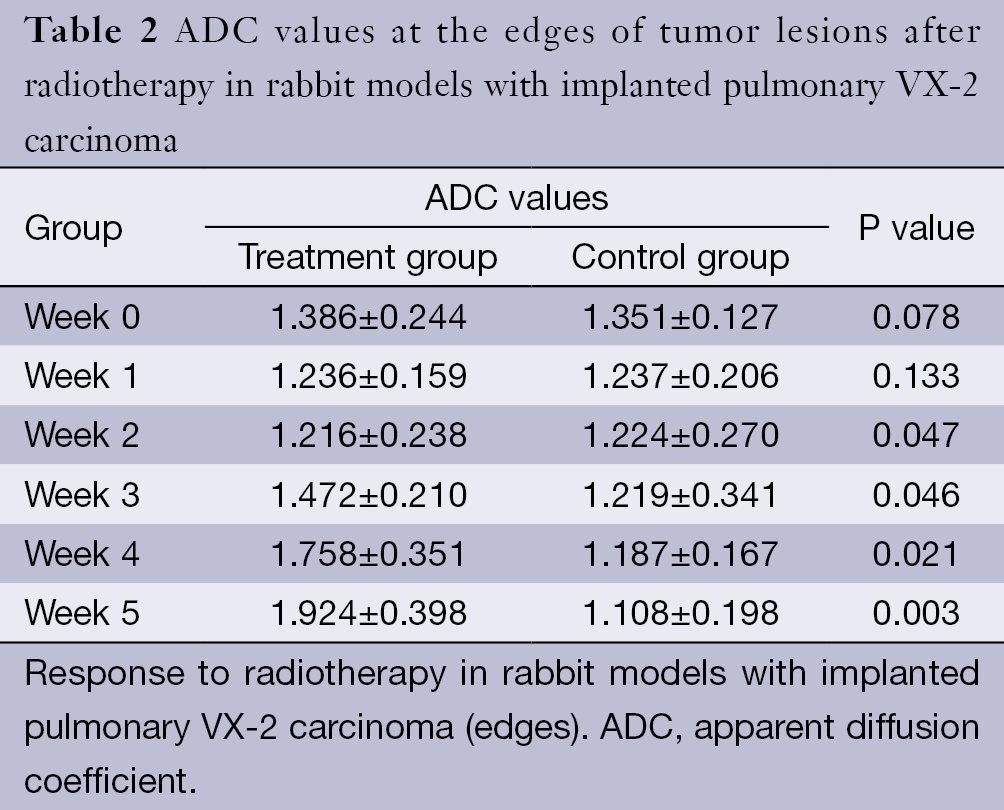
The ADC values of the centers and edges of the tumor lesions in the treatment group and control group are summarized in Tables 1 and 2. On the treatment day for the implanted pulmonary VX-2 carcinoma, the ADC values at the center and the edge of the lesions were 1.352 and 1.461 in the treatment group and control group (P>0.05). During weeks 0-1, the t values at the center and the edge of the lesions were 1.336 and 1.137 (P>0.05). During weeks 1-2, the t values were 1.731 and 1.736 (P<0.05). During weeks 2-3, the t values were 1.742 and 1.749 (P<0.05). During weeks 3-4, the t values were 2.050 and 2.127 (P<0.05). During weeks 4-5, the t values were 2.764 and 2.985 (P<0.05). The ADC values in the treatment group were significantly higher than in the control group.
Full table
Full table
PWI parameters in the ROI of the implanted pulmonary VX-2 carcinoma in rabbits
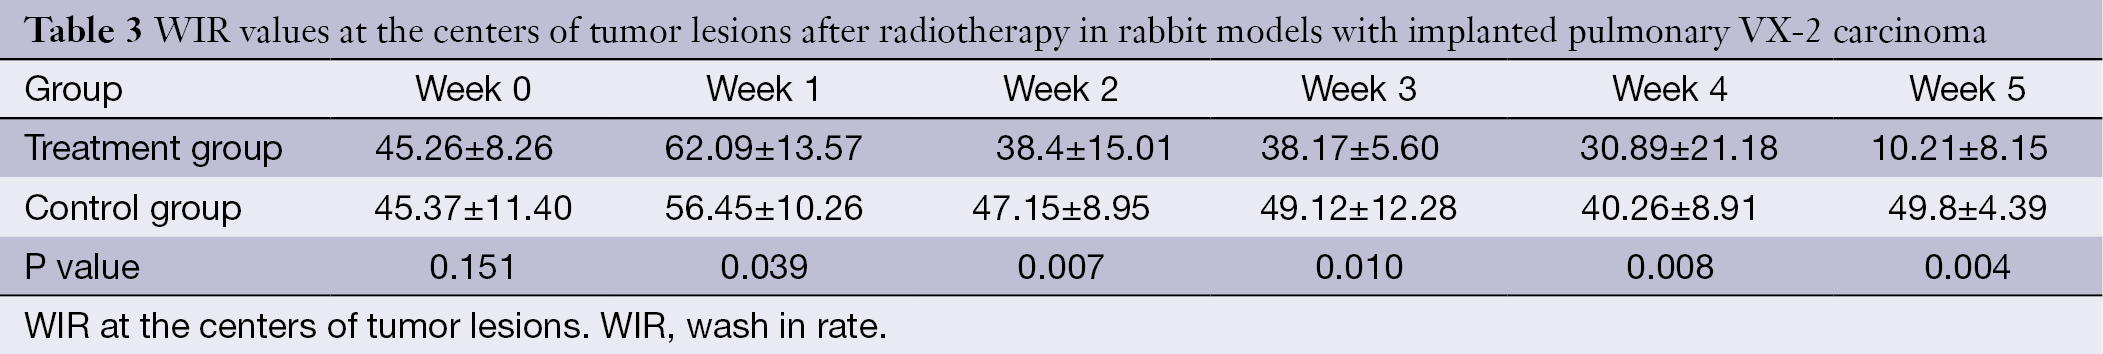
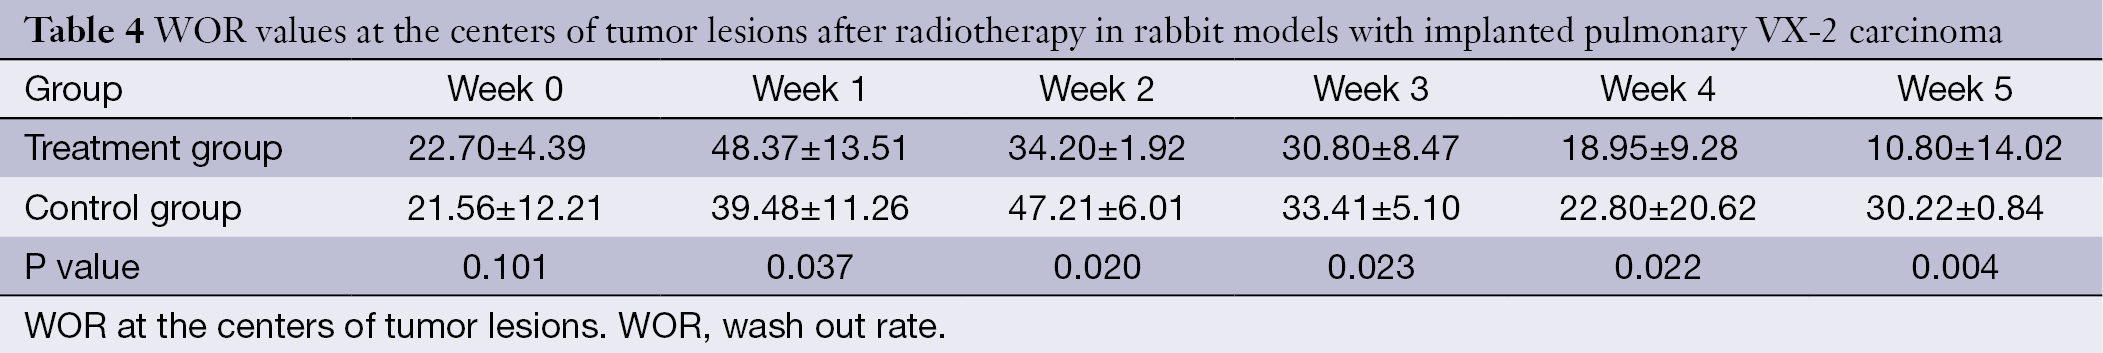
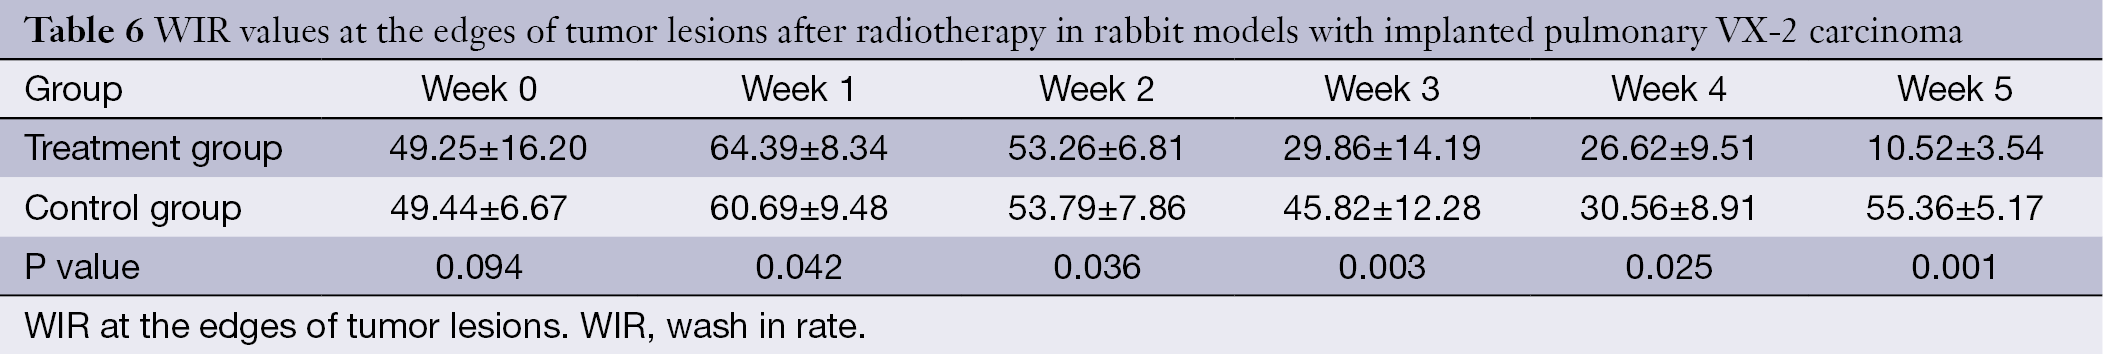
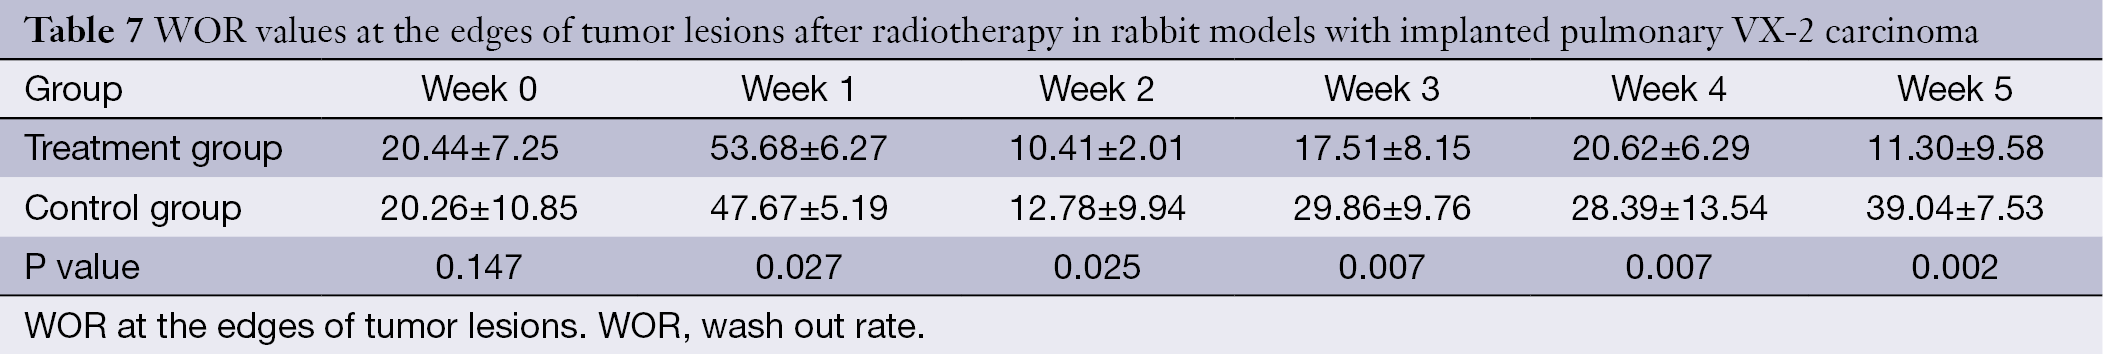
The WIR, WOR, and MER at the centers of the tumor lesions the treatment group and control group are shown in Tables 3,4,5, respectively. The WIR, WOR, and MER at the edges of the tumor lesions are shown in Tables 6,7,8. On the treatment day for the implanted pulmonary VX-2 carcinoma, the t values of the WIR, WOR, and MER at the centers of the lesions were 1.05, 1.31, and 1.33 in the treatment group and control group (P>0.05); in addition, the t values of the WIR, WOR, and MER at the edges of the lesions were 1.35, 1.07, and 1.51 (P>0.05). During weeks 0-1 after treatment, the t values of the WIR, WOR, and MER at the center of the lesions were 1.821, 1.856, and 1.931 (P<0.05); in addition, the t values of the WIR, WOR, and MER at the edge of the lesions were 1.799, 2.016, and 2.137 (P<0.05). During weeks 1-1 after treatment, the t values of the WIR, WOR, and MER at the center of the lesions were 2.574, 2.156, and 2.059 (P<0.05) and the t values of the WIR, WOR, and MER at the edge of the lesions were 1.869, 2.058, and 2.057 (P<0.05). During weeks 2-3 after treatment, the t values of the WIR, WOR, and MER at the center of the lesions were 2.461, 2.098, and 2.739 (P<0.05) and the t values of the WIR, WOR, and MER at the edge of the lesions were 2.951, 2.625, and 2.154 (P<0.05). During weeks 3-4 after treatment, the t values of the WIR, WOR, and MER at the center of the lesions were 2.584, 2.107, and 2.869 (P<0.05) and the t values of the WIR, WOR, and MER at the edge of the lesions were 2.057, 2.637, and 2.951 (P<0.05). During weeks 4-5 after treatment, the t values of the WIR, WOR, and MER at the center of the lesions were 2.894, 2.827, and 3.285 (P<0.05) and the t values of the WIR, WOR, and MER at the edge of the lesions were 3.45, 3.246, and 3.614 (P<0.05).
Full table
Full table

Full table
Full table
Full table

Full table
DWI, ADC map, and perfusion findings
In the control group, the poor outcomes included lung metastases (n=3), hilar and mediastinal lymph node metastases (n=8), and pleural effusion (n=5). In contrast, no metastatic lesion was found in the treatment group.
In the treatment group, the ADC values at the centers of tumor lesions remained unchanged in weeks 0-2 and gradually increased in weeks 2-5; in addition, the ADC values at the edges of tumor lesions remained unchanged in weeks 0-2 and remarkably increased in weeks 2-5. In the control group, along with the enlargement of the tumors, the DWI signals increased and the ADC signals decreased at the edges of the tumor lesions, whereas the DWI signals slightly decreased and the ADC signals slightly increased at the centers of the lesions; in addition, the ADC values at the centers of tumor lesions remained unchanged in weeks 0-2 and gradually increased in weeks 2-5, whereas the ADC values at the edges of tumor lesions gradually declined in weeks 2-5 (Figure 2). After the radiotherapy (5,000 cGy), the tumors remarkably shrank, along with low signal on DWI, decreased signal on ADC map, and remarkably increased ADC values (Figure 3A,B).
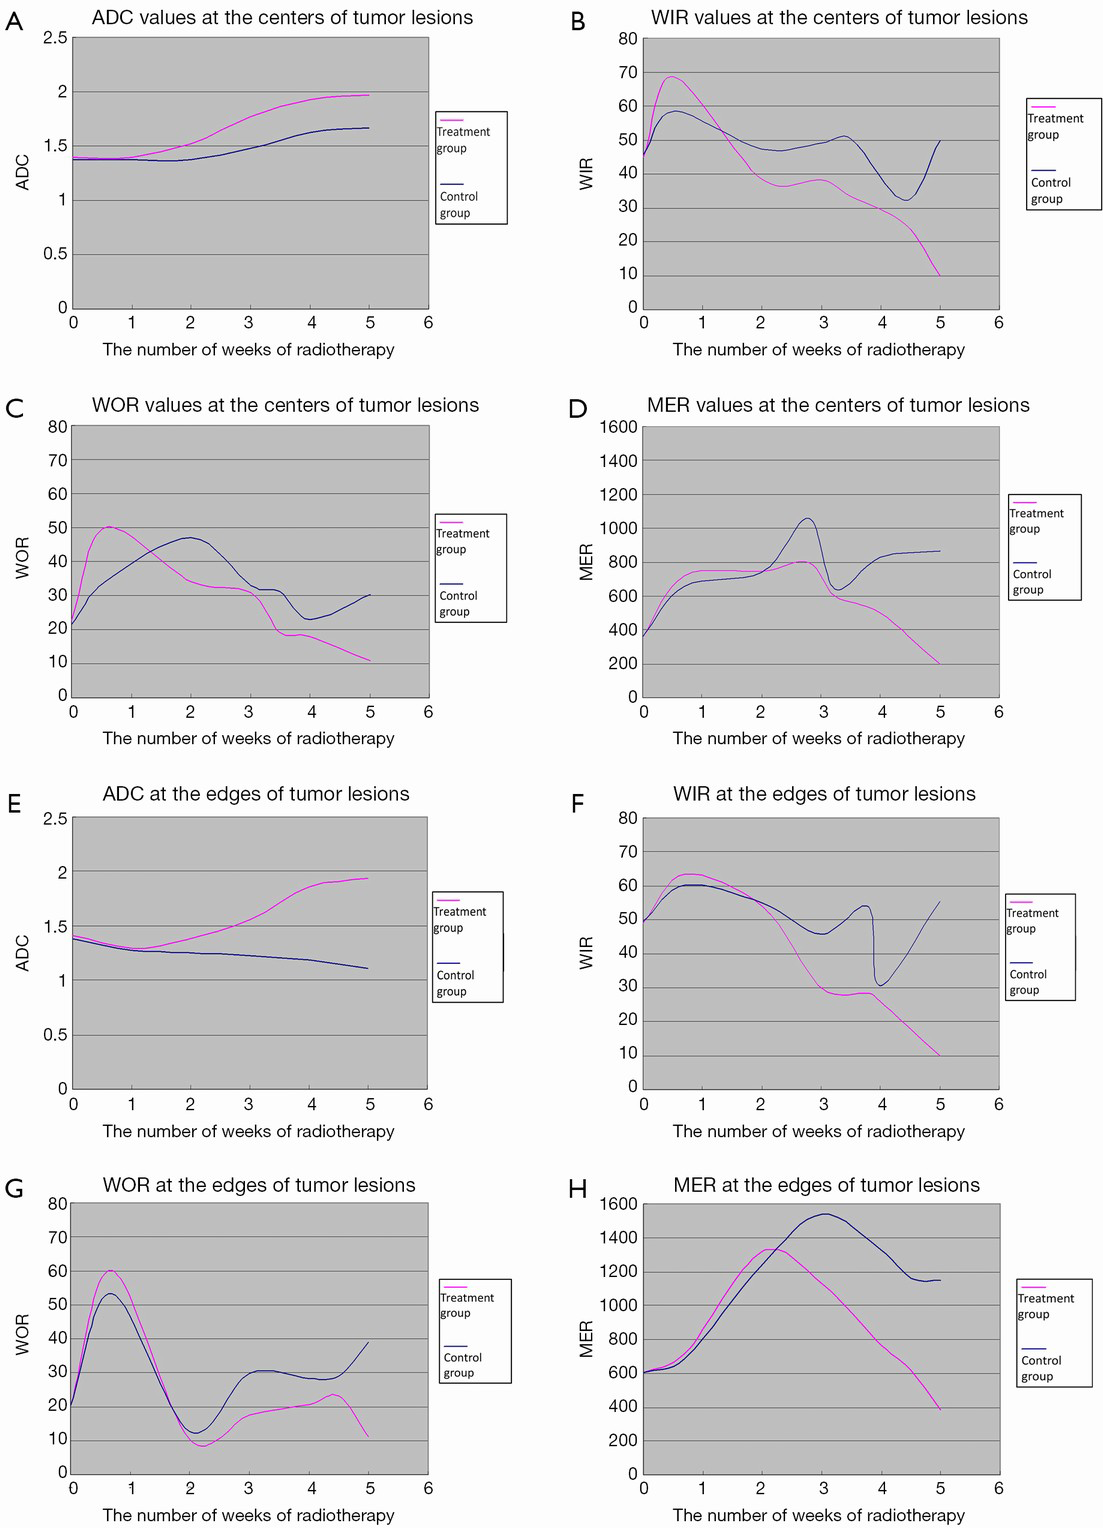
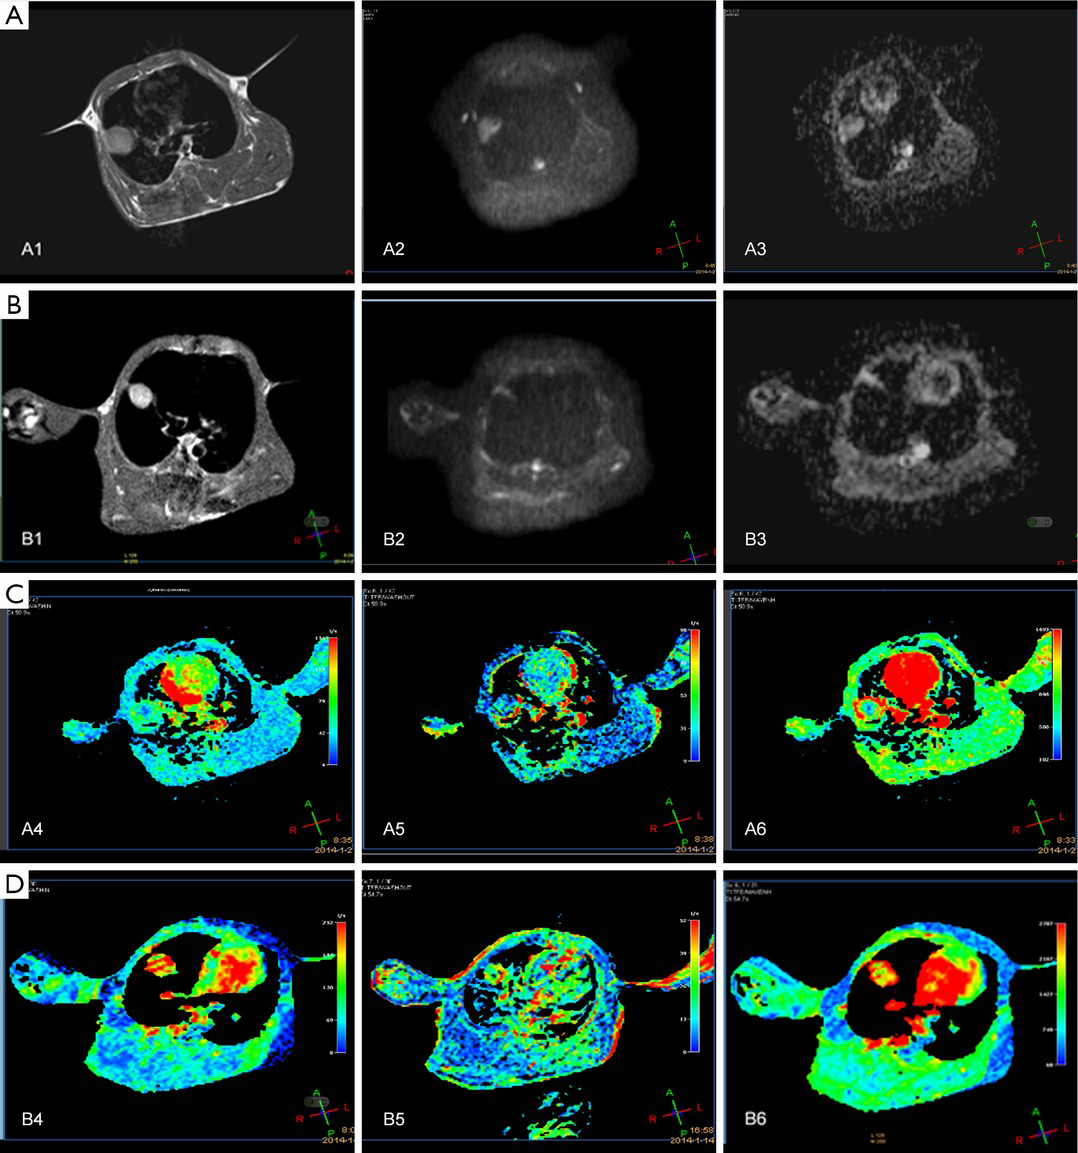
In the treatment group, the WIR and WOR at the centers of tumor lesions rapidly rose in weeks 0-1, declined in weeks 1-4, and reached the lowest levels in weeks 4-5; in addition, MER rose in weeks 0-3 and declined in weeks 3-5. At the edges of tumor lesions, the WIR rose in weeks 0-1 and declined in weeks 1-5; the WOR rapidly increased in weeks 0-1, rapidly decreased in weeks 1-2, and slowly declined in weeks 2-5; in addition, MER rose in weeks 0-2 and rapidly declined and reached its lowest level in weeks 3-5. In the control group, the WIR at the centers of tumor lesions increased in weeks 0-3, decreased in weeks 3-4, and rapidly increased in week 4-5; WOR rose in weeks 0-1, slowly declined in weeks 2-4, and increased in weeks 4-5; in addition, MER remarkably rose in weeks 0-3, rapidly declined in weeks 3-4, and rose in weeks 4-5. At the edges of tumor lesions, the WIR remained unchanged in weeks 1-4, rapidly declined in week 4, and rapidly increased in weeks 1-5; the WOR rapidly increased in weeks 0-1, rapidly decreased in weeks 1-2, and increased in weeks 2-5; finally, MER rose in weeks 0-3 and declined in weeks 3-5 (Figure 2). In the treatment group, the tumors shrank on the T1WI, WIR, WOR, and MER after the radiotherapy (5,000 cGy) (Figure 3C,D).
Immunohistochemical determination of VEGF
In 56 rabbit models with implanted pulmonary VX-2 carcinoma, immunohistochemical determination of VEGF showed highly positive (3+) results at the edge of tumor lesions and moderately positive (2+) results at the centers of tumor lesions in the control group (Figure 4A,B); in the treatment group, notably, immunohistochemical determination of VEGF showed slightly positive (+) results at the edge of tumor lesions and negative (–) results at the centers of tumor lesions (Figure 4C,D).

Discussion
In Zhang et al.’s (16,17) study on comparing differences in CT perfusion imaging (CTPI) between rabbits inoculated with VX2 lung tumor and patients with squamous cell carcinoma of the lung, they found that these two tumors had the same morphological findings on CT images and similar blood perfusion parameters; meanwhile, the CTPI and PWI parameters also differed at the different stages of tumor growth. Lyng et al. (18) in their animal study also found that there was a significant correlation between the ADC of the viable tissue and cell density. In our current study, we found that, in the control group, when the ADC values were 1.386±0.347 at the centers of tumor lesions and 1.257±0.149 at the edges, the tumor cell density increased, fraction of intratumoral vessels increased, WIR, WOR, and MER rapidly rose, DWI showed high signals, and ADC map showed low signals. The enlarged tumors could cause ischemia, liquefaction, and necrosis at the tumor center; when the ADC values were 1.625±0.361, the DWI signals declined, ADC signals increased, ADC value increased, and WIR, WOR, and MER declined.
Due to its infiltrative growth pattern, the tumors have incomplete envelope; meanwhile, they have relatively large gaps among the endothelial cells due to the elevated intra-tumor osmotic pressure. The blood perfusion increases in tumors with higher malignancies. Enhancement and blood perfusion can also be seen in the hilar and mediastinal metastatic lymph nodes (19). According to Zhang et al. (17), along with the growth of tumors, the intra-tumor pressure increased, WOR rose, and metastasis could easily occur after the tumor tissues invaded the surrounding vescular and lymphatic vessels. In the control group of our current study, the WIR, WOR, and MER rapidly rose when the ADC values at the edges of tumor lesions were 1.149±0.172, and the poor outcomes included lung metastases (n=3), hilar and mediastinal lymph node metastases (n=8), and pleural effusion (n=5).
Currently, the Response Evaluation Criteria in Solid Tumors (RECIST) has been widely adopted (20). After the application of certain treatment, the tumor tissue and its hemodynamics have also changed before significant morphological changes; thus, the response evaluation should also be based on the changes in cells and tissues and their hemodynamics.
According to De Keyzer et al. (21), response to treatment is mainly manifested by the increase of the necrotic tissues inside the tumor and the decrease of blood perfusion. Determination of these parameters enables the quantitative analysis of tissue blood supply. A clear understanding of the changes in the hemodynamic parameters helps us to objectively evaluate the microcirculation and neovascularization in tumors and their early response to treatment (22-24). Hermans et al. (25) found more hypoxic cells in tumors with low perfusion rate. These cells are not sensitive to radiotherapy; as a result, the tumors are less responsive to radiotherapy. Tumors with rich blood vessels have higher oxygen content, and thus are more responsive to radiotherapy (26). In the treatment group of our current experiment, the tumor tissues with rich blood supply had more remarkable decline of DWI signals after radiotherapy; meanwhile, the ADC signals obviously increased, ADC values increased, and WIR, WOR, and MER gradually decreased.
Also in our treatment group, the PWI parameters in the centers and edges of the tumor lesions increased in weeks 0-1. De Keyzer et al. (21) evaluated the role of single-dose radiotherapy in rat models with rhabdomyosarcoma using MR-DWI, and also found that the DWI parameters slightly increased after the radiotherapy, which represents the vascular response to the treatment. Radiotherapy can lead to thrombosis of the blood vessels and stenosis or occlusion of the vascular lumen inside tumors, causing the decline in tumor perfusion parameters (27,28). In the treatment group of our current study, the WIR and WOR at the centers of tumor lesions and the WIR at the edges of tumor lesions dramatically decreased in weeks 1-5; due to the rapid decrease of WOR at the edges of tumor lesions, the intra-tumor blood volume relatively increased and thus the MER rose. In the control group, the MER at the centers and edges of the tumor lesions rapidly increased in weeks 2-3, which was believed to be associated with the increased MVD amount during the development of tumors.
Since radiotherapy has obvious side effects and complications, tailored treatment is particularly important, as well the post-treatment response evaluation. In the treatment group of our current study, tumor cell necrosis did not occur at the centers and edges of tumor lesions until the radiation dosage reached 3,000 cGy, and the ADC values at the centers and edges of tumor lesions obviously increased in weeks 3-5. Therefore, PWI is more sensitive than DWI in evaluating the early treatment response. Also in our study, when the overall radiation dosage reached 5,000 cGy, the T1WI, WIR, WOR, and MER decreased, the PWI parameters gradually declined and reached their lowest levels, the tumor remarkably shrank on DWI and ADC maps, the DWI signals decreased, the ADC signals increased, the ADC map signals increased, the ADC values obviously increased, the tumors showed massive necrosis, and the cellular activities dramatically disappeared, indicating that DWI is more accurate in predicting the later outcomes. The tumors shrink and the activity of tumor cells decreased or disappeared during the radiotherapy, which emphasizes the important of accurate localization and resetting, so as to minimize the radiotherapy-associated side effects and the decreased immunity and protection in the normal tissues. In tumors without sufficient blood supply, the tumors are mainly composed of hypoxic cells, which are relatively not sensitive to radiotherapy. Thus, caution should be taken when selecting treatment mode to avoid excessive treatment.
Conclusions
In conclusion, during the treatment of tumors, the judgment of early response and the evaluation of late efficacies are particularly important, among which the cellular activity and blood flow of the tumors are key information for decision-making. As non-invasive approaches, MR-DWI and MR-PWI provide indirect ways for evaluating the cellular activity and angiogenesis, which can reflect the “real world” biological status of the tissues.
Acknowledgements
Disclosure: The authors declare no conflict of interest.
References
- Siegel R, Naishadham D, Jemal A. Cancer statistics, 2012. CA Cancer J Clin 2012;62:10-29. [PubMed]
- Siegel R, Naishadham D, Jemal A. Cancer statistics, 2013. CA Cancer J Clin 2013;63:11-30. [PubMed]
- Walters S, Maringe C, Coleman MP, et al. Lung cancer survival and stage at diagnosis in Australia, Canada, Denmark, Norway, Sweden and the UK: a population-based study, 2004-2007. Thorax 2013;68:551-64. [PubMed]
- Yuan YH, Xiao EH, Liu JB, et al. Gene expression and MR diffusion-weighted imaging after chemoembolization in rabbit liver VX-2 tumor model. World J Gastroenterol 2008;14:5557-63. [PubMed]
- Wasser K, Klein SK, Fink C, et al. Evaluation of neoadjuvant chemotherapeutic response of breast cancer using dynamic MRI with high temporal resolution. Eur Radiol 2003;13:80-7. [PubMed]
- Neeman M, Dafni H, Bukhari O, et al. In vivo BOLD contrast MRI mapping of subcutaneous vascular function and maturation: validation by intravital microscopy. Magn Reson Med 2001;45:887-98. [PubMed]
- Folkman J, Shing Y. Angiogenesis. J Biol Chem 1992;267:10931-4. [PubMed]
- Weidner N, Semple JP, Welch WR, et al. Tumor angiogenesis and metastasis--correlation in invasive breast carcinoma. N Engl J Med 1991;324:1-8. [PubMed]
- Weidner N. Intratumor microvessel density as a prognostic factor in cancer. Am J Pathol 1995;147:9-19. [PubMed]
- Holash J, Maisonpierre PC, Compton D, et al. Vessel cooption, regression, and growth in tumors mediated by angiopoietins and VEGF. Science 1999;284:1994-8. [PubMed]
- Veikkola T, Karkkainen M, Claesson-Welsh L, et al. Regulation of angiogenesis via vascular endothelial growth factor receptors. Cancer Res 2000;60:203-12. [PubMed]
- Robinson SP, Rijken PF, Howe FA, et al. Tumor vascular architecture and function evaluated by non-invasive susceptibility MRI methods and immunohistochemistry. J Magn Reson Imaging 2003;17:445-54. [PubMed]
- Vitellas KM, Tzalonikou MT, Bennett WF, et al. Cirrhosis: spectrum of findings on unenhanced and dynamic gadolinium-enhanced MR imaging. Abdom Imaging 2001;26:601-15. [PubMed]
- Kuhl CK, Bieling H, Gieseke J, et al. Breast neoplasms: T2* susceptibility-contrast, first-pass perfusion MR imaging. Radiology 1997;202:87-95. [PubMed]
- Verstraete KL, Vanzieleghem B, De Deene Y, et al. Static, dynamic and first-pass MR imaging of musculoskeletal lesions using gadodiamide injection. Acta Radiol 1995;36:27-36. [PubMed]
- Zhang Q, Shi QB, Liu ZX, et al. A controlled study on comparing differences in CT perfusion imaging between rabbits inoculated with VX2 lung tumor and patients with squamous cell carcinoma of the lung. J Cancer Res Clin Oncol 2010;7:366-72.
- Zhang Q, Shi B, Liu Z, et al. Preliminary study of CT in combination with MRI perfusion imaging to assess hemodynamic changes during angiogenesis in a rabbit model of lung cancer. Onco Targets Ther 2013;6:685-92. [PubMed]
- Lyng H, Haraldseth O, Rofstad EK. Measurement of cell density and necrotic fraction in human melanoma xenografts by diffusion weighted magnetic resonance imaging. Magn Reson Med 2000;43:828-36. [PubMed]
- Zhang Q, Guo J, Qian H, et al. Studies on lung cancer angiogenesis-application of interventional therapy (a report of 56 cases). J Cancer Res Clin Oncol 2007;4:61-4.
- Duffaud F, Therasse P. New guidelines to evaluate the response to treatment in solid tumors. Bull Cancer 2000;87:881-6. [PubMed]
- De Keyzer F, Vandecaveye V, Thoeny H, et al. Dynamic contrast-enhanced and diffusion-weighted MRI for early detection of tumoral changes in single-dose and fractionated radiotherapy: evaluation in a rat rhabdomyosarcoma model. Eur Radiol 2009;19:2663-71. [PubMed]
- Zhou H, Zhang M, Xiao S, et al. Dynamic contrast-enhanced computed tomography functional imaging for the evaluation of tumor angiogenesis in patients with lung carcinoma. Chin J Radiol 2006;40:171-5.
- Zhang JF, Wang RF, Wu J, et al. Investigation of Multi-Slice Spiral CT (MSCT) Perfusion Imaging before and after Transcatheter Arterial Embolization (TAE)in VX2 Soft-Tissue Tumor of Rabbit. Radiologic Practice 2005;(2):110-3.
- Sahani DV, Kalva SP, Hamberg LM, et al. Assessing tumor perfusion and treatment response in rectal cancer with multisection CT: initial observations. Radiology 2005;234:785-92. [PubMed]
- Hermans R, Lambin P, Van den Bogaert W, et al. Non-invasive tumour perfusion measurement by dynamic CT: preliminary results. Radiother Oncol 1997;44:159-62. [PubMed]
- Harvey CJ, Blomley MJ, Dawson P, et al. Functional CT imaging of the acute hyperemic response to radiation therapy of the prostate gland: early experience. J Comput Assist Tomogr 2001;25:43-9. [PubMed]
- Hallahan DE, Virudachalam S. Ionizing radiation mediates expression of cell adhesion molecules in distinct histological patterns within the lung. Cancer Res 1997;57:2096-9. [PubMed]
- Hallahan D, Kuchibhotla J, Wyble C. Cell adhesion molecules mediate radiation-induced leukocyte adhesion to the vascular endothelium. Cancer Res 1996;56:5150-5. [PubMed]