
Clinical significance of stanniocalcin expression in tissue and serum of gastric cancer patients
Background
Gastric cancer (GC) is one of the most lethal common cancers, with a 5-year overall survival rate of less than 35% and more than 750,000 deaths annually worldwide (1). In China, the mean annual mortality of GC is estimated to be as high as 16 per 100,000 people and accounts for a large percentage of the cancer-related deaths (2). Despite of the widely-used endoscopic screening technology, most of these patients are diagnosed with localized disease. It greatly limited the options for curative resections and resulted in a poor survival. Therefore, it is crucial to develop more effective screening methods to enable the early detection and better prediction of the disease. Molecular markers, including microRNAs, DNA methylation and circulating tumor cells, may provide an alternative approach to improve the diagnosis, prognosis, and guidance of adjuvant treatments of GC (3,4).
Stanniocalcin (STC), which was initially discovered in the corpuscles of Stannius of bony fish, was a kind of secreted, homodimeric glycoprotein implicated in the physiology of phosphate regulation, metabolism, reproduction, stress response and development (5). Two main members of this family, STC1 and STC2, have been found to be notably altered in a variety of cancers, suggesting the potential roles in tumorigenesis. High expression of STC1 was frequently detected in human tumor samples of colorectal cancers (6), hepatocelluar carcinomas (7), non-small cell lung cancer (8), ovarian cancer (9), breast carcinoma (10) and leukemia (11). In addition to STC1 profiling, the aberrant expression of STC2 has also been found in neuroblastomas (12), castration-resistant prostate cancers (13), breast cancer (10), colorectal cancer (14), esophageal squamous-cell cancer (15) and renal cell carcinomas (16), implying that STCs might act as potential cancer biomarkers. Furthermore, the relative mRNA expression of STC1 and STC2 had been reported to be higher in blood specimens from GC patients than that from healthy volunteers (17,18). Therefore, to further explore the precise role of STCs for GC diagnosis and prognosis, we detected STC1 and STC2 protein expression in GC tissue and serum samples.
Materials and methods
Study population
This study enrolled 83 GC patients who suffering from primary GC underwent operation at our institutes from July 2008 to July 2010. Patients consisted of 48 males and 35 females, with a median age of 58 (range, 44-83) years. Tumor stage was conducted according to the 2010 tumor node metastasis (TNM) classification of malignant tumors by the American Joint Committee on Cancer (AJCC), and patients were at stages I (n=8), II (n=23), III (n=45) and IV (n=7). Cellular differentiation was graded according to the WHO grading system. All patients were naive to surgery, none received neoadjuvant chemotherapy or radiotherapy. Ethical approval was obtained from the hospital and informed consent was obtained from all patients prior to sample examination. Clinical follow-up data were available for all the patients. For each patient, 5 mL peripheral blood pre-operation and post-operation (7-10 days) were collected by promoting coagulation tubes, then serum samples were isolated at 3,000 rpm for 5 min, and stored at –80 °C. Serum samples from 40 patients with benign gastric disease (20 cases of chronic gastritis, 20 cases of gastric ulcer) were also collected.
Immunohistochemical staining
Formalin-fixed, paraffin-embedded cancer samples and their adjacent normal tissues (>5 cm away from the tumor) used for immunohistochemistry were sectioned at 2 µm thickness. Sections were deparaffinized using xylene, dehydrated by gradient ethanol, and then rehydrated with deionized water. Heat-mediated antigen retrieval was run by autoclave treatment [120 °C for 2 min in 1 mmol/L ethylenediaminetetraacetic acid (EDTA), pH of 8.0] and then followed by cooling at room temperature. Incubation with a polyclonal goat anti-STC1 antibody (diluted 1:200, Santa Cruz Biotechnology, CA, USA) or mouse monoclonal anti-STC2 antibody (diluted 1:50, Abnova, Taipei City, Taiwan, China) was performed overnight at 4 °C according to previous reports (9,19). The specificity of the antibodies was verified by Western bloting (Figure 1). After washing with phosphate-buffered saline (PBS), sections were then incubated with secondary antibody for 30 min at room temperature. Coloration was performed with 3,3-diaminobenzidine. Nuclei were counterstained with hematoxylin. PBS was used as a negative control for the staining reactions. The percentage of positive cells was rated as follows: 0 score for 0-5%, 1 score for 6-25%, 2 scores for 26-50%, and 3 scores for more than 50%. The staining intensity was rated as follows: 0 score for no staining, 1 score for weak staining, 2 scores for moderate staining, and 3 scores for strong staining (20). The scores from the percentage and intensity were added to an overall score, and the expression of STC1 protein in GC with an overall score of 0 was designated as ‘negative’, 1-2 was designated as ‘low’, 3-4 was designated as ‘moderate’ and 5-6 was designated as ‘high’.

STCs determination in serum
Serum STCs levels were determined via enzyme-linked immunosorbent assay (ELISA) in duplicate, using the DuoSet ELISA kit (R&D Systems, Minneapolis, MN, USA) according to the manufacturer’s instructions. In brief, high-binding, flat-bottom 96-well polypropylene plates were coated overnight at ambient temperature with 100 µL of goat anti-human STC1 or mouse anti-human STC2 antibody (800 ng/mL). The plate was washed three times with PBS containing 0.05% Tween-20 and blocked with PBS containing 0.5% bovine serum albumin for 2 hours. Either 100 µL of a sample or 100 µL of a diluted STCs standard (31.25-2,000 pg/mL; seven dilutions) was added per well. After 2 hours of incubation at room temperature and three washes with PBS containing 0.05% Tween-20, the plate was treated with a second biotinylated antibody (400 ng/mL) for 2 hours and then a solution of streptavidin conjugated to horseradish peroxidase (1:200 dilution) was added to the plates. Tetramethylbenzidine (10 mg/mL) and 1 M phosphoric acid were added in a volume of 50 µL, and the absorbance at 450 nm was determined for each well by use of a spectra reader. The serum samples were diluted 1:10 in PBS prior to detection. All assays were repeated at least three times.
Determination of CEA and CA199
The concentrations of CEA and CA199 came from patients’ routine biochemical examination on the next day after admission, which was determined using an automated immunoassay system (Elecsys 2010, Roche Diagnostics, Mannheim, Germany) according to the manufacturer’s instructions. Serum levels of CEA greater than 5.0 ng/mL and CA199 greater than 37 U/mL were considered positive.
Statistical analysis
Statistical tests were carried out using SPSS version 16.0 (SPSS Inc., Chicago, IL, USA). The differences of STCs expression between the groups were calculated with Student’s t-test. Differences in frequency were assessed by Chi-square test. Overall survival curves were calculated using the Kaplan-Meier method and compared by log-rank testing. Multivariate analysis was performed using the Cox proportional hazards regression model on all significant characteristics measured for univariate analysis (potential confounding cofactors were excluded when P>0.2 in the univariate analysis). The receiver operating characteristics (ROC) curve was constructed to describe diagnostic specificity and sensitivity. P<0.05 was taken as statistically significant.
Results
STCs protein expression profiles in GC tissue
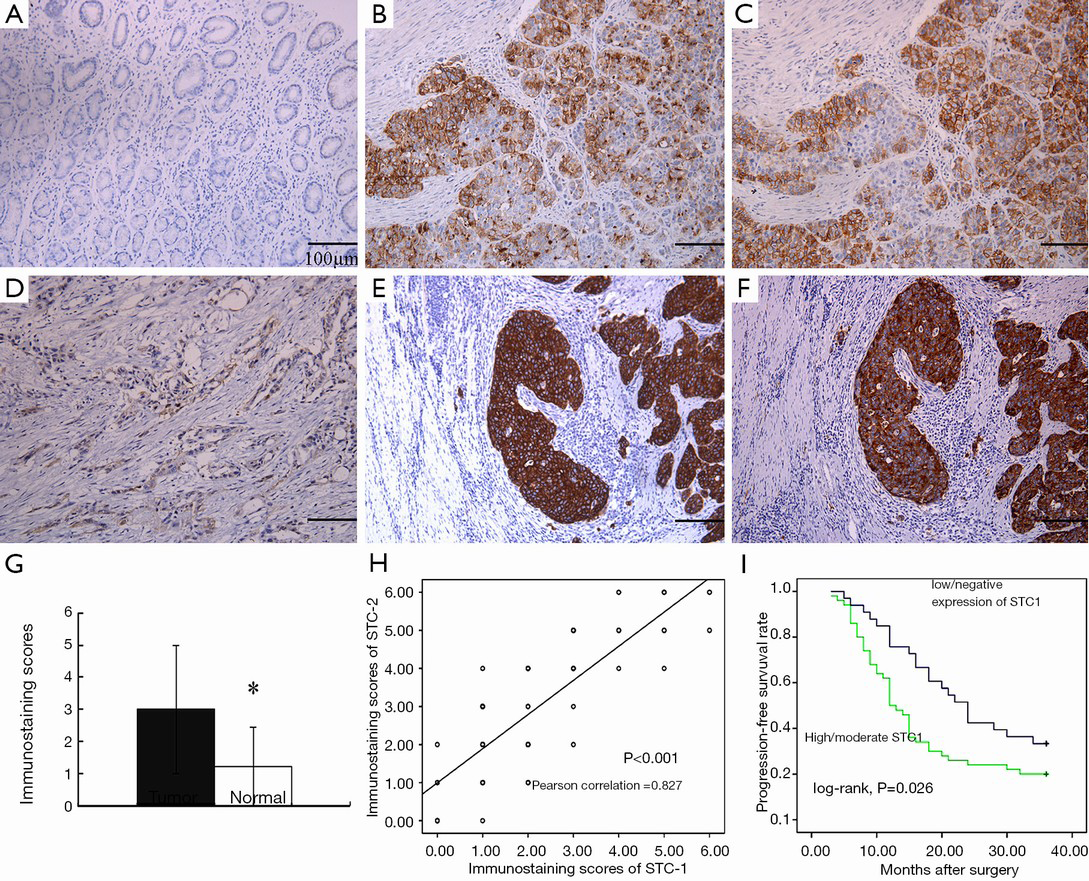
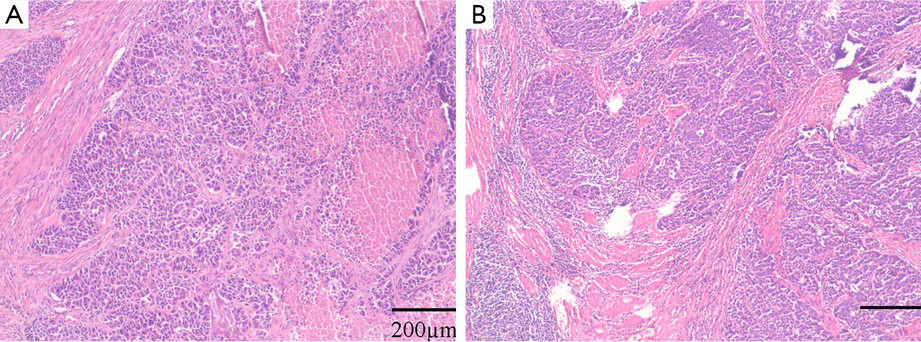
We detected STC1/2 protein expression in 83 pairs of GC and adjacent normal tissues by immunohistochemical staining, as displayed in Figure 2. Lower magnification of HE staining of the tumors are shown in Figure 3. In total, there were 64 cases (77.1%) showed a higher level of STC1 protein expression in tumor tissues than that in normal tissues. And the average immunostaining score in tumor tissues was 3.00±1.98 while in normal tissues was 1.22±1.22 (Figure 2G, P<0.001). Moreover, the rate of STC1 with high/moderate expression in GC tissues [60.2% (50/83)] significantly exceeded that in normal tissues [7.2% (6/83)]. Similar, STC2 expression was also upregulated in GC tissues in comparison with normal ones (high/moderate expression 44/83 vs. 5/83, P<0.001). In addition, STC2 protein expression profile was consistent with STC1, as shown by serial sections (Figure 2H, P<0.001).
Association between STC1 protein expression and clinicopathological features
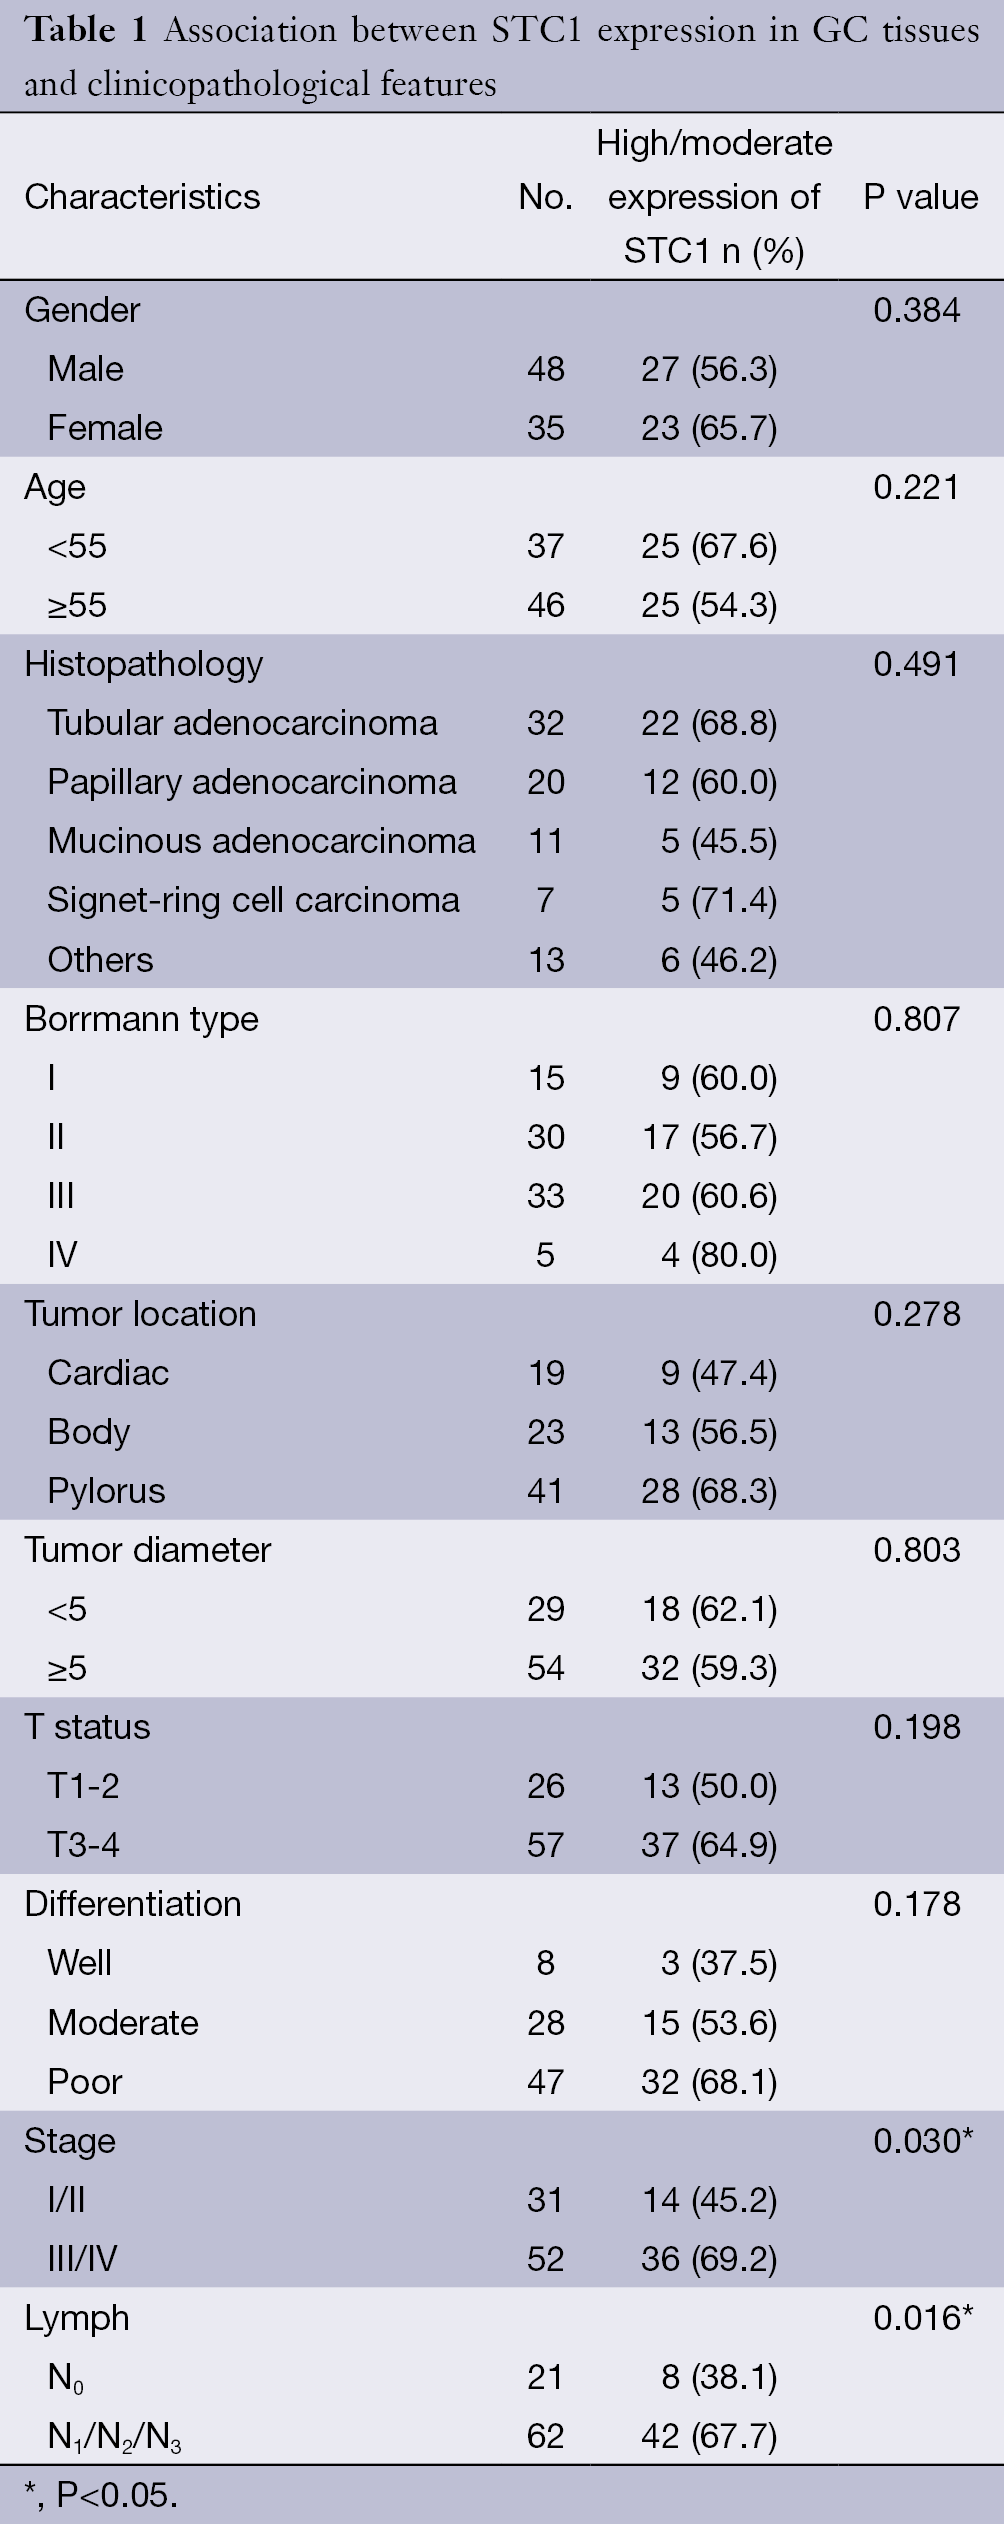
As shown in Table 1, overexpression of STC1 in GC tissues was significantly associated with lymph metastasis and clinical stage. However, there were no correlations between STC1 protein expression and patients’ gender, age, tumor location, histopathology, morphology, depth and cellular differentiation.
Full table
Association between STC1 protein expression and GC prognosis
To the follow-up deadline, there were 59 patients with progression or relapse within 3 years after successful surgery. We performed univariate survival analyses to investigate the possible prognostic role of STC1 in GC development. As reported in Figure 2I, the 3-year progression-free survival (PFS) in GC patients with high/moderate expression of STC1 was inferior to that with low/negative expression [mean 17.0 months (95% CI: 13.969-20.111) vs. 23.6 months (95% CI: 19.958-27.315), P=0.026].
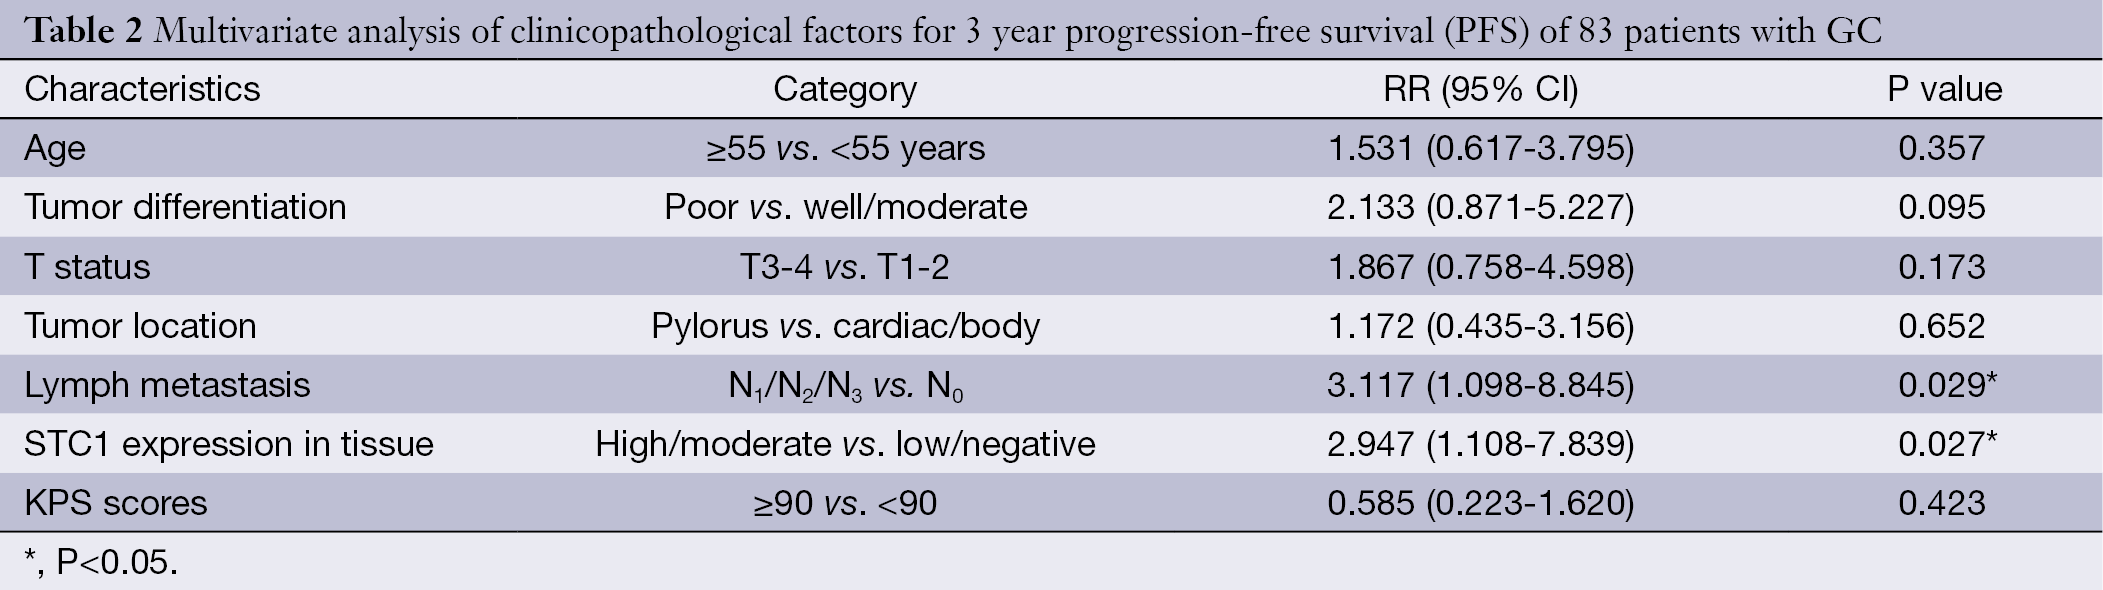
Furthermore, multiple Cox regression analysis was used to verify whether the investigated variables including STC1 expression were valid predictors of outcome after adjusting for potential confounding cofactors. Results showed that high/moderate expression of STC1 was independent factor for predicting an adverse 3-year PFS for GC patients, except for lymph metastasis (Table 2).
Full table
Serum STCs levels in pre-/post-operative GC patients
As shown in Figure 4A, serum STC1 and STC1 levels in GC patients were significantly higher than that in patients with benign gastric disease (1,599.16±613.23 vs. 676.75±292.51 pg/mL, P<0.001; 1,378.53±558.92 vs. 598.25±309.71 pg/mL, P<0.001). Severn to ten days after surgery, however, serum STC1 and STC2 levels in most GC patients were decreased to 1,059.47±449.26 and 878.14±434.25 pg/mL, respectively.

We then constructed ROC curve to describe the diagnostic specificity and sensitivity of serum STCs. The data showed that area under the curve (AUC) of STC1 and STC2 were 0.914 (95% CI: 0.850-0.957, P<0.0001) and 0.897 (95% CI: 0.829-0.944, P<0.0001), while Youden index were 0.71 and 0.59 for them (Figure 4B,C). If the cutoff value was defined as 2.1 fold of the average of negative controls, the positive expression rates of STC1 and STC2 in GC serum were 61.45% (51/83) and 56.63% (47/83), respectively, both of which exhibited superiority to conventional tumor markers CEA (42.17%, 35/83) and CA19-9 (36.14%, 30/83) (Figure 4D).
Discussion
As one of glycoprotein hormones, STC was first found in bony fish and later in humans and mammals, with a highly conserved homology. Its primary function in fish is prevention of hypercalcemia and stimulation of phosphate reabsorption (21). In mammals, STC appears to play multiple roles in a series of biological processes, including pregnancy, lactation, angiogenesis, cerebral ischemia, oxidative stress and apoptosis (22,23). Moreover, growing evidences suggested that STC is involved in carcinogenesis (5). Both of STC1 and STC2 expression levels increased in a variety of tumor tissues and cancer cell lines (9,24,25). Recently, STC1 mRNA copies were found to be significantly upregulated in blood specimens from patients in comparison with that from healthy volunteers (17). STC1 possess a higher sensitivity than CEA and CA19-9 in GC diagnosis. Similarly, the numbers of STC2 mRNA copies were greatly increased in the GC cell lines, blood samples and tumor tissues (18,19). Furthermore, both of STC1 and STC2 expression in peripheral blood were positively related to the depth of tumor invasion and tumor stage. These results suggest that STC may be a useful tumor marker for GC. In fact, an application of serum STC1 and STC2 as diagnostic and prognostic biomarkers had been validated in a series types of cancer, including breast (26), lung (27), esophageal (8), colorectal cancer (6), hepatocellular carcinoma (6) and leukemia (11).
In concordance with previous studies, we found that the expression status of STC1 and STC2 expression in GC tissues were much higher than that in matched normal tissues, which further confirmed STC as a promising tumor marker for GC. Interestingly, the expression of STC1 and STC2 is consistent with each other, suggesting that they are subject to the same regulatory mechanisms in the development of GC. Elevated expression level of STC1 was also found to be associated with lymph metastasis, clinical stage and adverse 3-year PFS. Our results indicated that STC dysfunction might play important roles in GC development in the Chinese population.
Currently, the most important conventional prognostic factors for GC are the invasion depth, lymph metastasis and distant metastasis at the time of diagnosis (pTNM), which largely determines the treatment plan. However, the actual outcome of the disease is not entirely decided by these clinicopathological parameters. The fact that ones at early stages might suffer a metastatic recurrence soon after initial treatments whereas others at advanced stages could enjoy a long-term survival, probably due to the different molecular biology characteristics of their tumors (28). Thus, over decades investigators were seeking for efficient molecular markers for GC, but few can be applied in the peripheral blood detection. Existing evidences have pointed to advantages of protein markers over PCR-based mRNA detection, such as relative stability and convenient handling. In the present study, we found both of serum STC1 and STC2 protein in GC patients were significantly higher than that in patients with benign gastric disease, with a satisfied diagnostic efficacy according to ROC curve. The sensitivity of STC protein was markedly superior to conventional markers CEA and CA19-9. Furthermore, serum STC1 and STC2 levels in most GC patients were decreased at seven to ten days after surgery. The decrease of serum STC level after surgery might due to tumor load reduction, since STC is mostly secreted by tumor cells. Conversely, its raised level during a certain period may be related to tumor recurrence or progression. These results suggested that serum STC protein was a potential tumor biomarker for diagnosing or monitoring GC, which should be validated by long-term follow-up data in the future.
However, biological functions and correlated mechanisms of STC in cancer progression have not been fully elucidated. Previous studies revealed that STC regulated calcium and phosphate homeostasis and activated a series of intracellular signals for tumor cell proliferation, invasion and metastasis. STC overexpression in tumor cells indicates the high metabolic demand of phosphorus, which is an important feature of aerobic glycolysis (29), thus STC upregulation in tumor cells may serve as an adaptive response to hypoxia. Because of the aberrant growth of tumor cells and poor vascularization, the tumor microenvironment tends to become hypoxic. The expression of STC1 gene was upregulated under hypoxia stress in various human cancer cell lines, and endogenous HIF-1α was a key factor in hypoxia-induced STC1 expression (30). Recently, hypoxia-responsive element in human STC1 gene has been identified (31). Similarly, positive effects of STC2 on the promotion of epithelial-mesenchymal transition (EMT) and invasiveness via the induction of reactive oxygen species (ROS) generation and the activation of MAPK/ERK signaling in hypoxic human ovarian cancer cells (32). Thus, STC may promote angiogenesis and increase hypoxia tolerance of tumor cells (33). STC1 had been reported to accelerate the growth of breast cancer cells in vitro (34) and human ovarian xenografts in vivo (9). In contrast, STC2 elicited a suppressive role on cell proliferation in breast cancer cells in vitro (35) and in neuroblastomas (12), but showed a promotional role in human gastric cell lines (25) and hypoxic human ovarian cells (36).
Conclusions
In conclusion, our study confirmed that STC1 and STC2 upregulation play important roles in GC development, and serum STC protein may be a new promising tumor marker for GC diagnosis and prognosis, but the specific mechanisms need further study.
Acknowledgements
This study was supported by Natural Science Foundation of Jiangsu Province, China (No. BK2012371). The valuable help from the Departments of Pathology of 101th Hospital of People’s Liberation Army is also greatly appreciated.
Disclosure: The authors declare no conflict of interest.
References
- Bertuccio P, Chatenoud L, Levi F, et al. Recent patterns in gastric cancer: a global overview. Int J Cancer 2009;125:666-73. [PubMed]
- Zhang H, Sun LL, Meng YL, et al. Survival trends in gastric cancer patients of Northeast China. World J Gastroenterol 2011;17:3257-62. [PubMed]
- Pietrantonio F, De Braud F, Da Prat V, et al. A review on biomarkers for prediction of treatment outcome in gastric cancer. Anticancer Res 2013;33:1257-66. [PubMed]
- Zhang Y, Ye X, Geng J, et al. Epigenetic inactivation of deleted in lung and esophageal cancer 1 gene by promoter methylation in gastric and colorectal adenocarcinoma. Hepatogastroenterology 2010;57:1614-9. [PubMed]
- Yeung BH, Law AY, Wong CK. Evolution and roles of stanniocalcin. Mol Cell Endocrinol 2012;349:272-80. [PubMed]
- Fujiwara Y, Sugita Y, Nakamori S, et al. Assessment of Stanniocalcin-1 mRNA as a molecular marker for micrometastases of various human cancers. Int J Oncol 2000;16:799-804. [PubMed]
- Tamura S, Oshima T, Yoshihara K, et al. Clinical significance of STC1 gene expression in patients with colorectal cancer. Anticancer Res 2011;31:325-9. [PubMed]
- Du YZ, Gu XH, Li L, et al. The diagnostic value of circulating stanniocalcin-1 mRNA in non-small cell lung cancer. J Surg Oncol 2011;104:836-40. [PubMed]
- Liu G, Yang G, Chang B, et al. Stanniocalcin 1 and ovarian tumorigenesis. J Natl Cancer Inst 2010;102:812-27. [PubMed]
- Joensuu K, Heikkilä P, Andersson LC. Tumor dormancy: elevated expression of stanniocalcins in late relapsing breast cancer. Cancer Lett 2008;265:76-83. [PubMed]
- Tohmiya Y, Koide Y, Fujimaki S, et al. Stanniocalcin-1 as a novel marker to detect minimal residual disease of human leukemia. Tohoku J Exp Med 2004;204:125-33. [PubMed]
- Volland S, Kugler W, Schweigerer L, et al. Stanniocalcin 2 promotes invasion and is associated with metastatic stages in neuroblastoma. Int J Cancer 2009;125:2049-57. [PubMed]
- Tamura K, Furihata M, Chung SY, et al. Stanniocalcin 2 overexpression in castration-resistant prostate cancer and aggressive prostate cancer. Cancer Sci 2009;100:914-9. [PubMed]
- Ieta K, Tanaka F, Yokobori T, et al. Clinicopathological significance of stanniocalcin 2 gene expression in colorectal cancer. Int J Cancer 2009;125:926-31. [PubMed]
- Kita Y, Mimori K, Iwatsuki M, et al. STC2: a predictive marker for lymph node metastasis in esophageal squamous-cell carcinoma. Ann Surg Oncol 2011;18:261-72. [PubMed]
- Meyer HA, Tölle A, Jung M, et al. Identification of stanniocalcin 2 as prognostic marker in renal cell carcinoma. Eur Urol 2009;55:669-78. [PubMed]
- Arigami T, Uenosono Y, Ishigami S, et al. Expression of stanniocalcin 1 as a potential biomarker of gastric cancer. Oncology 2012;83:158-64. [PubMed]
- Arigami T, Uenosono Y, Ishigami S, et al. Clinical significance of stanniocalcin 2 expression as a predictor of tumor progression in gastric cancer. Oncol Rep 2013;30:2838-44. [PubMed]
- Yokobori T, Mimori K, Ishii H, et al. Clinical significance of stanniocalcin 2 as a prognostic marker in gastric cancer. Ann Surg Oncol 2010;17:2601-7. [PubMed]
- Tong JD, Jiao NL, Wang YX, et al. Downregulation of fibulin-3 gene by promoter methylation in colorectal cancer predicts adverse prognosis. Neoplasma 2011;58:441-8. [PubMed]
- Wagner GF, Jaworski EM, Haddad M. Stanniocalcin in the seawater salmon: structure, function, and regulation. Am J Physiol 1998;274:R1177-85. [PubMed]
- Deol HK, Varghese R, Wagner GF, et al. Dynamic regulation of mouse ovarian stanniocalcin expression during gestation and lactation. Endocrinology 2000;141:3412-21. [PubMed]
- Kz Zhang. Stanniocalcin: A molecular guard of neurons during cerebral ischemia. Proc Natl Acad Sci U S A 2000;97:3637-42. [PubMed]
- McCudden CR, Majewski A, Chakrabarti S, et al. Co-localization of stanniocalcin-1 ligand and receptor in human breast carcinomas. Mol Cell Endocrinol 2004;213:167-72. [PubMed]
- Shirakawa M, Fujiwara Y, Sugita Y, et al. Assessment of stanniocalcin-1 as a prognostic marker in human esophageal squamous cell carcinoma. Oncol Rep 2012;27:940-6. [PubMed]
- Wascher RA, Huynh KT, Giuliano AE, et al. Stanniocalcin-1: a novel molecular blood and bone marrow marker for human breast cancer. Clin Cancer Res 2003;9:1427-35. [PubMed]
- Song H, Xu B, Yi J. Clinical significance of stanniocalcin-1 detected in peripheral blood and bone marrow of esophageal squamous cell carcinoma patients. J Exp Clin Cancer Res 2012;31:35. [PubMed]
- Chua TC, Merrett ND. Clinicopathologic factors associated with HER2-positive gastric cancer and its impact on survival outcomes--a systematic review. Int J Cancer 2012;130:2845-56. [PubMed]
- Ellard JP, McCudden CR, Tanega C, et al. The respiratory effects of stanniocalcin-1 (STC-1) on intact mitochondria and cells: STC-1 uncouples oxidative phosphorylation and its actions are modulated by nucleotide triphosphates. Mol Cell Endocrinol 2007;264:90-101. [PubMed]
- Yeung HY, Lai KP, Chan HY, et al. Hypoxia-inducible factor-1-mediated activation of stanniocalcin-1 in human cancer cells. Endocrinology 2005;146:4951-60. [PubMed]
- Law AY, Ching LY, Lai KP, et al. Identification and characterization of the hypoxia-responsive element in human stanniocalcin-1 gene. Mol Cell Endocrinol 2010;314:118-27. [PubMed]
- Law AY, Wong CK. Stanniocalcin-2 promotes epithelial-mesenchymal transition and invasiveness in hypoxic human ovarian cancer cells. Exp Cell Res 2010;316:3425-34. [PubMed]
- He LF, Wang TT, Gao QY, et al. Stanniocalcin-1 promotes tumor angiogenesis through up-regulation of VEGF in gastric cancer cells. J Biomed Sci 2011;18:39. [PubMed]
- Daniel AR, Lange CA. Protein kinases mediate ligand-independent derepression of sumoylated progesterone receptors in breast cancer cells. Proc Natl Acad Sci U S A 2009;106:14287-92. [PubMed]
- Raulic S, Ramos-Valdes Y, DiMattia GE. Stanniocalcin 2 expression is regulated by hormone signalling and negatively affects breast cancer cell viability in vitro. J Endocrinol 2008;197:517-29. [PubMed]
- Law AY, Lai KP, Ip CK, et al. Epigenetic and HIF-1 regulation of stanniocalcin-2 expression in human cancer cells. Exp Cell Res 2008;314:1823-30. [PubMed]