
Diffusion-tensor imaging as an adjunct to dynamic contrast-enhanced MRI for improved accuracy of differential diagnosis between breast ductal carcinoma in situ and invasive breast carcinoma
Introduction
Breast ductal carcinoma in situ (DCIS) and invasive breast carcinoma (IBC) are the common histological types of breast cancer (1). Surgery is the primary therapeutic strategy for patients with breast cancer, including DCIS and IBC. For most patients with IBC, the systemic therapy is needed in addition to surgery to control local recurrence and distant metastasis. Histopathological types were often confirmed by core needle biopsy. However, DCIS diagnosed by biopsy is invasive (2). DCIS with invasive component often suggested worse prognosis and greater danger of local recurrence. In clinical practice, the underestimation rate by biopsy or specimen sampling was reported to be between 14% and 44% (2). Some patients had to change the treatment plans, and some even lost the opportunity of neoadjuvant chemotherapy (NAC) before surgery. To identify the invasive component in DCIS, it is important to understand the different imaging features between DCIS and IBC.
Dynamic contrast-enhanced magnetic resonance imaging (DCE-MRI) is a common technique for the detection of multicentric and multifocal diseases, the diagnosis of breast tumors, staging of breast cancer and treatment evaluation because of its high sensitivity of 90-94% (3-5). However, there were still high false-negative and false-positive rates in differentiating DCIS and IBC by using DCE-MRI (2,6). Recently, many studies have shown a moderate to high degree of diagnosis capability of diffusion weighted imaging (DWI) in differentiating breast benign and malignant tumors (7). With the development of MRI technology, diffusion tensor imaging (DTI) has shown the potential in differential diagnosis of breast carcinomas with different histological types (8). In this study, we aimed to determine the value of DTI as an adjunct to DCE-MRI for improved accuracy of differential diagnosis between DCIS and IBC.
Materials and methods
Patients’ data
This study was approved by the Institutional Review Board and informed consent was obtained from all patients. From January, 2012 to August, 2012, 100 consecutive patients with high clinical suspicion of breast cancer or newly diagnosed as American College of Radiology (ACR) Breast Imaging Reporting and Data System (BI-RADS) 4-6 on ultrasound or mammography underwent DCE-MRI, DWI and DTI examinations in Beijing Cancer Hospital. Further entrance criteria were as follows: histologically proven breast cancer without any history of treatment prior to the study; DCE-MRI and diffusion images of diagnostic quality suitable for assessment by radiologists. Exclusion criteria were as follows: no histological result or lose to follow up, previous surgical excision, incomplete examination or non-diagnosable images due to artifacts or poor fat suppression.
MRI
All of the MRI was performed on a 1.5 T MR scanner (Optima, MR360; General Electric Healthcare, Beijing, China) using a dedicated phase-array-eight-channel bilateral breast receiving coil. Before administration of the contrast material, a bilateral sagittal Fat-sat T2-weighted fast-spin echo sequence was performed with the following parameters: TR =3,000-3,500 ms, TE =79 ms; field of view (FOV)= 20-24 cm; matrix size 288×192; slice thickness 4 mm with a 1-mm gap; flip angle 90°; number of excitations (NEX) =2. DWI and DTI were acquired before dynamic sequences in the axial plane.
Axial DWI twice-refocused single shot spin-echo echo planar imaging (ss-EPI) was performed with TR/TE, 6,219/88.3 ms, 3 diffusion directions, use of the diffusion gradients (25 mT/m) in the phase, read, and slice directions separately; matrix size =160×160, thickness =4 mm, FOV =34 cm, NEX =6, and b values of 0 and 1,000 s/mm2. The DTI acquisition based on single-shot EPI sequence with array spatial sensitivity encoding technique (ASSET) parallel imaging (ASSET factor =2) was performed, TR/TE =9,000/minimum, FOV =34 cm, slice thickness =3 mm, NEX =4, matrix size =128×128, and flip angle =90°. Diffusion gradients were applied in six directions with b values of 0 and 600 s/mm2, and the scan time of the DTI sequence was 4 min 21 s.
DCE-MRI was performed using an axial T1-weighted 3D fast spoiled gradient recalled echo sequence with parallel imaging (VIBRANT). The DCE-MRI scan included 1 precontrast acquisition and 5 postcontrast acquisitions after injection of 0.2 mL/kg body weight gadolinium-diethylene triamine pentacetate acid (Gd-DTPA) (Magnevist, Bayer) at a rate of 2.5 mL/s followed by a 15 mL saline flush using an power injector, TR/TE =5.3/2.5 ms, flip angle =10°, FOV =20-24 cm, slice thickness =4 mm and matrix size =256×256, and NEX =1. The dynamic images were acquired at 60, 135, 210, 285, and 360 s after injection. Axial vibrant T1WI enhancement was acquired as a delayed phase after DCE-MRI, TR =5.3 ms, TE =2.5 ms, FOV =34 cm, matrix size =416×416, NEX =0.75, and flip angle =10°.
Image analysis
All DCE-MRI intensity characteristic and morphology and kinetic features were analyzed by two radiologists (C.K. and L.Y.L., with 8 and 4 years of breast MRI experience, respectively) independently according to ACR BI-RADS MR lexicon terminology. Both of them were blinded to the histological type. If the judgement was inconsistent, the result was determined to a consensus after discussion. The analysis contents included enhancement style, initial enhancement characteristic (within 2 min after contrast injection). The kinetic curves in a rectangular region of interest (ROI, at least 9 pixels) that minimally covered the areas showing the highest signal intensity on DCE-MRI were assessed. The kinetic index referred to the maximum slope of the increase, time to peak and time signal intensity curve (TIC) pattern. The enhanced magnitude calculated in the following equation was used for evaluation of the TIC pattern of the lesion. Enhanced magnitude =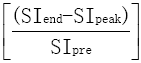 ×100% (1), SIend is the signal intensity at the end of the enhanced 5th phase, SIpeak is the highest intensity within 3 min after contrast injection and SIpre is the primary intensity before injection. An increase of the enhanced magnitude greater than 10% was defined as a persistent pattern (type I); a decrease greater than 10% was defined as a washout pattern (type III); and no increase or decrease above those values was defined as the plateau pattern (type II).
In addition, on the FS-T2W images the signal intensity (SI) of the detected enhancing lesions was evaluated, referring to the enhanced MR images. Qualitative assessment based on visual evaluation determined whether the SI of the lesion was relatively lower than, higher than, or indistinctive from that of the surrounding or contralateral normal breast tissue.
DTI and DWI image analyses were performed using Functool Microsoft on an Advantage windows 4.4 (ADW4.4) GE workstation. The lesions were identified on enhanced MRI. Technical artefacts due to patient motion or eddy current-induced distortions could produce large errors in ADC calculation. Therefore, the anatomical location of each ROI was visually cross-checked between the spatially registered reference image, b =600 s/mm2 or b =1,000 s/mm2 DWI images and postprocessing parameter maps to verify the alignment. One reader (L.Y.L.) drew the ROIs, which were confirmed by the other reader (C.K.). ROIs were drawn in the slices with the largest diameter of the lesion using 25 uniformly sized rectangular pixels. ROIs were placed in the areas showing the homogeneous abnormal hyperintensity within the lesion and should avoid contamination from fibrotic, necrotic, cystic and hemorrhagic areas. Several parameters were measured including apparent diffusion coefficient (ADC) from DWI data, the directionally-averaged mean diffusivity (Davg), the exponential attenuation (EA), fractional anisotropy (FA), relative anisotropy (RA), volume ratio (VR) and three eigenvalues λ1, λ2 and λ3 from DTI data (6). FA, VR and RA are scalar quantities that reflect the anisotropy. Their values are expressed as a numerical value between 0 and 1 without a unit. The value was close to zero, in the case of isotropic diffusion, up to a maximum of 1, indicating perfectly linear diffusion occurring only along the primary eigenvector in the voxel (9).
Statistical analysis
All of the quantitative measurements were reported as  . Categorical variables were compared between the two groups using the chi-square test. The continuous variables between two groups were compared using the independent sample t test. Multivariate logistic regression was used to identify independent factors for distinguishing IBC and DCIS. The diagnostic performance of the diagnosis equation was evaluated using the receiver operating characteristic (ROC) curve; the cut-off value was determined by maximum Youden index, Y=Sensitivity+Specificity–1. The threshold value based on ROC curve analysis was used to evaluate the differential diagnosis ability utilizing DCE-MRI, DWI and DTI alone or in combination. The sensitivity, specificity, positive predictive value (PPV), negative predictive value (NPV) and accuracy were calculated. P<0.05 was considered statistically significant. Statistical analyses were performed using SPSS (Statistical Package for Social Sciences, IBM Company, Chicago, Illinois, USA) release 16.0 for Windows.
Results
Patients who had no histological results (n=15); definitive histological result of benign (n=13) or phyllode tumor (n=2); MRI obtained after surgical excision biopsy (n=3); no obvious enhancement lesion on DCE-MRI (n=1); and serious artefact affected observation on DWI or DTI image (n=3) were excluded. Finally, a total of 63 patients (age 22-73 years, mean 50.11±10.09 years) with 64 lesions were eligible for this study. Thirteen cases of all the patients were diagnosed with DCIS by biopsy before therapy, 2 of which were confirmed with invasive carcinoma after direct surgery. The final pathological diagnosis of DCIS was mainly based on surgical specimens. The pathological diagnosis of IBC was confirmed by core needle biopsy or surgery. Clinical and pathological data are shown in Table 1.
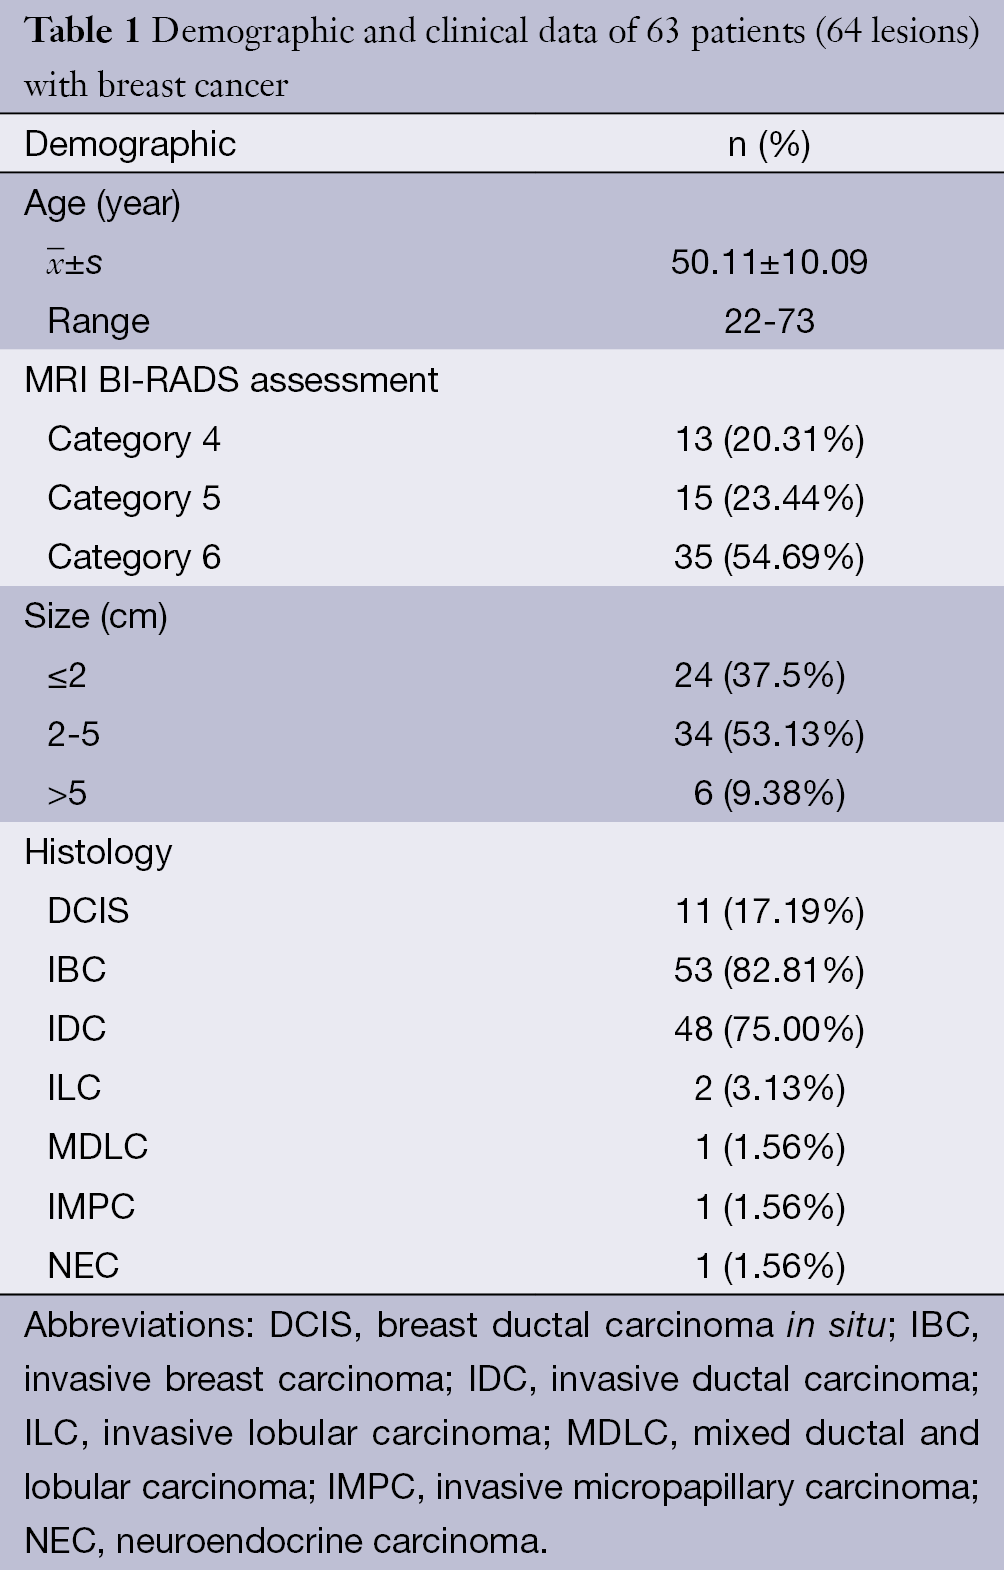
Full table
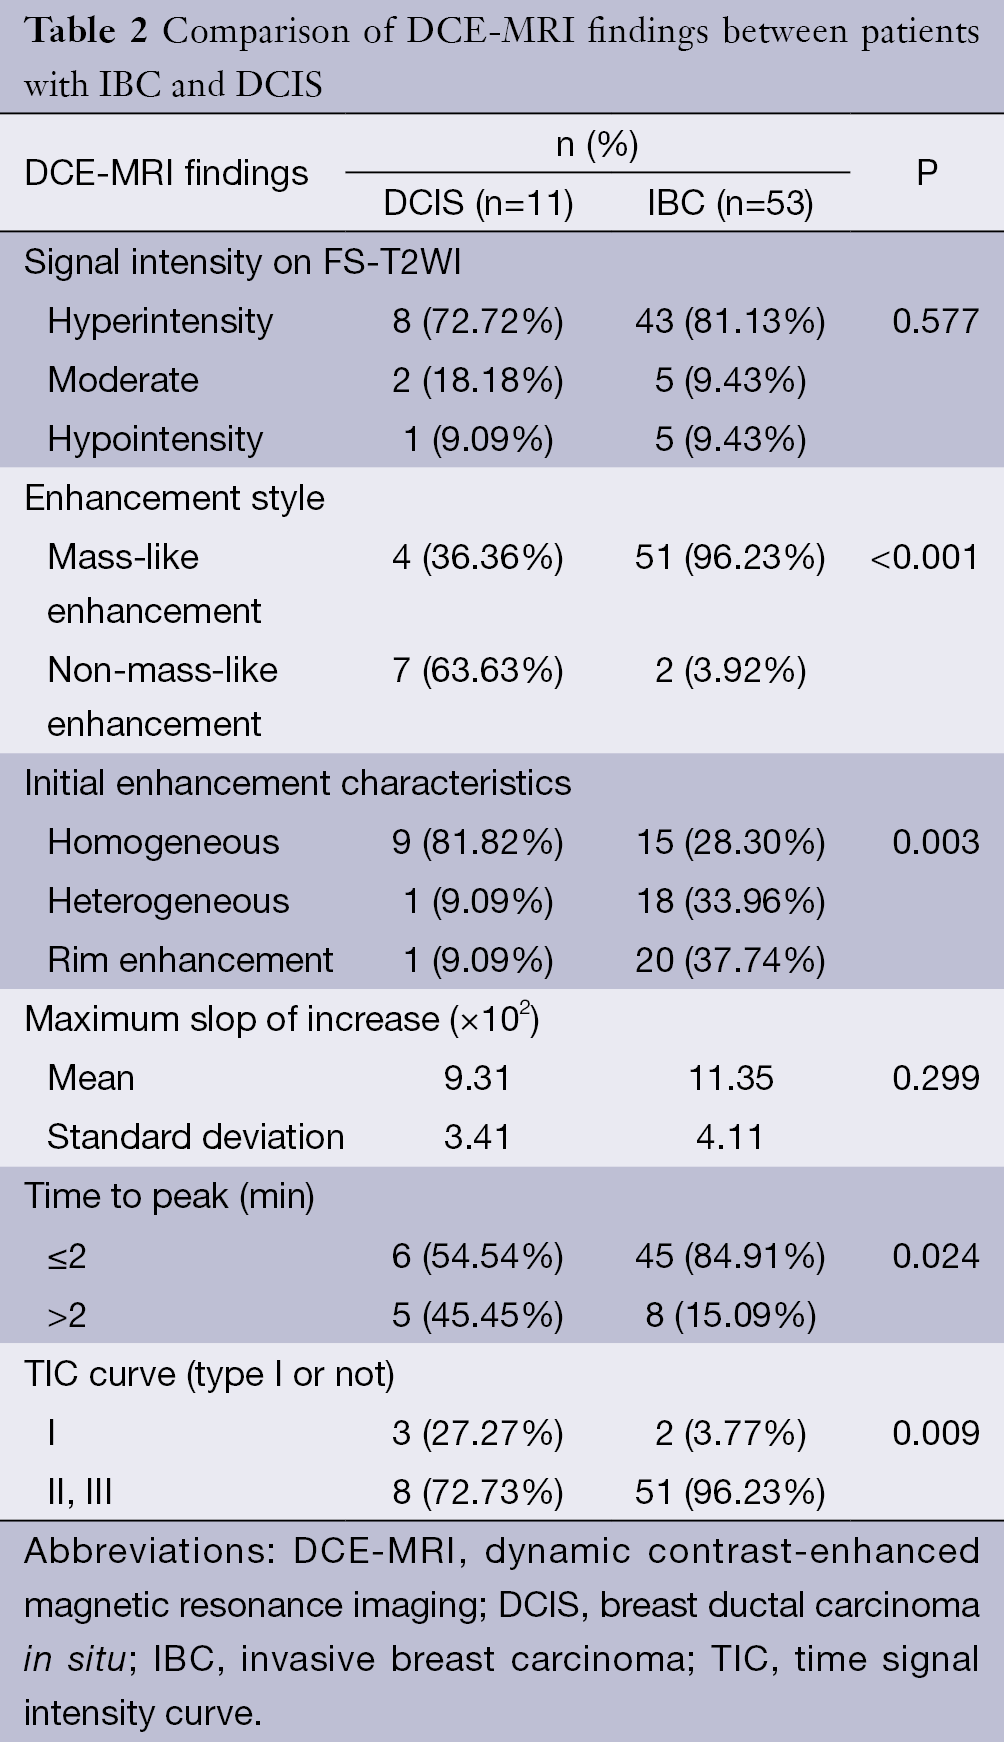
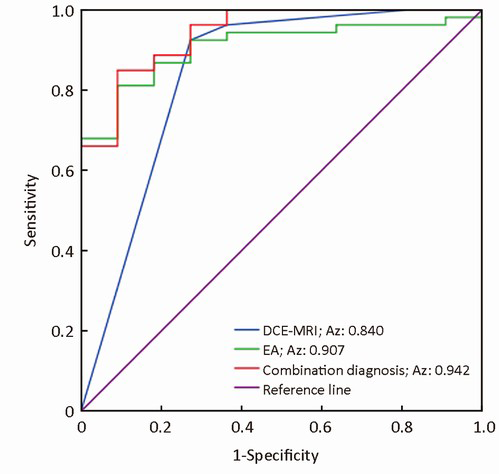
All lesions showed the suspicious enhancement on DCE-MRI. Univariate analyses of common MRI indices are summarized in Table 2. Enhancement style, initial enhancement characteristic, time to peak and TIC curve type (type I or non-type I) showed statistical significance in differentiating IBC and DCIS (P<0.05). Degree of intensity on FS-T2WI and maximum slope ratio to increase showed no difference between DCIS and IBC. Multivariate logistic regression identified enhancement style and TIC type as the independent factors in differential diagnosis of DCIS and IBC. The following diagnosis equation: Y1=3.792×enhancement style+2.242×TICtype yielded an area under the ROC curve (AUC) of 0.84 [95% confidence interval (CI), 0.67-0.99] (Figure 1). Using a cut-off value of 7, IBC was identified with a sensitivity of 92.5%, specificity of 72.7% and total accuracy of 89.1% (Table 3).
Full table

Full table
All lesions demonstrated the stronger intensity contrast to the adjacent normal parenchyma on DWI and DTI images. Comparisons of quantitative DWI and DTI parameters between DCIS and IBC are summarized in Table 4. A statistically significant difference was found in ADC, Davg and EA, between DCIS and IBCs (P≤0.001). The ADC and Davg values in DCIS were higher than IBC, and the EA value in DCIS was lower than IBC. Anisotropy metrics FA, VR and RA values showed no statistical significance in differentiating IBC from DCIS. According to the formula, EA and Davg values were highly negatively correlated.
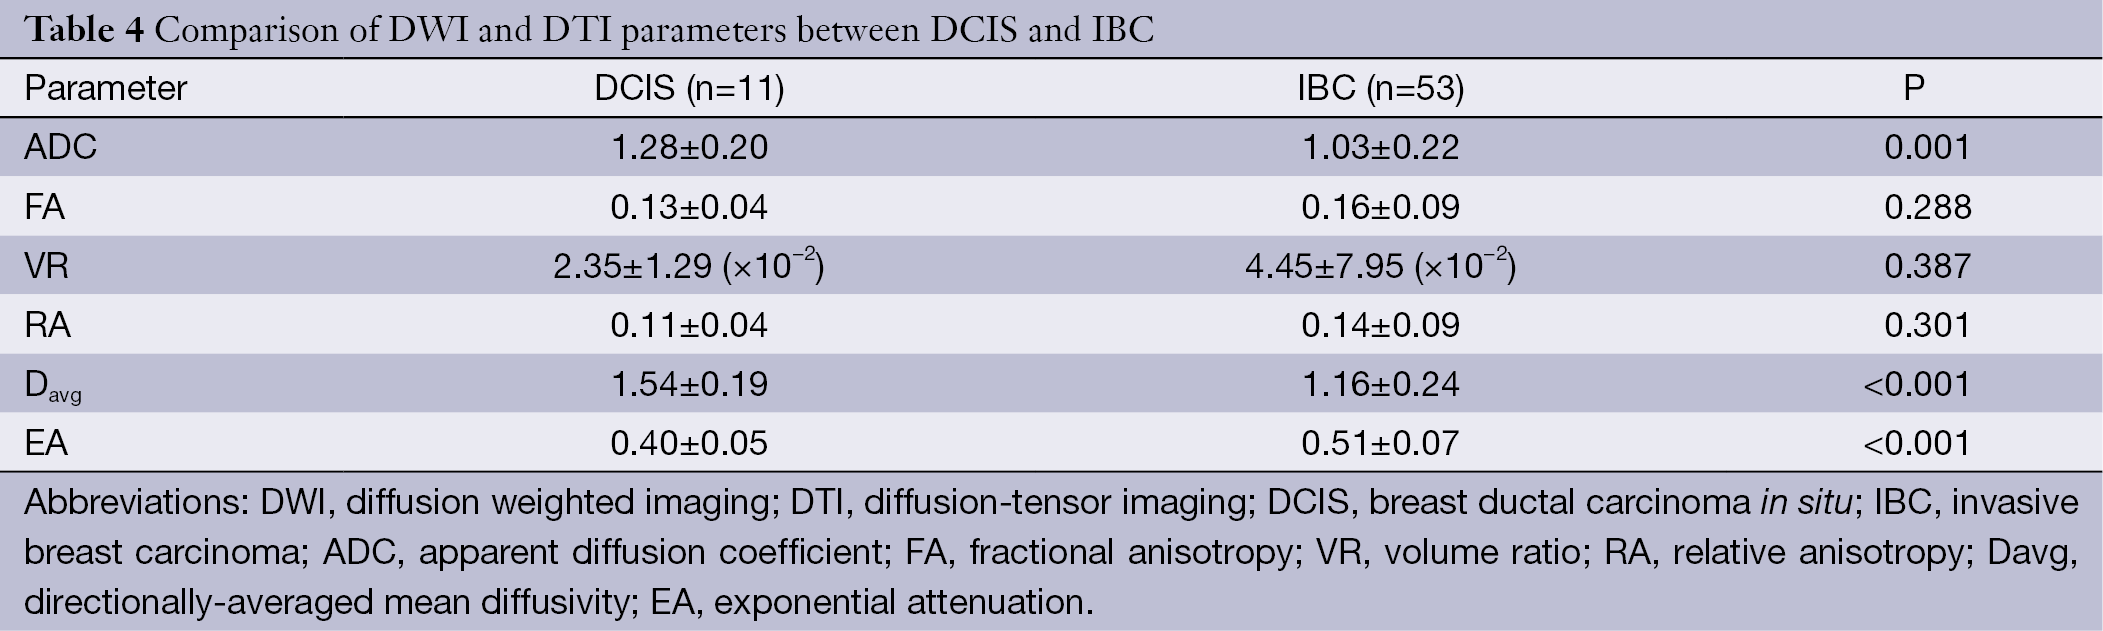
Full table
ADC value, EA value, lesion enhancement style and TIC pattern were used in multivariate logistic regression for differentiating IBC from DCIS. We identified EA value, lesion enhancement style and TIC pattern as the independent factors in differential diagnosis. The diagnostic equation was as follows: Y2=2.372× enhancement style+2.835× TIC pattern+18.376× EA value, which yielded an AUC of 0.94 (95% CI, 0.85-1.00). It suggested that the combination of DCE-MRI and DTI quantitative measurement increased the diagnostic performance of conventional DCE-MRI (P=0.02). Using a cut-off value of 13.67, IBC was identified with a sensitivity of 96.23%, specificity of 72.7% and total accuracy of 92.2% (Table 3, Figure 1).
In this study, 7 cases were misdiagnosed by DCE-MRI alone. Four false-negative cases of them were corrected by combination diagnosis of DCE-MRI and DTI; 3 false-positive cases were not corrected by combination diagnosis. Combination diagnosis erroneously identified one IBC as DCIS. In general, combination diagnosis decreased the false-negative rate from 7.55% (4/53) to 5.66% (2/53) and increased the total accuracy from 89.1% (57/64) to 92.2 (59/64).
Discussion
DCE-MRI is an established technique for the detection, diagnosis and staging of breast cancer (4). Recently, the relationship between DCE-MRI findings and the prediction of occult invasion has been analyzed to identify morphological or dynamic parameters suitable for differentiating IBC and DCIS. These studies showed the mild to moderate diagnostic performance between DCIS and IBC (2,6,10,11). In our study, multivariate logistic regression analysis identified the enhancement style and TIC curve pattern as the independent predictors for differential diagnosis between DCIS and IBC. Our results agreed with the previous reports about the comparison of MRI findings and pathological characteristics (12,13). Using conventional dynamic MRI method to differentiate DCIS and IBC, we obtained the similar moderate diagnostic performance in previous studies.
Recently, several DTI studies on the differential diagnosis of breast benign and malignant tumours have shown encouraging results (8,14,15). The univariate analysis of the present study found that IBC tends to show a lower Davg value and larger EA value than DCIS, with statistical significance. The EA value is a scaled version of Davg, both metrics revealed a difference in increased cellularity, larger nuclei with more abundant macromolecular proteins, and less extracellular space between the two breast cancers. An IBC with lower Davg and larger EA value may be explained by the fact that invasive carcinomas have a higher cellular density than DCIS and an extracellular matrix that inhibits water motion (4). On the other hand, interstitial fibrosis as a result of a desmoplastic reaction is found in the stroma of IBC; low ADC values had been confirmed in chronic renal failure (16,17). Our Davg value was comparable with the results of a breast DTI study (8). The EA value was the exponential form of Davg. In previous studies, the EA algorithm maps were thought to be more compatible with daily routine than the calculation of ADC values (18-20). Based on our results, we proposed that the EA not only had the similar ability reflecting the biological nature of the lesion compared with Davg, but also had narrower interval overlaps between the two entities and was easier to use.
Multivariate regression analysis identified the enhancement style, TIC curve pattern and EA value as the independent factors to distinguish IBC and DCIS. Combination diagnosis using DCE-MRI and DTI yielded an increased AUC of 0.942 and a higher accuracy of 92.2% in differential diagnosis than a single use of DCE-MRI. Although the performance of DWI and DTI showed no difference in differential diagnosis, we can see the increasing tendency of sensitivity, specificity, PPV, NPV and accuracy from DWI to DTI. DTI with more diffusion sensitivity gradient directions (at least 6 directions) provided more detailed and precise information about water molecules than DWI sequence and this may partly explain the results. Moreover, our results suggested that the combination of DCE-MRI and DTI improved the differential diagnostic performance of DCIS and IBC.
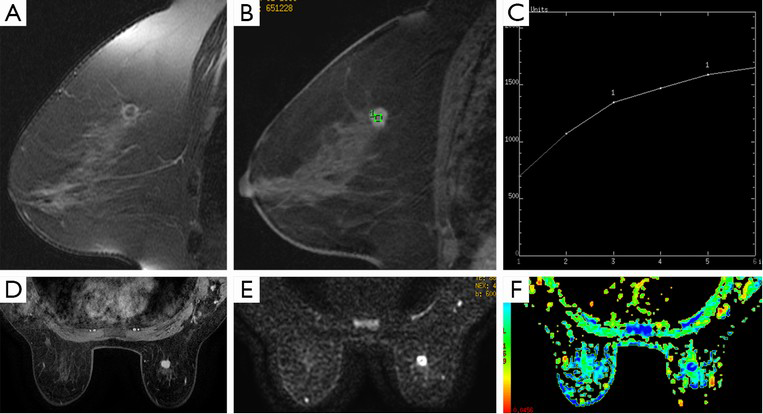
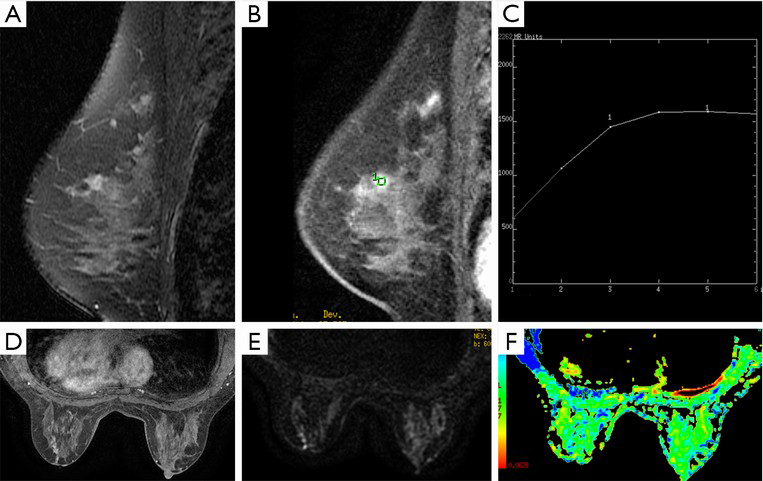
Seven cases were misdiagnosed by using a single DCE-MRI. Three of four false-negative cases were correctly diagnosed by combination diagnosis, including two mass-like lesions with type I curve and one non-mass-like lesion with type II curve (Figures 2,3). These data suggest that additional DTI quantitative measurement to DCE-MRI provides stable differential information for mass-like lesions with type I curve, and combination diagnosis is very helpful for non-mass-like lesions with type II or III curve. Three false-positive cases were not corrected by combination diagnosis. In addition, another case of IBC was mistakenly identified as DCIS. These four mistaken cases by combination diagnosis presented mass-like lesion with non-type I curve. Therefore, for this kind of breast cancer, combination diagnosis showed no advantage relative to a single use of DCE-MRI. False-positive cases may be explained by the fact that the nature of the contrast dynamics will show the distribution of malignant tissue but cannot distinguish between DCIS and invasive disease because of the overlap in pathology, especially between moderate or high-grade DCIS and IBC. One false-negative case detected by combination diagnosis may be related to the partial volume effect from adjacent background breast tissue. It is difficult to set an appropriate ROI in the thin margin of a rim-enhanced lesion and avoid such contamination (21). In general, combining with DTI quantitative measurement decreased the false-negative rate and increased the total accuracy, because DTI not only revealed the diffusion of water molecules in the extracellular fluid space and allowed estimation of cellularity and tissue structure, but it also represented an extension of standard DWI with diffusion encoding in at least 6 directions, to measure the full diffusion tensor and characterize the motion of water in more details, which may result in more accurate measurement (15,22).
DTI has the unique advantage in providing directional information for anisotropy tissue. In this study, anisotropic parameters such as FA, VR and RA values were lower in DCIS than in IBC, it showed the same tendency as prior studies of brain tumors which had demonstrated a positive correlation between FA and tumor cell density and Ki-67 labelling index (23,24). However, our study demonstrated that there was no statistical difference in FA between DCIS and IBC (8). Pathologically, overlap in tumor nest and stroma reaction between DCIS and IBC may partly explain the lack of differences in the FA measurement. The anisotropy in normal breast tissue was not high, and the destruction by cancer tissue aggravated the diffusion motion of water molecules close to isotropy. After the normalization to the diffusion coefficients in the calculation of FA, the difference between IBC and DCIS became inconspicuous (8). There were also no differences in VR and RA between DCIS and IBC. FA values of breast cancer close to isotropy may suggest that these normalized anisotropy parameters were not suitable for differential diagnosis (8). Selecting the appropriate anisotropy parameters of DTI or development of new method for the analysis of FA value in breast cancer are new directions of further investigations.
Our study had some limitations. First, the sample size of patients with DCIS was small, so we did not classify the DCIS lesions according to pathology subtype or necrosis. The small size sample also did not allow lesions with mass-like or non-mass-like enhancement for detailed analysis or comparison. Thus, a larger scale and prospective designed investigation is needed to further validate our results. Second, the DTI examinations in this study were performed with a diffusion sensitization of b of 600 s/mm2 at 1.5T MR, and utilization of higher b values and field strength may alter DW signal intensities of the breast lesions.
Conclusions
Our study demonstrated that DTI quantitative measurement can reflect the difference between DCIS and IBC to a certain extent. Combination diagnosis of DCE-MRI and DTI had increased sensitivity, decreased false-negative rate and totally improved the accuracy of the differential diagnosis of DCIS and IBC. Quantitative DTI measurement as an adjunct to DCE-MRI provides a valuable method to differentiate DCIS and IBC.
Acknowledgements
This study was supported by the National Basic Research Program of China (973 Program) (Grant No. 2011CB707705), National Natural Science Foundation of China (Grant No. 81471640, 81371715), and the Capital Health Research and Development of Special Foundation (Grant No. 2011-2015-02).
Disclosure: The authors declare no conflict of interest.
References
- Akiyama F, Horii R. Therapeutic strategies for breast cancer based on histological type. Breast Cancer 2009;16:168-72. [PubMed]
- Goto M, Yuen S, Akazawa K, et al. The role of breast MR imaging in pre-operative determination of invasive disease for ductal carcinoma in situ diagnosed by needle biopsy. Eur Radiol 2012;22:1255-64. [PubMed]
- Kuhl C. The current status of breast MR imaging. Part I. Choice of technique, image interpretation, diagnostic accuracy, and transfer to clinical practice. Radiology 2007;244:356-78. [PubMed]
- Costantini M, Belli P, Rinaldi P, et al. Diffusion-weighted imaging in breast cancer: relationship between apparent diffusion coefficient and tumour aggressiveness. Clin Radiol 2010;65:1005-12. [PubMed]
- Medeiros LR, Duarte CS, Rosa DD, et al. Accuracy of magnetic resonance in suspicious breast lesions: a systematic quantitative review and meta-analysis. Breast Cancer Res Treat 2011;126:273-85. [PubMed]
- Deurloo EE, Sriram JD, Teertstra HJ, et al. MRI of the breast in patients with DCIS to exclude the presence of invasive disease. Eur Radiol 2012;22:1504-11. [PubMed]
- Chen X, Li WL, Zhang YL, et al. Meta-analysis of quantitative diffusion-weighted MR imaging in the differential diagnosis of breast lesions. BMC Cancer 2010;10:693. [PubMed]
- Partridge SC, Ziadloo A, Murthy R, et al. Diffusion tensor MRI: preliminary anisotropy measures and mapping of breast tumors. J Magn Reson Imaging 2010;31:339-47. [PubMed]
- Mukherjee P, Berman JI, Chung SW, et al. Diffusion tensor MR imaging and fiber tractography: theoretic underpinnings. AJNR Am J Neuroradiol 2008;29:632-41. [PubMed]
- Hwang ES, Kinkel K, Esserman LJ, et al. Magnetic resonance imaging in patients diagnosed with ductal carcinoma-in-situ: value in the diagnosis of residual disease, occult invasion, and multicentricity. Ann Surg Oncol 2003;10:381-8. [PubMed]
- Soderstrom CE, Harms SE, Copit DS, et al. Three-dimensional RODEO breast MR imaging of lesions containing ductal carcinoma in situ. Radiology 1996;201:427-32. [PubMed]
- Kusama R, Takayama F, Tsuchiya S. MRI of the breast: comparison of MRI signals and histological characteristics of the same slices. Med Mol Morphol 2005;38:204-15. [PubMed]
- Santamaría G, Velasco M, Bargallo X, et al. Radiologic and pathologic findings in breast tumors with high signal intensity on T2-weighted MR images. Radiographics 2010;30:533-48. [PubMed]
- Baltzer PA, Schafer A, Dietzel M, et al. Diffusion tensor magnetic resonance imaging of the breast: a pilot study. Eur Radiol 2011;21:1-10. [PubMed]
- Eyal E, Shapiro-Feinberg M, Furman-Haran E, et al. Parametric diffusion tensor imaging of the breast. Invest Radiol 2012;47:284-91. [PubMed]
- Togao O, Doi S, Kuro-o M, et al. Assessment of renal fibrosis with diffusion-weighted MR imaging: study with murine model of unilateral ureteral obstruction. Radiology 2010;255:772-80. [PubMed]
- Inoue K, Kozawa E, Mizukoshi W, et al. Usefulness of diffusion-weighted imaging of breast tumors: quantitative and visual assessment. Jpn J Radiol 2011;29:429-36. [PubMed]
- Stadlbauer A, Bernt R, Gruber S, et al. Diffusion-weighted MR imaging with background body signal suppression (DWIBS) for the diagnosis of malignant and benign breast lesions. Eur Radiol 2009;19:2349-56. [PubMed]
- Malayeri AA, El Khouli RH, Zaheer A, et al. Principles and applications of diffusion-weighted imaging in cancer detection, staging, and treatment follow-up. Radiographics 2011;31:1773-91. [PubMed]
- Hakyemez B, Aksoy U, Yildiz H, et al. Intracranial epidermoid cysts: diffusion-weighted, FLAIR and conventional MR findings. Eur J Radiol 2005;54:214-20. [PubMed]
- Imamura T, Isomoto I, Sueyoshi E, et al. Diagnostic performance of ADC for Non-mass-like breast lesions on MR imaging. Magn Reson Med Sci 2010;9:217-25. [PubMed]
- Mukherjee P, Bahn MM, McKinstry RC, et al. Differences between gray matter and white matter water diffusion in stroke: diffusion-tensor MR imaging in 12 patients. Radiology 2000;215:211-20. [PubMed]
- Beppu T, Inoue T, Shibata Y, et al. Fractional anisotropy value by diffusion tensor magnetic resonance imaging as a predictor of cell density and proliferation activity of glioblastomas. Surg Neurol 2005;63:56-61. [PubMed]
- Kinoshita M, Hashimoto N, Goto T, et al. Fractional anisotropy and tumor cell density of the tumor core show positive correlation in diffusion tensor magnetic resonance imaging of malignant brain tumors. Neuroimage 2008;43:29-35. [PubMed]