
Expenditure of hospital care on cancer in China, from 2011 to 2015
Introduction
A solid understanding of levels and trends of spending on cancer is important to evaluate whether our healthcare resources were wisely spent and to prioritize future resources for cancer treatment and prevention. However, studies on economic burden of cancers in China are scant and the results are inconsistent (1,2). Most studies were carried out in specific regions or used data with poor representativeness. There were very few studies analyzed the expenditure of cancer patients changed over time and the distribution of payments over different types of cancers. Hu et al. used the National Health Service Survey and Vital Registration data to estimate the economic burden of non-communicable chronic diseases in China in 2003 and showed that 25.6 billion RMB were spent on the inpatient and outpatient visits of cancers (1). However, the total expenditure of cancer care in China in the last decade is unknown. Considering the increasing incidence rate of cancer (3-5) and rising volume of outpatient and inpatient (6), it is urgently required to estimate the total payments for cancer treatment in China and provide scientific evidence for the policy formulation of health care and health insurance. This study used the national hospital information database (HID) and inpatient medical record home page (IMRHP) dataset to estimate the payments of cancer treatment in China, depicting a picture on how the money was spent on cancer treatments.
Materials and methods
Data source
HID
According to the Statistics Law of the People’s Republic of China and the Statistics Regulations of the National Health and Family Planning Commission (NHFPC), all the hospitals in China are required to report their basic information every year. As a non-profit affiliated institution of NHFPC, Center for Health Statistics and Information (CHSI) is responsible for collecting, analyzing and administrating the general statistics information including HID and IMRHPs. All these information are reported through the Health Statistics and Information Reporting System (HSRS) built by the CHSI. The HID mainly includes hospital’s properties, grades, staff numbers, number of beds, equipment condition, volume of outpatient and inpatient visits, incomes from outpatients and inpatients, and payments for medical service and human resource, etc. The data quality control was processed hierarchically. Every year before February, provincial CHSIs examine the data quality of hospital information and inform the hospitals of the results. Hospitals that fail to pass the examination need to report their basic information again in due time. Every year before March, the national CHSI examines the data quality and informs the provincial CHSIs of the results. Hospitals that fail to meet the quality requirements need to report the data once again. Except for that, data quality control meetings are held by the national CHSI every year and data quality supervision and inspection are carried out regularly. In this study, totally 5,215 hospitals in grade 3, 21,060 hospitals in grade 2 and 629 cancer specialized hospitals from 2011 to 2015 were included.
IMRHPs
The IMRHPs have been collected by the HSRS which is administered by the CHSI since 2008. The hospitals above grade 2 are required to report their IMRHP data quarterly. The main information of IMRHPs includes: patients’ demographic information, code of diagnosis, code of surgery, results of treatments, types of health insurance, hospitalization expenses, etc. The validity and completeness of IMRHPs are controlled hierarchically. The data validity control mainly focuses on the logic check (i.e. male patients get female disease, infants get chronic disease). The completeness of IMRHPs is evaluated by two dimensions. One is about the completeness of item reporting for each IMRHP. The other dimension is about the completeness of the quantity of IMRHPs reporting. Provincial CHSIs check the quality of IMRHPs quarterly and give feedbacks to hospitals. The national CHSI examines the data quality yearly and gives feedback to provincial CHSIs. Besides, data quality control meetings, data quality supervision and inspections are carried out regularly. In this study, data of nearly 350 million inpatients were analyzed.
Statistical analysis
Icd-10 was used to code symptoms. Diseases were defined by the different ranges of icd-10 codes according to the Chinese hospital disease catalog (7). Considering that the ratios of cancer inpatient payments to total inpatient payments (RCITI) were mainly influenced by the grades and the sites of hospitals (8-10), the estimates of the payments of cancer inpatients were stratified by hospital grades and provinces. The inpatient incomes of hospitals by different grades and different provinces from 2011 to 2015 were summarized using the HID. The RCITIs of hospitals by different grades and different provinces from 2011 to 2015 were estimated using the IMRHP database. The formula is as below:

|
FEEc stands for the payments of inpatients for a specific type of cancer; Rcij stands for the RCITIs of specific cancer for hospitals of different grades and different provinces; and Feeij stands for the inpatient incomes for hospitals of different grades and different provinces.
Since the IMRHP database from 2011 to 2015 only included the data from grade 2 and 3 hospitals (hospitals with more than 100 beds) and the duty of grade 1 hospitals is mainly about the provision of clinic treatment on very common diseases (such as influenza, and high blood pressure), disease prevention and patients referral services, this study only includes the payments in grade 2, grade 3 and specialized cancer hospitals.
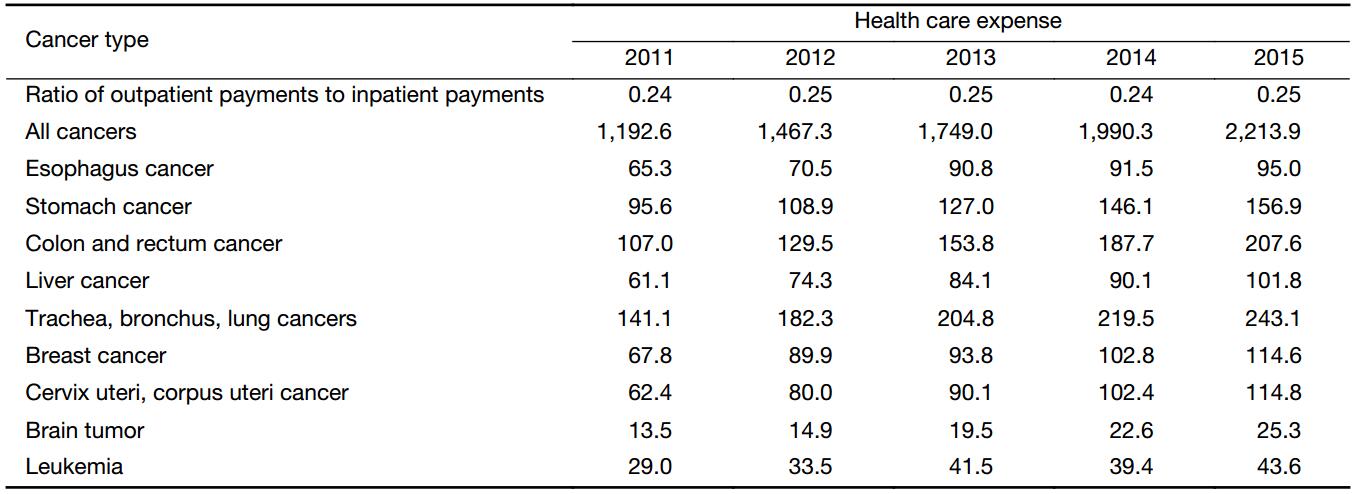
The ratio of outpatient payments to inpatient payments (ROI) of cancer was used to estimate the total expenditure of cancer care in China. Formerly, most analysts used simple rules-of-thumb, where the cost of outpatient is assumed to equal the cost of a specific number of inpatient, generally three or four (11-13). This approach is relatively straightforward as it requires only information on total or in- or out-patient hospital costs. However, the validity of applying the same ratio to all countries has been questioned by some scholars (14), who showed this ratio varied among countries. Instead of using the above approach, this study used the incomes from outpatients and inpatients of all specialized cancer hospitals in China to estimate the ROIs of cancer from 2011 to 2015.
Results
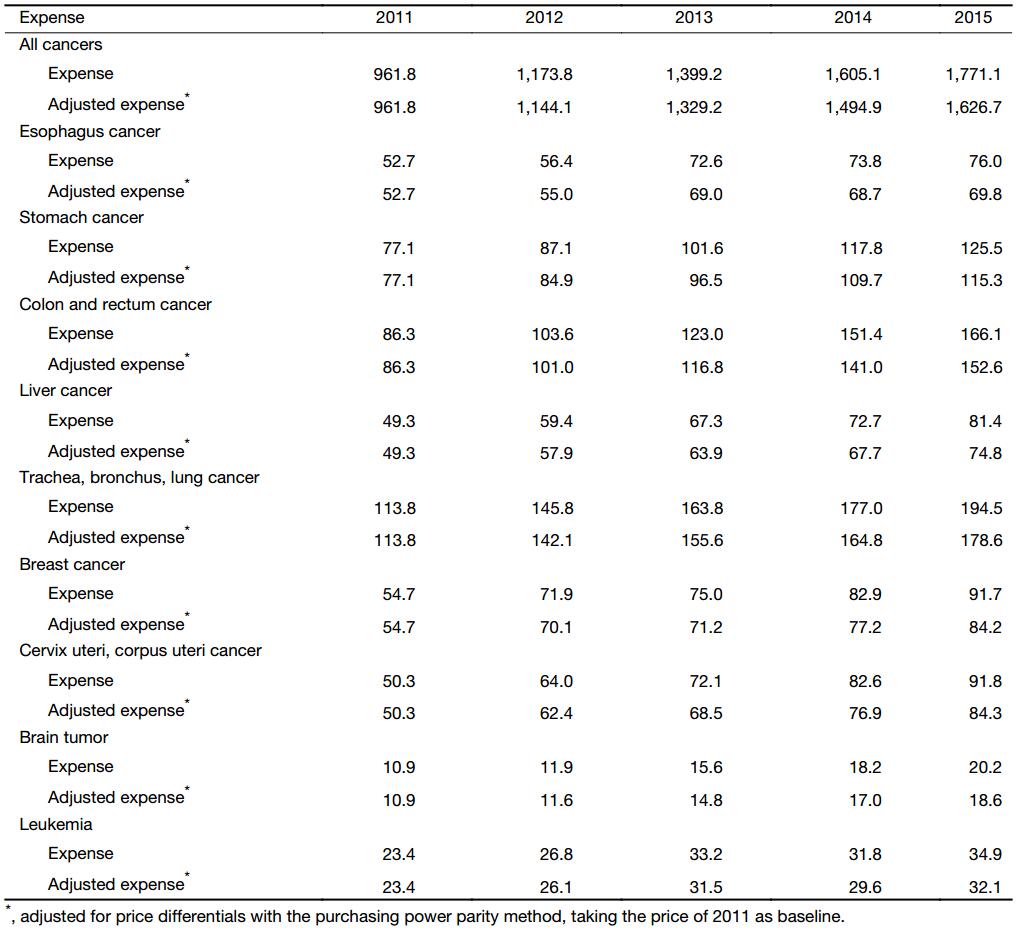
From 2011 to 2015, the payments for cancer inpatients in China have increased in both absolute values and inflation adjusted values. As to the absolute ones, the payments of total cancer inpatients have increased by 84.1%, which means the total expenses reached 177.1 billion RMB in 2015, accounting for 4.3% of the total health expenditure. As to the inflation adjusted ones (payment in constant 2011 RMB), the total cancer inpatient payments have increased by 69.1%, and the adjusted expenses reached 162.7 billion RMB in 2015. The growth rate in inpatient payments decelerated with 22.0% for 2011–2012 and 10.3% for 2014–2015.
The inpatient payments of various cancers in some sites ranking top 9 of the 3rd national death retrospective survey (14) were estimated. The payment on trachea, bronchus and lung cancers was the highest, accounting for 11.0% of the total cancer inpatient payments in 2015, with an absolute value of 19.5 billion RMB. The total payments of all cancers have increased over the years. The highest rise was observed in the colon and rectum cancers with the absolute payment rising by 92.5% while the inflation adjusted payment by 76.8%. The lowest rise was the esophagus cancer with the absolute payment rising by 44.2% and the inflation adjusted payment by 32.4%. Significantly decelerated growth was observed in most of the diseases except for brain tumor, and the growth rate of payment has increased from 9.2% (2011–2012) to 11.0% (2014–2015) (Table 1).
Full table
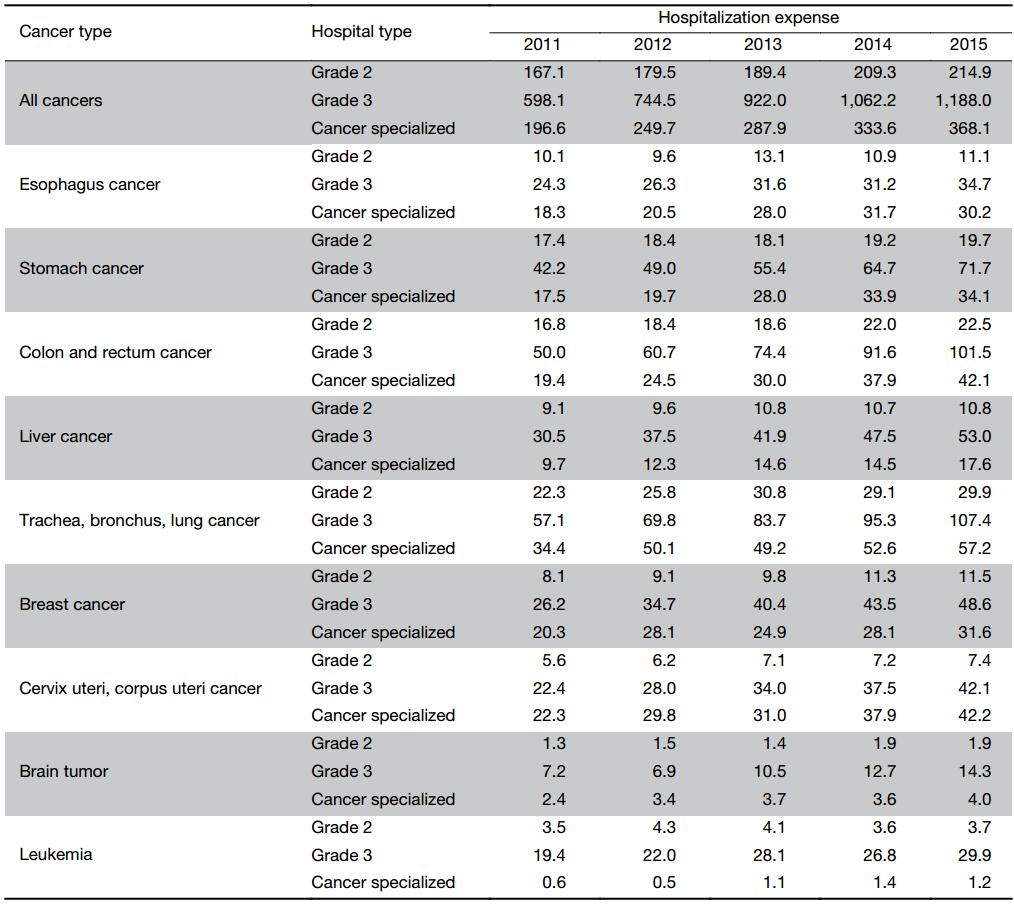
The payments of cancer inpatients have increased in all types of hospitals. From 2011 to 2015, the payments of grade 3 general hospitals have increased by 98.6% from 59.8 billion RMB to 118.8 billion RMB. The payments in cancer specialized hospitals have increased by 87.2% from 19.7 billion RMB to 36.8 billion RMB. The payment growth in grade 2 general hospitals has been slow but still with a 28.6% rise from 16.7 billion RMB to 21.5 billion RMB. The ratio of payments in grade 2 general hospitals to total payments of cancer inpatients decreased from 17.4% to 12.1%, while it increased from 62.2% to 67.1% in grade 3 general hospitals. The payments of cancer inpatients have been concentrated in grade 3 general hospitals over time.
From 2011 to 2015, colon and rectum cancers had the highest increase rate, which was 33.9% in grade 2 general hospitals, 103.0% in grade 3 general hospitals and 117.0% in specialized cancer hospitals. Esophagus cancer had the lowest increase rate, which was 9.9% for grade 2 general hospitals, 42.8% for grade 3 general hospitals and 65.0% for specialized cancer hospitals. The major cancer inpatient payments happened in the grade 3 general hospitals, except for cervix uteri and corpus uteri cancer, for which, 46.0% of the payment happened in the specialized cancer hospitals in 2015, 45.9% in grade 3 general hospitals and only 8.1% in grade 2 general hospitals. For leukemia, 85.9% of the payment happened in grade 3 general hospitals, 10.6% in grade 2 general hospitals while only 3.4% in specialized cancer hospitals in 2015 (Table 2).
Full table
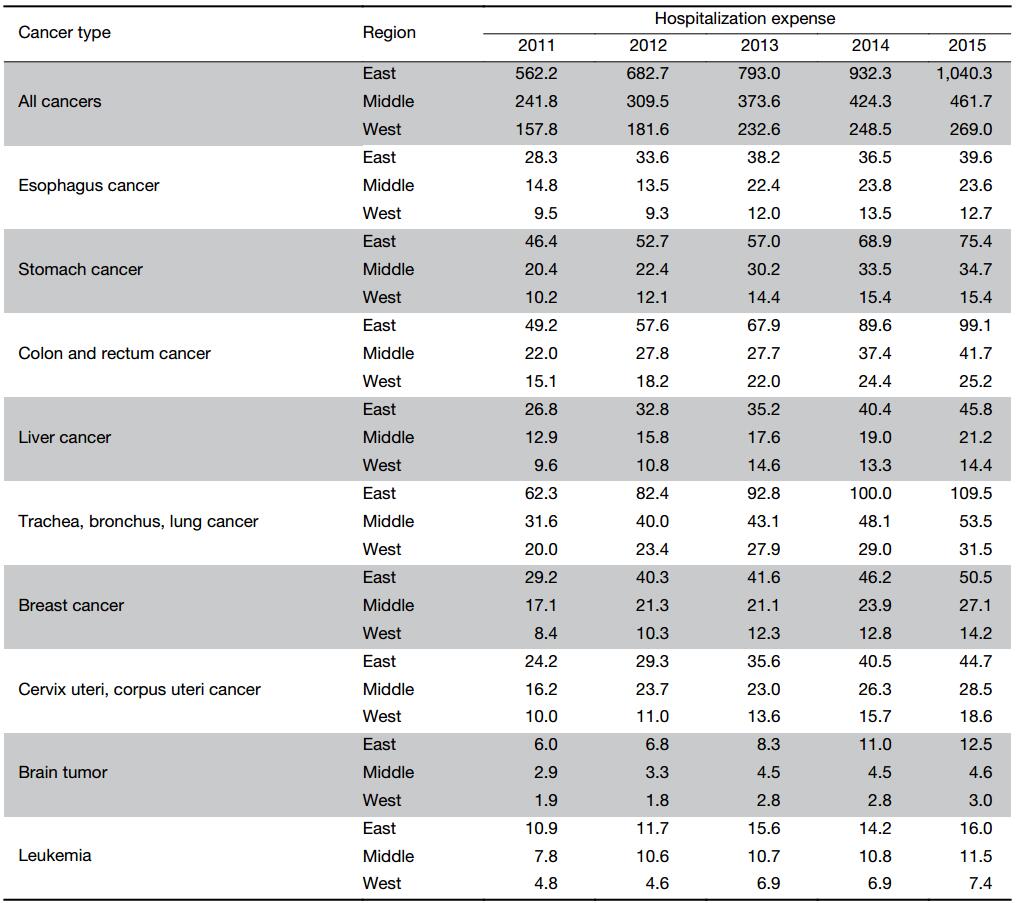
From 2011 to 2015, around 58% cancer inpatient payments happened in the eastern region of China, reaching 104.0 billion RMB in 2015, while the payments in the middle region and west region were 46.2 billion and 26.9 billion RMB, respectively. From 2011 to 2015, the payments in the eastern region, the middle region and the western region have increased by 85.1%, 91.0% and 70.5%, respectively. However, the growth rate of payments has decelerated year by year. For example, the payments in the middle region increased by 28.0% from 2011 to 2012, while the growth rate fell to 8.8% from 2014 to 2015.
Similar trend has been found in different types of cancers, with major payments in the eastern region of China. The highest degree of concentration was observed in brain tumor. In 2015, 1.3 billion RMB were spent in the eastern region of China, accounting for 62.0% of the total payments of brain tumor. While only 0.5 billion RMB and 0.3 billion RMB were spent in the middle region and western region respectively. A relatively even distribution was observed in leukemia, with 1.6 billion RMB inpatient payments in the eastern region in 2015, 1.2 billion RMB in the middle region and 0.7 billion RMB in the western region. From 2011 to 2015, the highest growth rate of inpatient payments was observed in brain tumor in the eastern region (107.5%), colon and rectum cancer in the middle region (90.0%), and cervix uteri and corpus uteri cancer in the western region (86.7%) (Table 3).
Full table
The highest inpatient payments of cancer were observed in Jiangsu, reaching 17.0 billion RMB in 2015. The inpatient payments in Guangdong (16.8 billion), Zhejiang (11.6 billion) and Henan (10.9 billion) exceeded 10 billion as well. The above four provinces together have consumed 31.8% of the total cancer inpatient payments in China. Beijing and Shanghai spent tremendous money on cancer inpatients in contrast to their number of residents. In 2015, 9.4 billion and 8.6 billion RMB were spent in Beijing and Shanghai, respectively, much higher than the payments in Sichuan and Shanxi whose numbers of residents were much higher than Beijing and Shanghai (Figure 1).
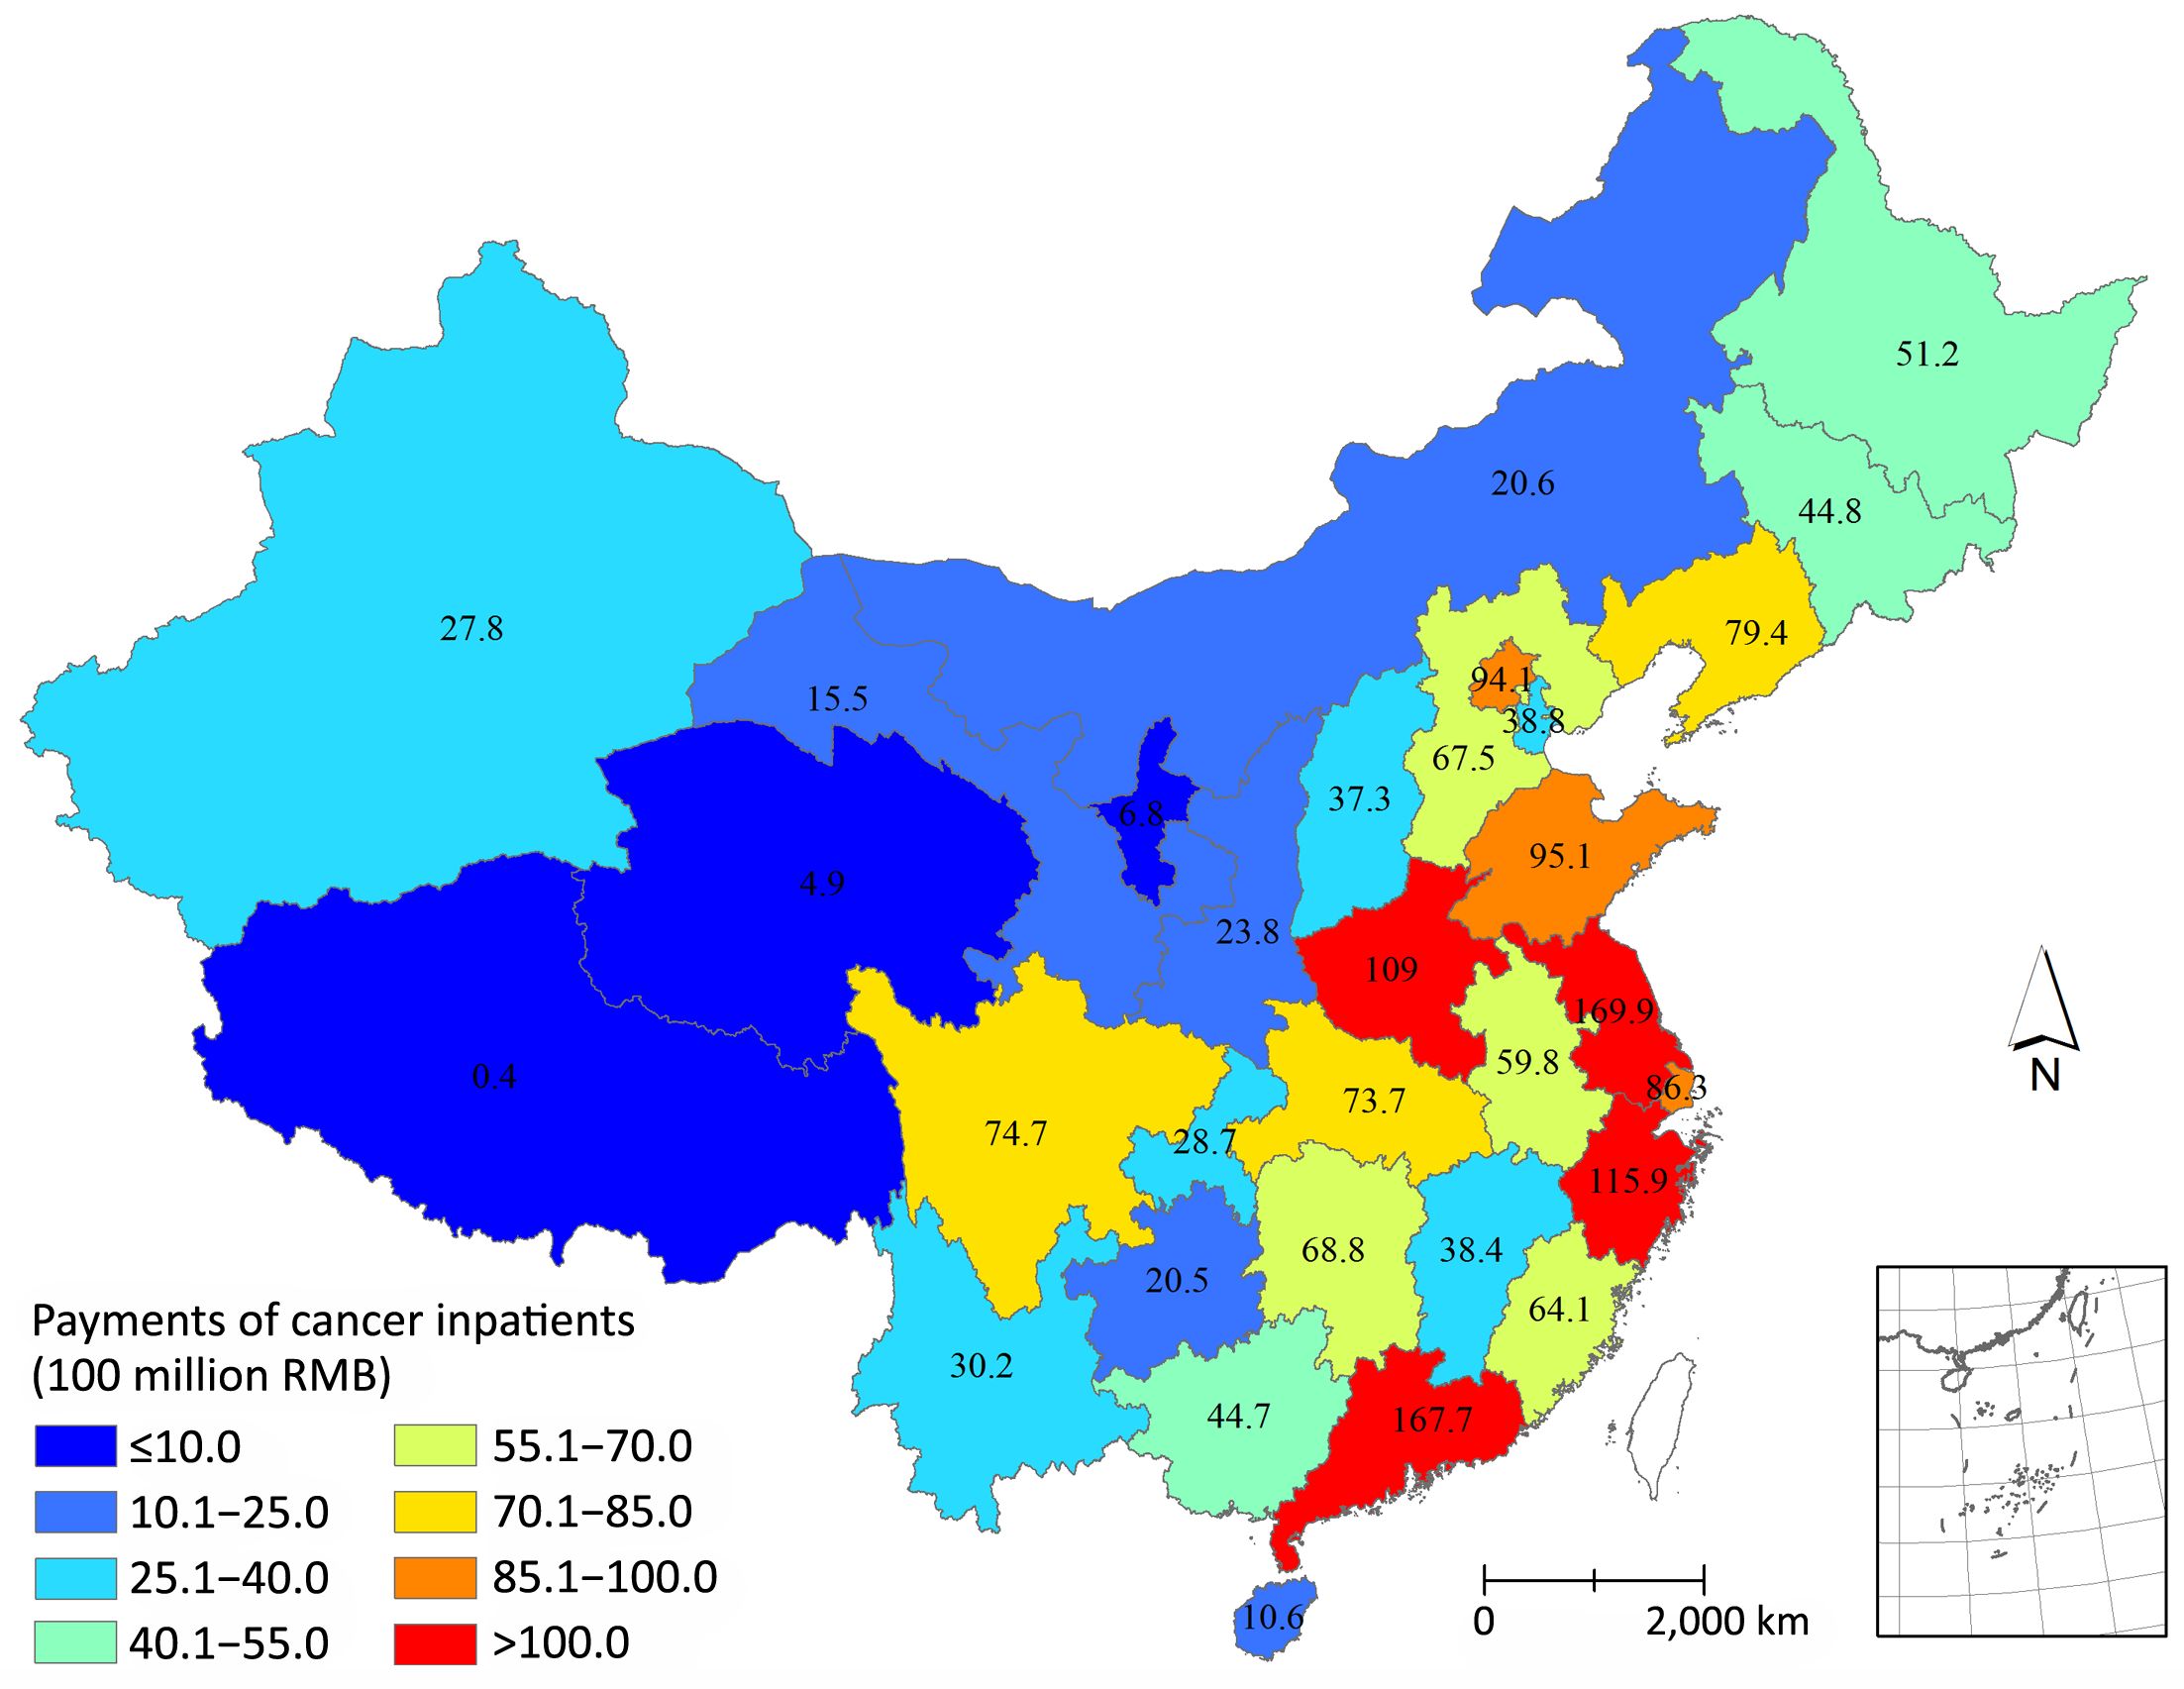
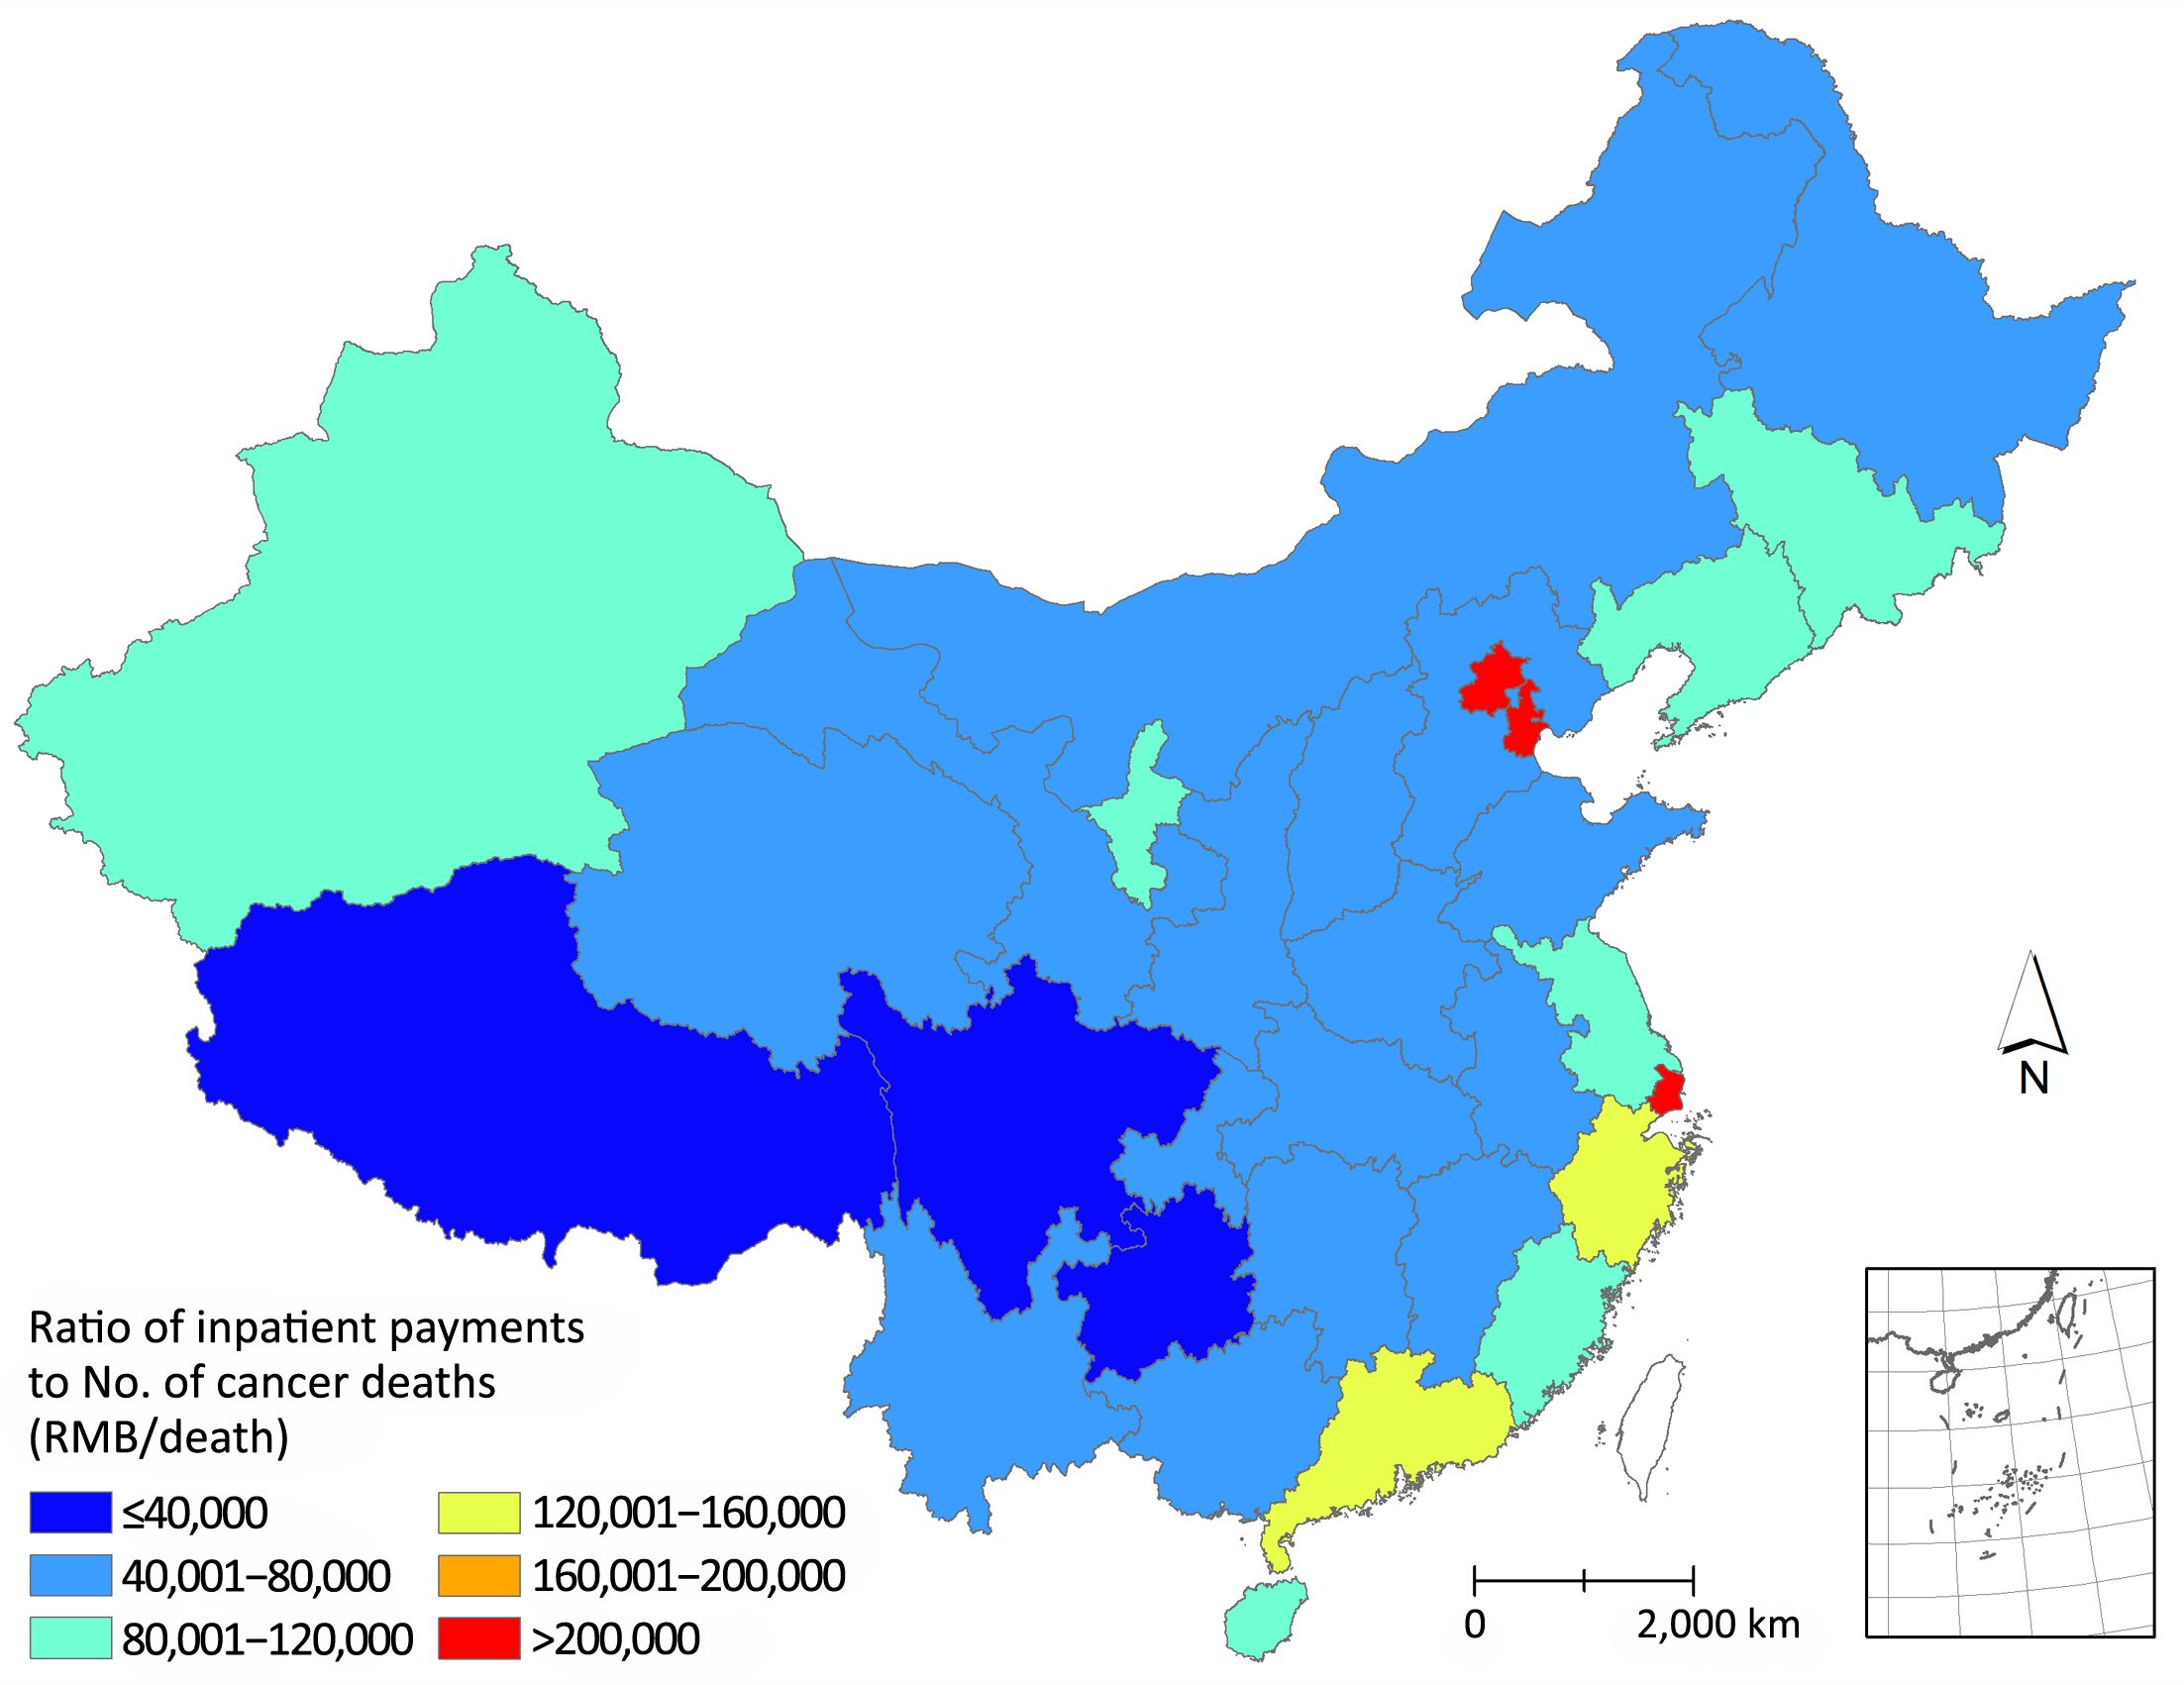
The health seeking behavior of cancer patients and accessibility of health care were measured by the ratios of cancer inpatient payments to the number of cancer deaths based on the GBD 2015 Study (15). The highest ratios were observed in Beijing, Shanghai and Tianjin, suggesting that the inpatient payments were extremely high compared to the numbers of cancer deaths in these three cities. The lowest ratios were observed in Tibet, Sichuan and Guizhou, indicating that the inpatient payments of these three provinces were extremely low compared to the numbers of cancer deaths (Figure 2).
The ROIs were quite consistent from 2011 to 2015 (nearly 1:4). Based on the inpatient payments and ROIs, the total payments of cancer treatments, including inpatient treatment and outpatient treatment, were estimated. The total payments of cancer treatments in 2015 were 221.4 billion, which increased by 85.6% compared to that in 2011, accounting for 5.4% of the total health expenditure in China.
Among all types of cancers, the highest payments presented in trachea, bronchus and lung cancers with 24.3 billion RMB in 2015, and the lowest was for brain tumor treatment with 2.5 billion in 2015. Compared to 2011, the payments for colon and rectum cancer treatment had the highest growth rate (94.0%), while the payments for esophagus cancer had the lowest growth rate (45.5%).
For all types of cancers, the growth rate of treatment payments slowed down from 2011 to 2015, which decreased from 23.0% (2011–2012) to 11.2% (2014–2015). The highest decrease was observed in the breast cancer from 32.6% (2011–2012) to 11.5% (2014–2015) (Table 4).
Full table
Discussion
The total payments of cancer medical treatment (including in- and out-patient treatments) were 221.4 billion RMB in 2015, 8.6 times of those in 2003 (1). The growth rate was slightly higher than that of the total health expenditure, which was 6.2 times (from 658.4 billion RMB to 4,097.5 billion RMB) (14). With increasing medical insurance coverage, especially launching of the policy about the insurance of severe illness, the ratio of cancer payments to total payments and the growth rate of cancer payments compared to the total health expenditure were greatly increased in recent years. In European Union (EU), the costs of inpatient cancer care were estimated to be 28.4 billion Euro in 2009 (16), slightly higher than those in China in 2015 (28.4 billion Euro equals to 187.1 billion RMB). In the US, the total cost of cancer care (including the hospital care and self-care) was 124.6 billion USD in 2010 (17); using the proportion (40.0%) of hospital care cost over the total cost from the EU study (16), the hospital cost was estimated to be 49.8 billion USD, 34.6% higher than our estimates in 2015.
The total expenditure of cancer medical treatment in 2015 (221.4 billion RMB) accounts for 5.4% of the total health expenditure, which is equal to 17.7% of the government health expenditure. Since 38% patients have not visited hospitals according to the 5th National Health Service Survey (18), the total expenditure would reach 357.1 billion RMB if these patients are induced. According to the requirements of the 13th Five-Year health care reform plan that the proportion of reimbursement of the basic medical insurance should be stable at 75%, the government would pay 250.0 billion RMB at most, which accounts for 20% of the government health expenditure.
The highest payment in trachea, bronchus and lung cancers and the fastest growth rate of payments in colon and rectum cancers hint the disease map of inpatient payments and the changing trends. The high proportion of cancer inpatient payments in grade 3 general hospitals and the low proportion in grade 2 general hospitals suggest that the health seeking behavior of cancer patients did not change over the past 5 years and will continue to concentrate to grade 3 general hospitals and specialized cancer hospitals.
The expenditure of cancer treatments varies by regions with the major expenditure in the eastern region of China, and 12.4% of the total expenditure of cancer treatment happened in Beijing, Tianjin and Shanghai, which was equal to the expenditure of the 7 provinces of Gansu, Chongqing, Anhui, Shaanxi, Guizhou, Sichuan and Tibet. However, the number of death of cancer patients in Beijing, Tianjin and Shanghai is only about 12.7% of those in the above 7 provinces (15,19). The payments of cancer patients were mismatched with the numbers of cancer patients among provinces. This implies that cancer patients tend to visit doctors and have high rates of receiving medical treatment in developed areas. The provinces with higher ratios of cancer inpatient payments to number of cancer deaths imply the provinces gather more cancer patients seeking medical treatments.
It should be noted that there are some limitations of this study. First, only the payments in grade 2, grade 3 general hospitals and specialized cancer hospitals were included in the analyses. Since the cancer payments in grade 1 or grass-roots hospitals were not included, the estimates in the study could be lower than the actual cancer payments. Second, the ROIs generated from specialized cancer hospitals were used as the ROI of cancer patients in China. The ROI in specialized cancer hospitals may be different from the actual ROI of cancer patients, however, this is the best estimate we can make, and the consistent ROIs in specialized cancer hospitals from 2011 to 2015 suggested that this ratio could be quite steady in China.
Conclusions
This study estimates the total payments of cancer treatments in China in the recent 5 years, which would provide the information for decision makings on the allocation of resources to service provisioning, prevention strategies and research funding. It also provides reliable evidence to evaluate whether our government can afford the economic burden of cancer with increasing the medical insurance coverage.
Acknowledgements
This work was supported by National Natural Science Foundation of China (No.71403189).
Footnote
Conflicts of Interest: The authors have no conflicts of interest to declare.
References
- Hu J, Rao K, Qian J, et al. The Study of Economic Burden of Chronic Non-communicable Diseases in China. Zhongguo Man Xing Bing Yu Fang Yu Kong Zhi (in Chinese) 2007;15:189–93.
- Shi JF, Shi CL, Yue XP, et al. Economic burden of cancer in China during 1996-2014: a systematic review. Zhonghua Zhong Liu Za Zhi (in Chinese) 2016;38:929–41. [PubMed] DOI:10.3760/cma.j.issn.0253-3766.2016.12.010
- Chen W, Zheng R, Zeng H, et al. Annual report on status of cancer in China, 2011. Chin J Cancer Res 2015;27:2–12. [PubMed] DOI:10.3978/j.issn.1000-9604.2015.01.06
- Chen W, Zheng R, Zou T, et al. National cancer incidence and mortality in China, 2012. Chin J Cancer Res 2016;28:1–11. [PubMed] DOI:10.3978/j.issn.1000-9604.2016.02.08
- Chen W, Zheng R, Zhang S, et al. Cancer incidence and mortality in China in 2013: an analysis based on urbanization level. Chin J Cancer Res 2017;29:1–10. [PubMed] DOI:10.21147/j.issn.1000-9604.2017.01.01
- Cai Y, Wu R, Lan L, et al. The situation of disease distribution and resource consumption of Chinese inpatients during 2011-2015. Zhongguo Wei Sheng Tong Ji (in Chinese) 2017;34:298–300.
- National Health and Family Planning Commission. National Health and Family Planning Statistics Survey System, 2016. Beijing: Peking Union Medical College Press, 2016.
- Adam T, Evans DB. Determinants of variation in the cost of inpatient stays versus outpatient visits in hospitals: a multi-country analysis. Soc Sci Med 2006;63:1700–10. [PubMed] DOI:10.1016/j.socscimed.2006.04.023
- Lan L, Cai Y, Zhang T, et al. Influencing factors of inpatient expenditure pattern for cancer in China, 2015. Chin J Cancer Res 2017;29:11–7. [PubMed] DOI:10.21147/j.issn.1000-9604.2017.01.02
- Barnum H, Kutzin J. Public Hospitals in Developing Countries: Resource Use, Cost, Financing (World Bank). Baltimore: The Johns Hopkins University Press, 1993.
- Koné T, Silué A, Agness-Soumahoro J, et al. Expenditures on AIDS in Côte d’Ivoire. In: Ainsworth M, Fransen L, Over M, eds. Confronting AIDS: Evidence from the developing world. Brussels: European Commission, 1998:255-62.
- Mwikisa CN. HIV/AIDS Interventions in Zambia: financial Implications. The 10th General Assembly of CODESRIA, Kampala, Uganda. Dakar: CODESRIA, 2002:60. Available online: http://wwww.codesria.org/links/Home/Abstracts%20GA%201-5/ AIDs_Mwikisa2.htm
- Lombard CJ, Stegman JC, Barnard A. Modelling net expenditure of hospitals in the Cape Province. S Afr Med J 1991;80:508–10. [PubMed]
- National Health and Family Planning Commission. Statistical Yearbook of Health and Family Planning in China, 2016. Beijing: Peking Union Medical College Press, 2016.
- GBD 2015 Mortality and Causes of Death Collaborators. Global, regional, and national life expectancy, all-cause mortality, and cause-specific mortality for 249 causes of death, 1980-2015: a systematic analysis for the Global Burden of Disease Study 2015. Lancet 2016;388:1459–544. [PubMed] DOI:10.1016/S0140-6736(16)31012-1
- Luengo-Fernandez R, Leal J, Gray A, et al. Economic burden of cancer across the European Union: a population-based cost analysis. Lancet Oncol 2013;14:1165–74. [PubMed] DOI:10.1016/S1470-2045(13)70442-X
- Mariotto AB, Yabroff KR, Shao Y, et al. Projections of the cost of cancer care in the United States: 2010-2020. J Natl Cancer Inst 2011;103:117–28. [PubMed] DOI:10.1093/jnci/djq495
- Center for Health Statistics and Information, NHFPC. An Analysis Report of National Health Services Survey in China, 2013. Beijing: Peking Union Medical College Press, 2016.
- Yang L, Yuan Y, Sun T, et al. Population-based cancer incidence analysis in Beijing, 2008-2012. Chin J Cancer Res 2015;27:13–21. [PubMed] DOI:10.3978/j.issn.1000-9604.2015.01.07