
Revalidation of a prognostic score model based on complete blood count for nasopharyngeal carcinoma through a prospective study
*These authors contributed equally to this work.
Abstract
Objective: In our previous work, we incorporated complete blood count (CBC) into TNM stage to develop a new prognostic score model, which was validated to improve prediction efficiency of TNM stage for nasopharyngeal carcinoma (NPC). The purpose of this study was to revalidate the accuracy of the model, and its superiority to TNM stage, through data from a prospective study.
Methods: CBC of 249 eligible patients from the 863 Program No. 2006AA02Z4B4 was evaluated. Prognostic index (PI) of each patient was calculated according to the score model. Then they were divided by the PI into three categories: the low-, intermediate-and high-risk patients. The 5-year disease-specific survival (DSS) of the three categories was compared by a log-rank test. The model and TNM stage (7th edition) were compared on efficiency for predicting the 5-year DSS, through comparison of the area under curve (AUC) of their receiver-operating characteristic curves.
Results: The 5-year DSS of the low-, intermediate-and high-risk patients were 96.0%, 79.1% and 62.2%, respectively. The low-and intermediate-risk patients had better DSS than the high-risk patients (P<0.001 and P<0.005, respectively). And there was a trend of better DSS in the low-risk patients, compared with the intermediate-risk patients (P=0.049). The AUC of the model was larger than that of TNM stage (0.726 vs. 0.661, P=0.023).
Conclusions: A CBC-based prognostic score model was revalidated to be accurate and superior to TNM stage on predicting 5-year DSS of NPC.
Keywords: Complete blood count; score model; revalidation; disease-specific survival; nasopharyngeal carcinoma
Submitted Aug 27, 2016. Accepted for publication Oct 10, 2016.
doi: 10.21147/j.issn.1000-9604.2016.05.01
Introduction
As we know, the current standard management of nasopharyngeal carcinoma (NPC) is multimodality therapy based on intensity-modulated radiation therapy (IMRT), and the treatment strategy for each patient is determined mainly according to the Union for International Cancer Control/American Joint Cancer Committee (UICC/AJCC) TNM stage (1). The cases with early-stage diseases (T1-2N0M0) are given radiotherapy (RT) alone; and the cases with locoregionally advanced-stage diseases (T3-4N0M0, TxN1-3M0) are given concurrent chemo-radiotherapy (CCRT) plus adjuvant chemotherapy (ACT) or not (2). Nevertheless, the prognosis of NPC is not completely in accordance with the TNM stage. Even in the clinical outcome of patients with the same TNM stage, there are heterogeneities which may bring undertreatment or overtreatment (3-8). The discrepancy between the prognosis and the TNM stage is mainly caused by the anatomy-only basis of the TNM stage (9). It does not take into account functional factors representing the biological characteristics of the tumor cells and proved to be associated with the clinical outcome of NPC patients (10).
Actually, in our previous study, to overcome the shortcomings of TNM stage, we have reviewed the complete blood count (CBC) of 1,895 patients who received radical RT in Sun Yat-sen University Cancer Center between January 2001 and December 2004, to develop a prognostic score model based on CBC and the TNM stage for predicting the 5-year disease-specific survival (DSS) of NPC (11). We took CBC into consideration because it was one of the most practical functional indexes which could be routinely measured. And the indexes of the model, such as hemoglobin (Hb), neutrophil to lymphocyte ratio (NLR) and platelet count (PLT), were demonstrated to be independent risk factors for NPC (12-14). The model was developed by the Cox proportional-hazards regression, in which weighted scores proportional to regression coefficient were assigned to each independent risk factor. The total score of the factors in the model was calculated for each patient. Those who had the same total score were appointed to a subgroup. Subgroups without statistical difference in 5-year DSS were then merged with each other to form three categories of patients (low-, intermediate-and high-risk patients). We proved that involvement of CBC indeed improved the prediction efficiency of TNM stage. The accuracy and superiority of our model were validated in other 925 patients treated in the same period.
Besides our model, there were also many approaches made to building prognostic systems based on functional indexes for NPC to improve prediction efficiency and guide individualized treatment, such as Wang's predicting system based on 8 immunomarkers (15), Yang's system based on deoxyribonucleic acid of Epstein-Barr virus (EBV-DNA) and C-reactive protein (16), and Du's system for defining patients fit for neoadjuvant chemotherapy (17). However, those prognostic models, including the one we developed in our previous work, were based on retrospective data, which might bring biases and limited clinical popularization.
To eliminate these biases, we prospectively collected CBC data of patients from the National High Technology Research and Development Program of China (863 Program) No. 2006AA02Z4B4. The study was named 'A Study on Individualized Treatment Strategies of NPC Based on Biological Behaviors and Molecular Characteristics of Tumor Cells'. It was designed to explore the treatment results of different moleculobiological types of NPC treated with different levels of radiation dose. The patients involved consecutively in the 863 Program No. 2006AA02Z4B4 and followed-up for 5 years were chosen to revalidate the accuracy of our prognostic model, and its superiority to UICC/AJCC TNM staging system on predicting the 5-year DSS of NPC patients.
Materials and methods
Patient selection
The data used in this analysis were from patients of the 863 Program No. 2006AA02Z4B4 between December 27, 2006 and July 27, 2011. Patients who were pathologically diagnosed as NPC in Sun Yat-sen University Cancer Center and initially treated by the corresponding author were consecutively involved in the study. The study was approved by the Institutional Review Board of Sun Yat-sen University Cancer Center. All the patients signed informed consent before treatment and had detailed medical records, including magnetic resonance imaging of head and neck, whole-body bone scan and thoraco-abdominal computed tomography (or chest radiograph plus abdominal ultrasonography) for staging. The stage of each patient was determined according to UICC/AJCC TNM staging system. For the convenience of comparative analysis, all the patients were re-staged based on the 7th edition (9).
We excluded patients from this analysis for the following reasons: 1) Karnofsky performance status score <70; 2) distant metastases before or during RT; 3) signs of infection before RT; 4) application of colony stimulating factors such as erythropoietin before RT; 5) RT uncompleted (≥1 fraction missing); or 6) severe dysfunction of heart, lung, liver or kidney and unsuitable for RT.
Treatment strategy
The treatment strategy of all the patients was based on National Comprehensive Cancer Network Guidelines. Early-stage (T1-2N0) disease was treated with RT alone. Locally advanced-stage disease was treated with combination of RT and concurrent chemotherapy (CCT).
The regimen of CCT was nedaplatin 80 mg/m2 d 1 plus 5-flurouracil 500 mg/m2 per day d 2-5 every 3 weeks. A total of 2 cycles of CCT were applied during RT. If grade 3 to 4 hemopoietic, renal or hepatic disorder of Common Terminology Criteria for Adverse Events appeared, CCT was delayed until the disorder recovered to grade 1 or disappeared, and the dose was decreased by 20% in the subsequent cycles. CCT was terminated if delay time lasted more than 2 weeks, or any grade 4 adverse events appeared twice.
The RT of all patients was performed in conventional fractionation. The target definition, delineation and dosage of RT were based on the standard used in Sun Yat-sen University Cancer Center (18). The 2-dimensional conventional RT (2DCRT) consisted of two lateral opposing facio-cervical fields to cover nasopharynx and the upper cervical lymphatic drainage region, and a lower anterior cervical field to cover the lower cervical region. After a dose of 36-40 Gy irradiated, two opposing lateral preauricular fields were used for the primary region, and anterior split neck fields were used for the cervical region instead. The primary tumor was given a total dose of 60-78 Gy, according to the tumor remission rate. In IMRT, a total dose of 66-72 Gy was given to the gross tumor of nasopharynx, 60-70 Gy to the positive neck lymph nodes, 60 Gy to the high-risk region, and 50-54 Gy to the prophylactic irradiation region.
Assessment of CBC and variable definition
In each patient, CBC test was applied one week before RT starting, once a week during RT, and one week after RT completing. HbBRT was the Hb value before RT. HbDRT was the mean of the weekly Hb value during RT. HbART was the Hb value after RT. The diagnosis of anemia is based on WHO's Hemoglobin thresholds, in which anemia is defined as Hb≤130 g/L (male) or 120 g/L (female) (19). Continuous decline of Hb (HbCD) was defined as HbBRT>HbDRT>HbART. NLR was the ratio of neutrophil count to lymphocyte count. NLRBRT was the value of NLR before RT. The cutoff value of NLR was 2.5, which was determined by a receiver-operating characteristic (ROC) analysis in our previous work (11). PLTDRT was defined as the mean of weekly PLT values during RT. Thrombocytosis is the elevation of PLT above the upper normal range, which is 300×109/L for Chinese (20).
Follow-up
Follow-up after RT was made by telephone, letters or outpatient interview trimonthly for the first 3 years, semiannually for the 4th and 5th years, and annually thereafter. All the patients were followed-up until death from NPC or December 31, 2015, whichever came first. Causes of deaths were determined through death certificates, which were supplemented with medical records if necessary.
To exclude deaths from causes other than NPC, we took the 5-year DSS as the primary endpoint of this analysis. The secondary endpoints were the 5-year local recurrence-free survival (RFS) and 5-year distant metastasis-free survival (MFS). The date to start calculating survivals was defined as the date on which RT started.
Validation of prognostic score model and efficiency comparison
A prognostic score model based on indexes of CBC was established in our previous work (11). The prognostic factors in this model included gender, age, T stage, N stage, HbDRT, HbCD, NLRBRT and PLTDRT. The scoring method of each factor is shown in Table 1. The prognostic index (PI) was defined as the sum of the scores of all the factors, and it ranged from 1 to 19. According to the PI, a patient would be allocated into one of the three categories with different clinical outcomes: low-risk patients (PI =1-4), intermediate-risk patients (PI=5-11), and high-risk patients (PI=12-19).
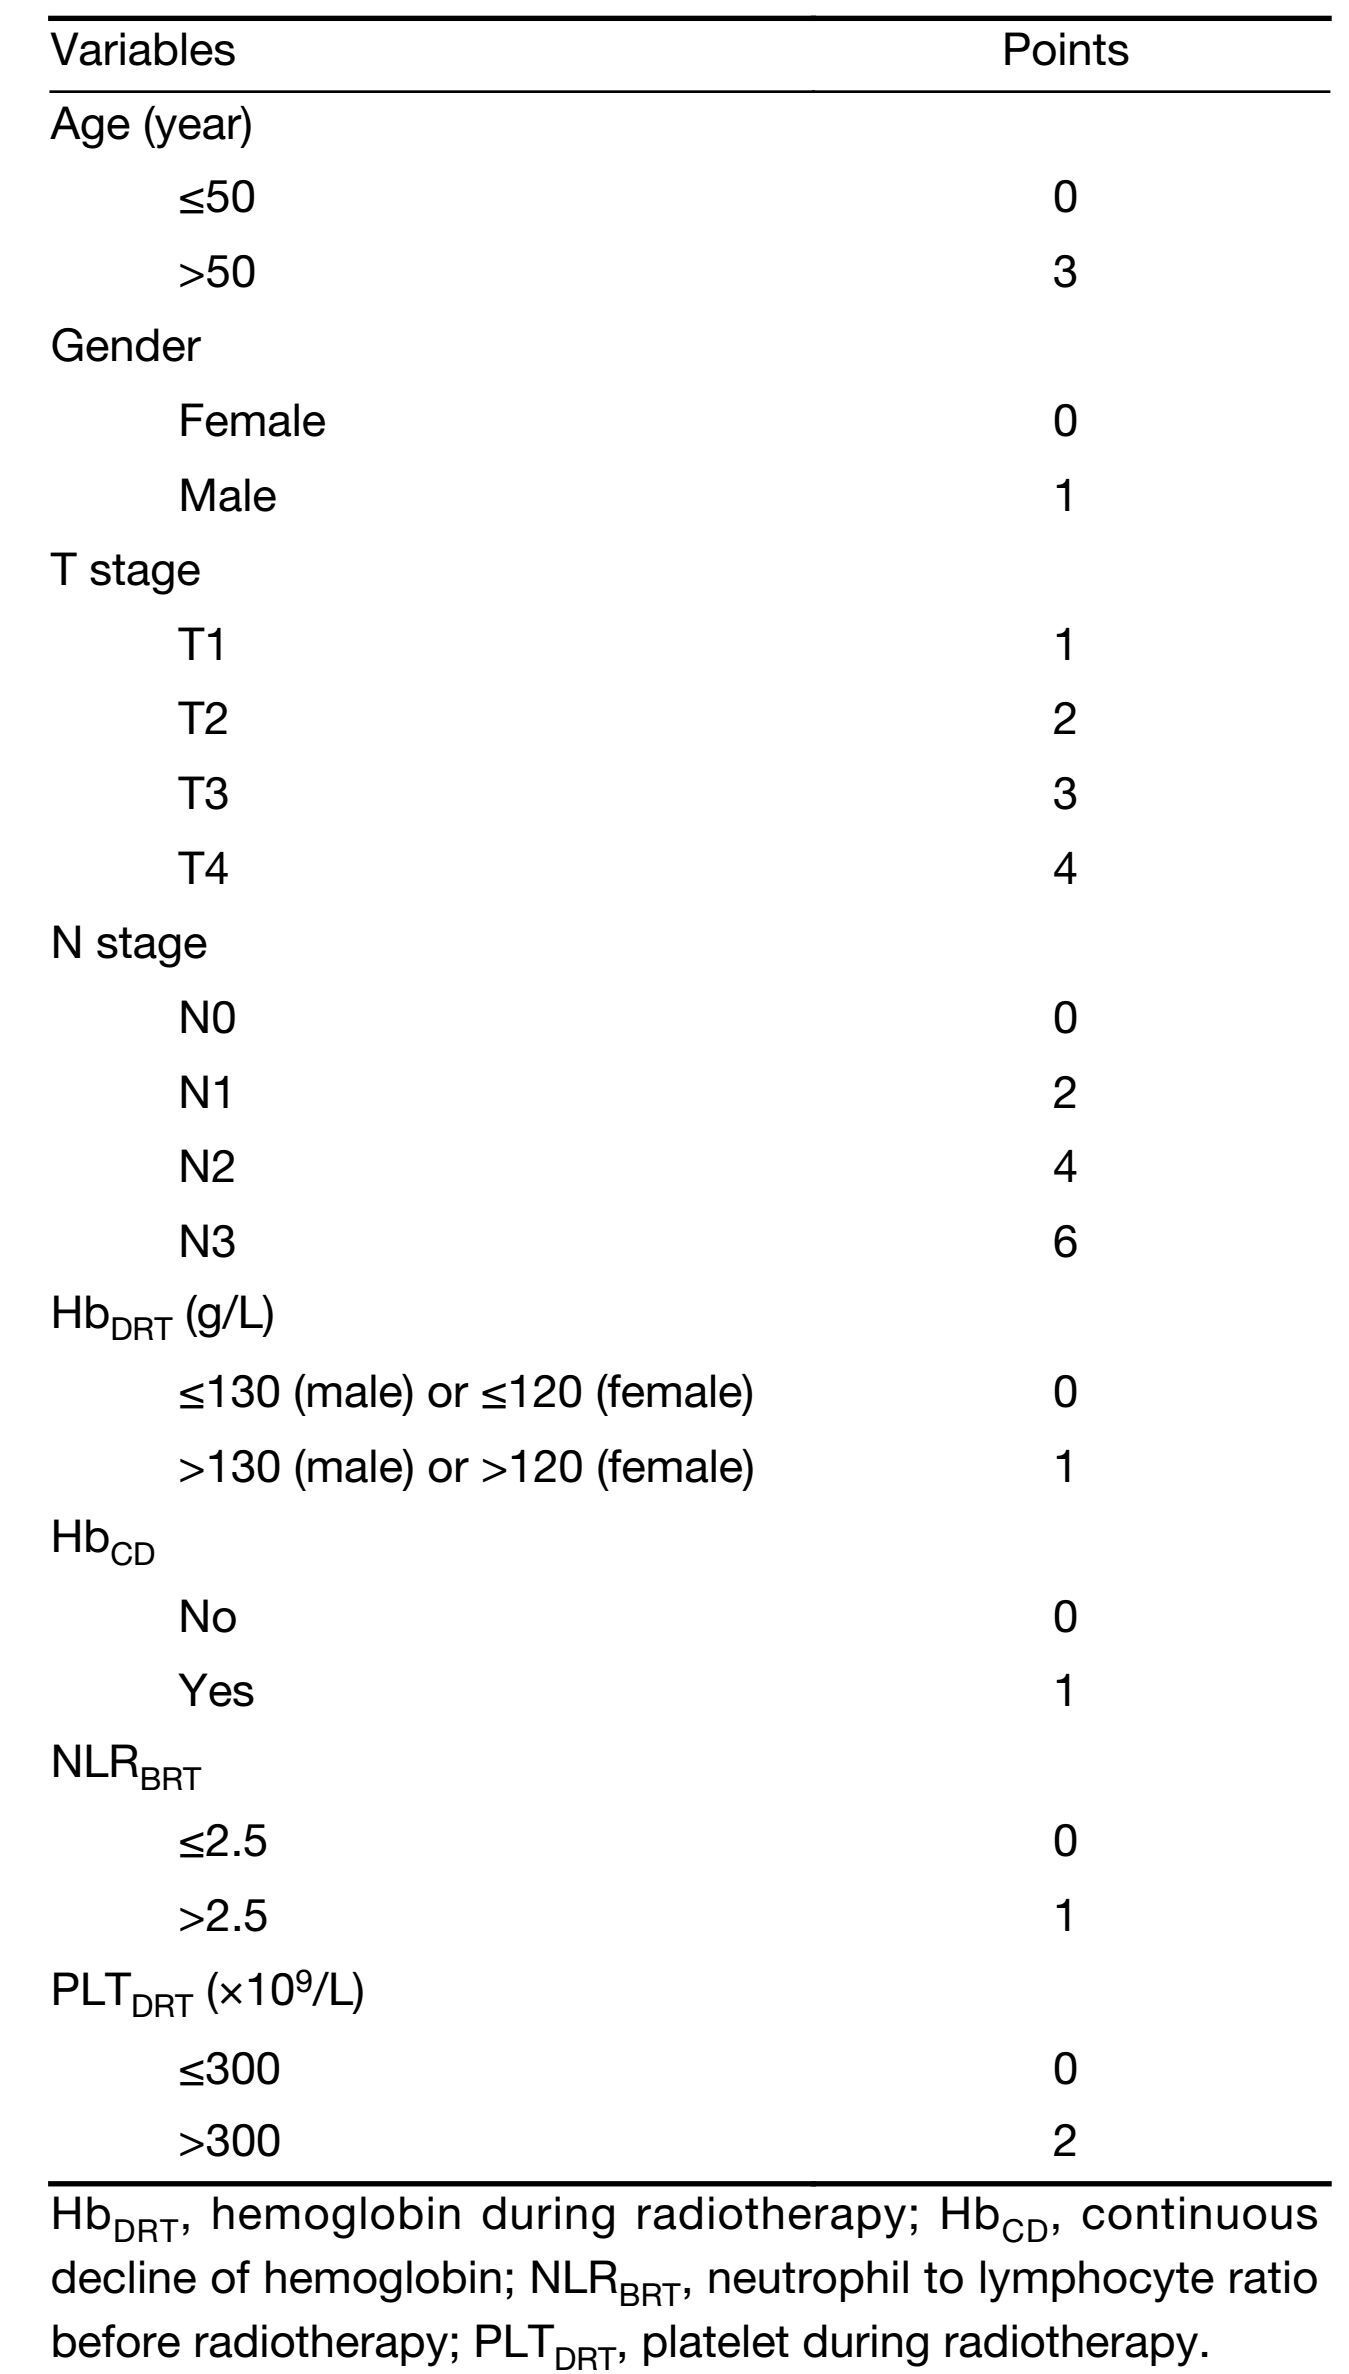
Full table
In this analysis, PI of each patient was calculated by adding together the scores corresponding to his or her prognostic factors. The patients were then divided into the three categories we mentioned above, on basis of their PI. Survivals of the three categories were calculated respectively by a life-table method. The accuracy of the prognostic score model was validated by comparing the 5-year DSS of these three categories. The 5-year RFS and 5-year MFS of the three categories were also compared, respectively. The survival curves were depicted by a Kaplan-Meier approach. And the difference in survivals was assessed by a log-rank test among the three categories. Before comparison, distribution of the baseline clinical characteristics except matching variables among the three categories was assessed by the Chi-square test to ensure comparability.
Finally, we compared the prediction efficiency on 5-year DSS of the prognostic score model with that of UICC/AJCC TNM staging system (7th edition). ROC curves of the two systems were depicted and the comparison of area under curve (AUC) was made by the methodology of DeLong et al. (21).
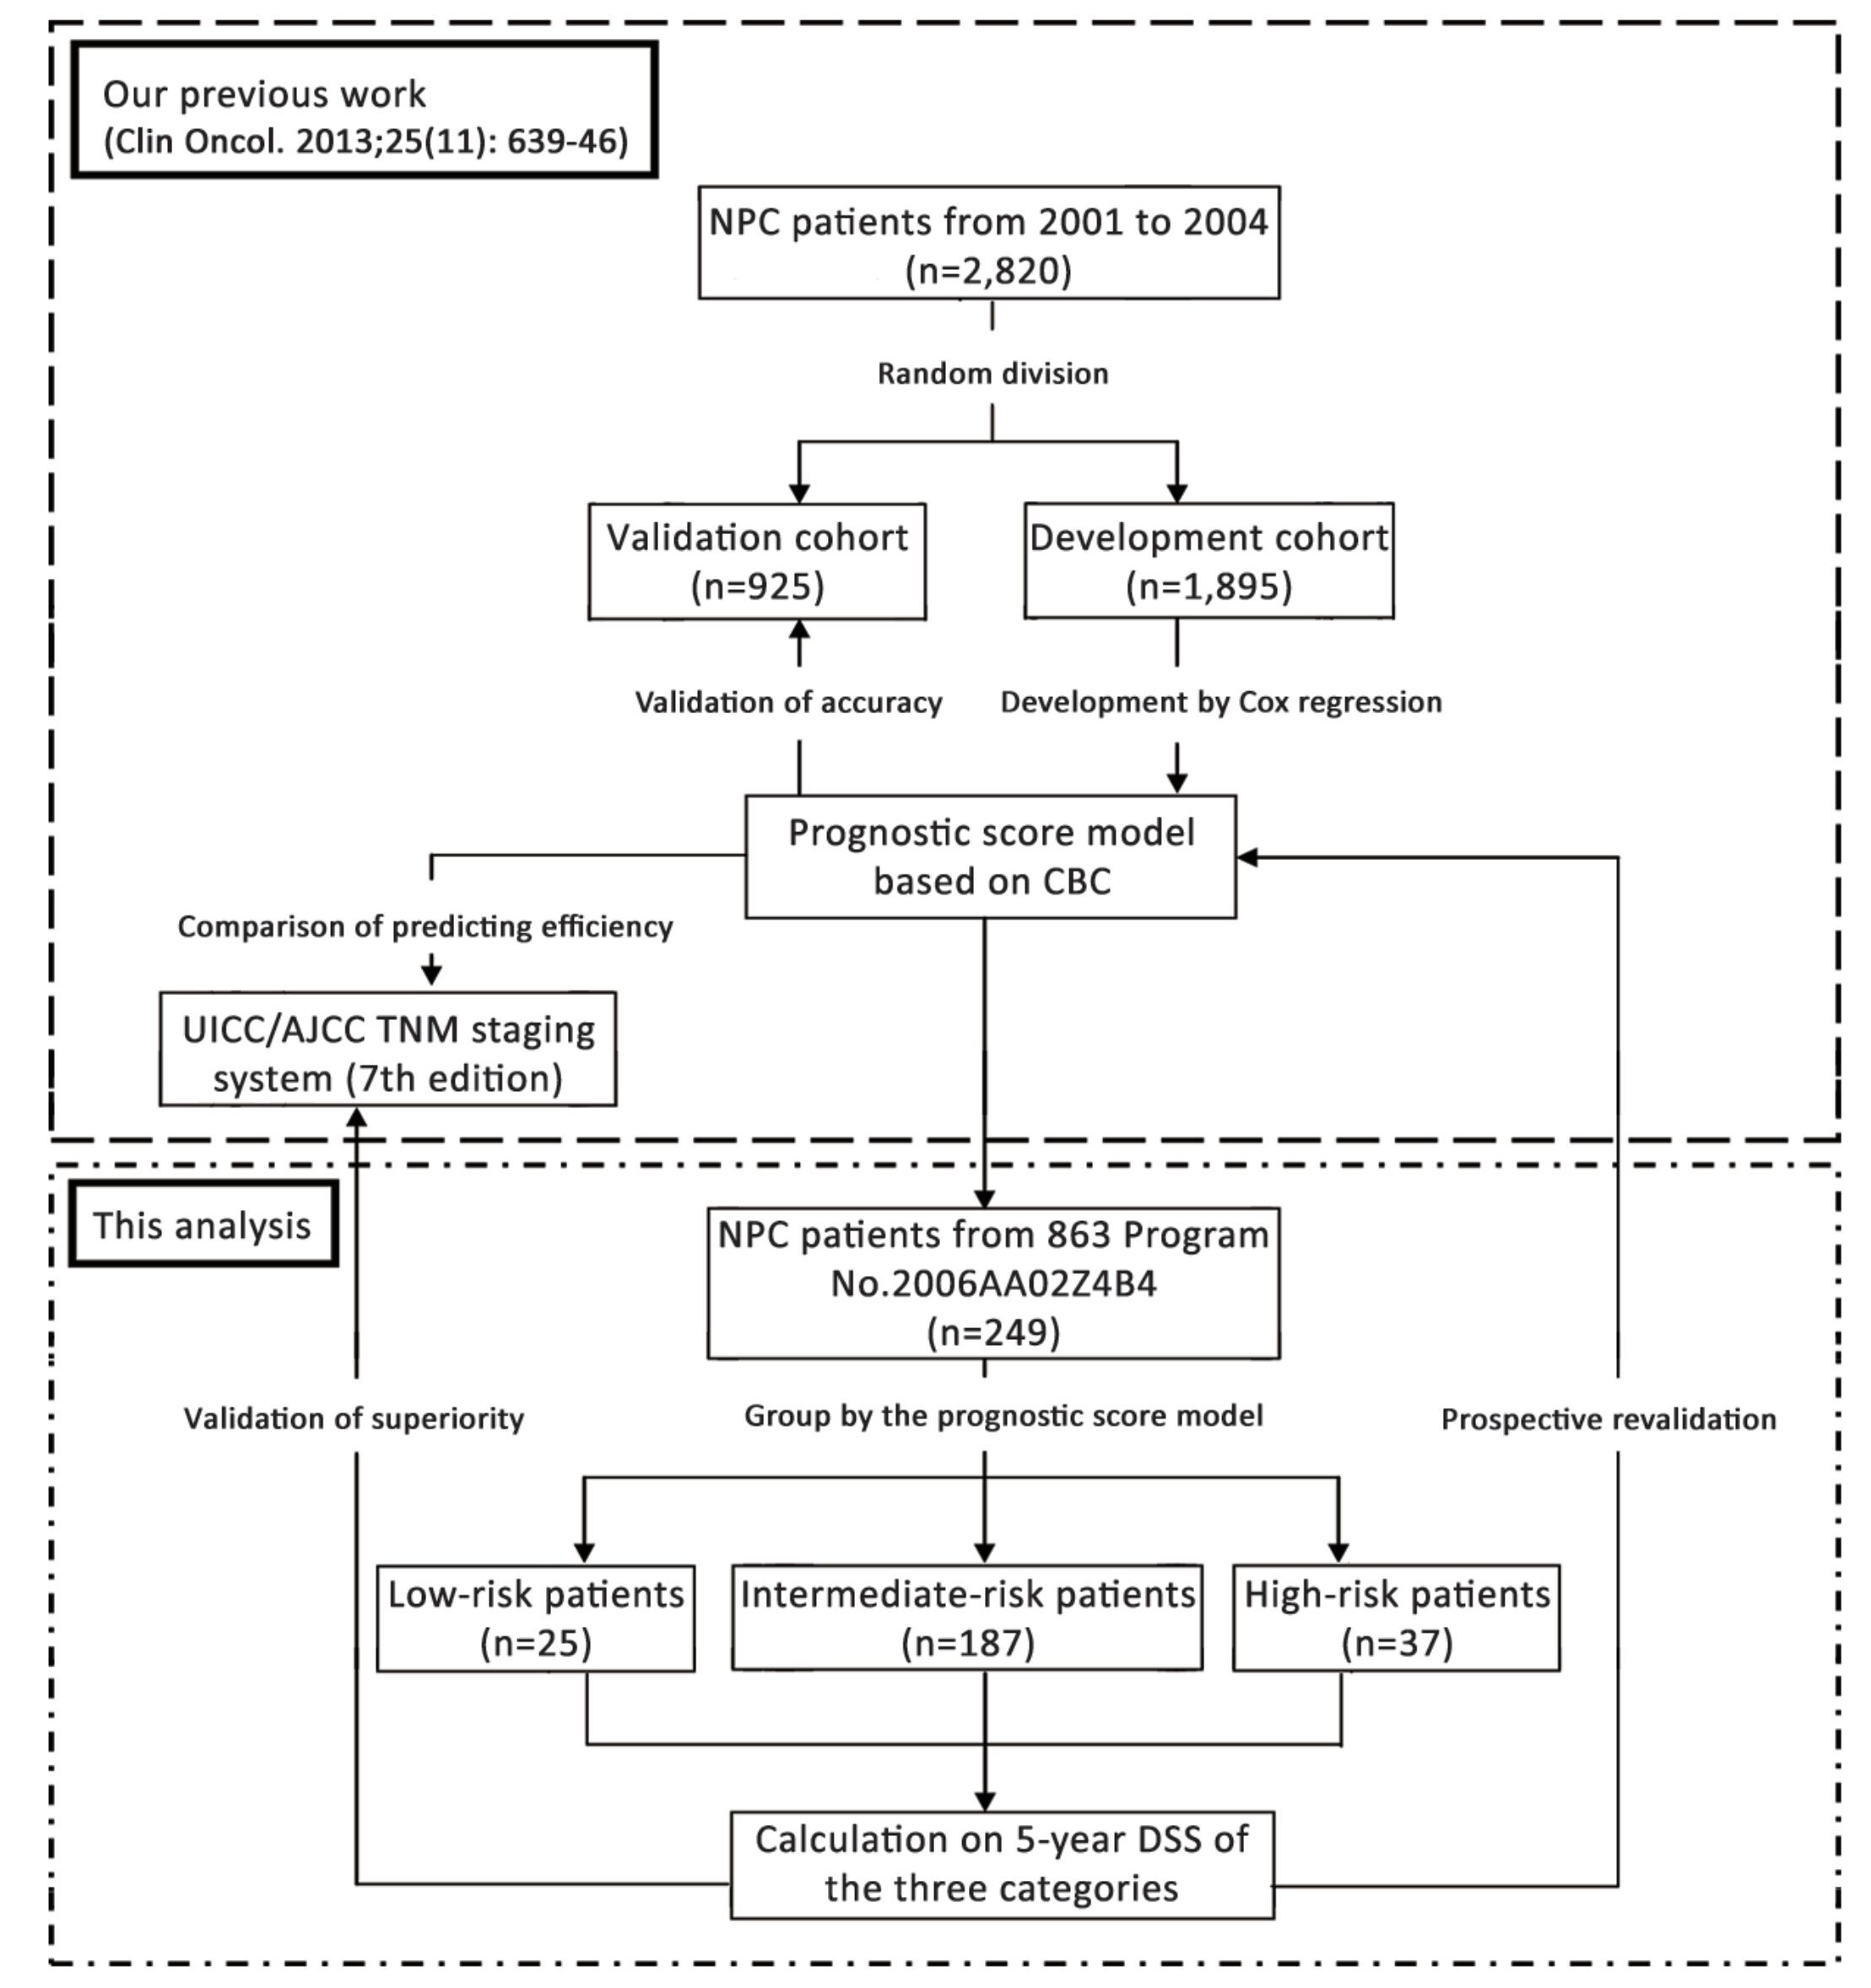
The statistical analysis was made by IBM SPSS Statistics (Version 19.0; IBM Corp., New York, USA) and MedCalc Statistical Software (Version 9.6.4.0; MedCalc Software bvba, Ostend, Belgium). Two-sided P<0.05 was considered statistically significant. But for the multiple comparisons of survivals among the three categories of patients, the P value threshold was adjusted as 0.017 on basis of the Bonferroni correction (22). The whole procedure of this study is summarized in Figure 1.
Results
Clinical characteristics of patients
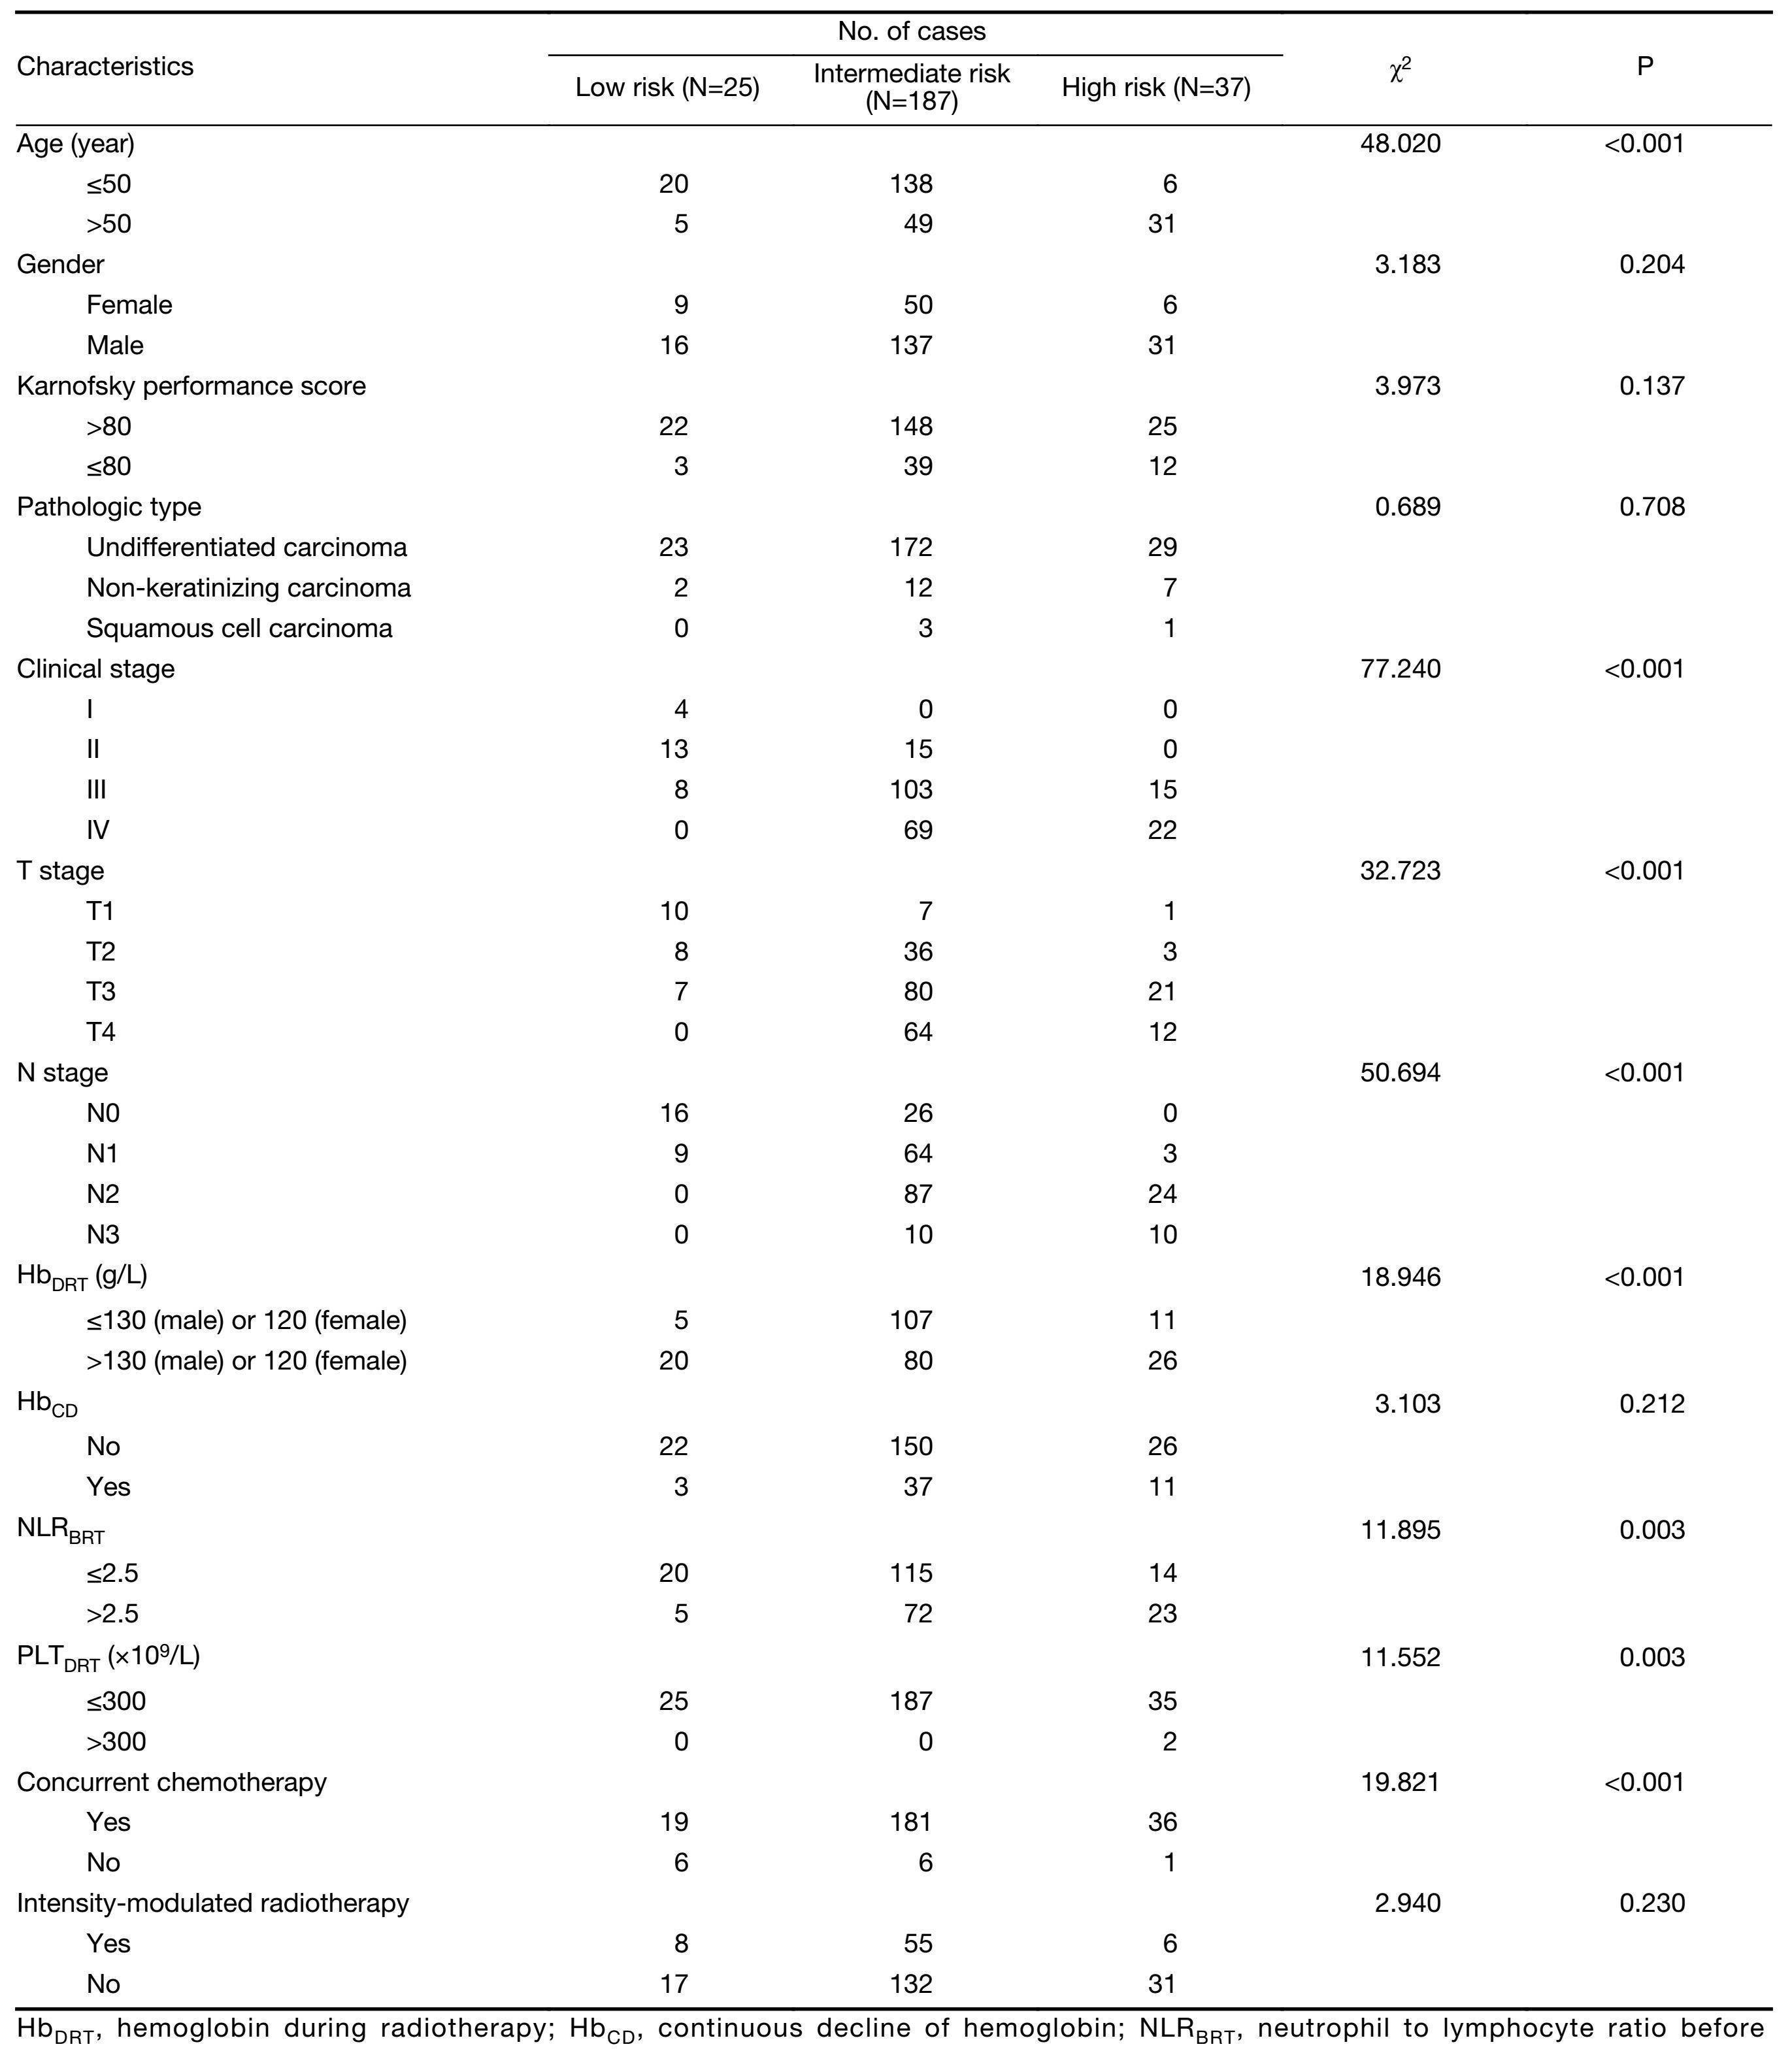
A total of 249 patients from the 863 Program No. 2006AA02Z4B4 were involved in this analysis. All the patients completed their planned treatment. PI score was calculated for each patient according to his or her prognostic factors. Then the patients were divided into three categories on basis of their PI scores. There were 25, 187 and 37 cases with low, intermediate and high risk for death, respectively. Baseline clinical characteristics of patients in the three categories are shown in Table 2. Except factors in the prognostic score model (gender, age, T stage, N stage, HbDRT, HbCD, NLRBRT and PLTDRT), there was significant difference seen only on proportion of those who received CCT, among the three categories of patients. Fewer cases received CCT in the low-risk patients than in the intermediate-and high-risk patients (76.0% vs. 96.7% vs. 97.3%, P<0.001).
Full table
Survival analysis and validation of model
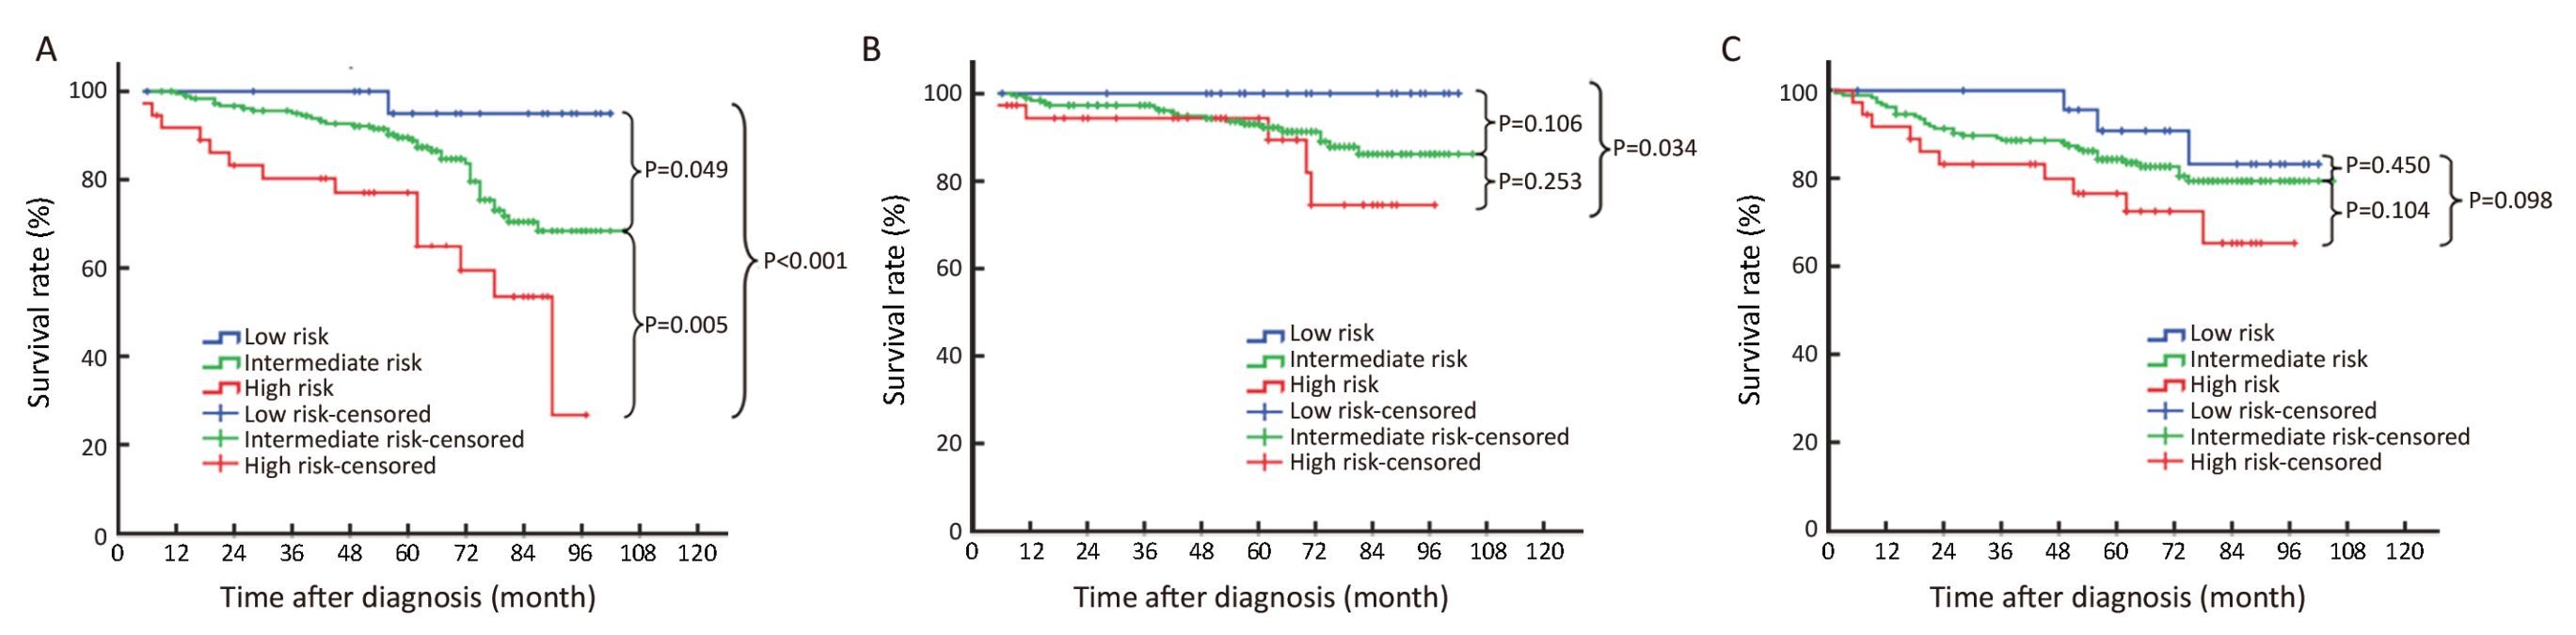
The median follow-up time was 67 months (range, 5-105 months). The 5-year DSS of the low-, intermediate-and high-risk patients were 96.0%, 79.1% and 62.2%, respectively. The 5-year RFS of the low-, intermediate-and high-risk patients were 100%, 90.4% and 86.5%, respectively. And the 5-year MFS of the low-, intermediate-and high-risk patients were 88.0%, 82.4% and 73.0%, respectively. The results of survival calculation are summarized in Table 3.
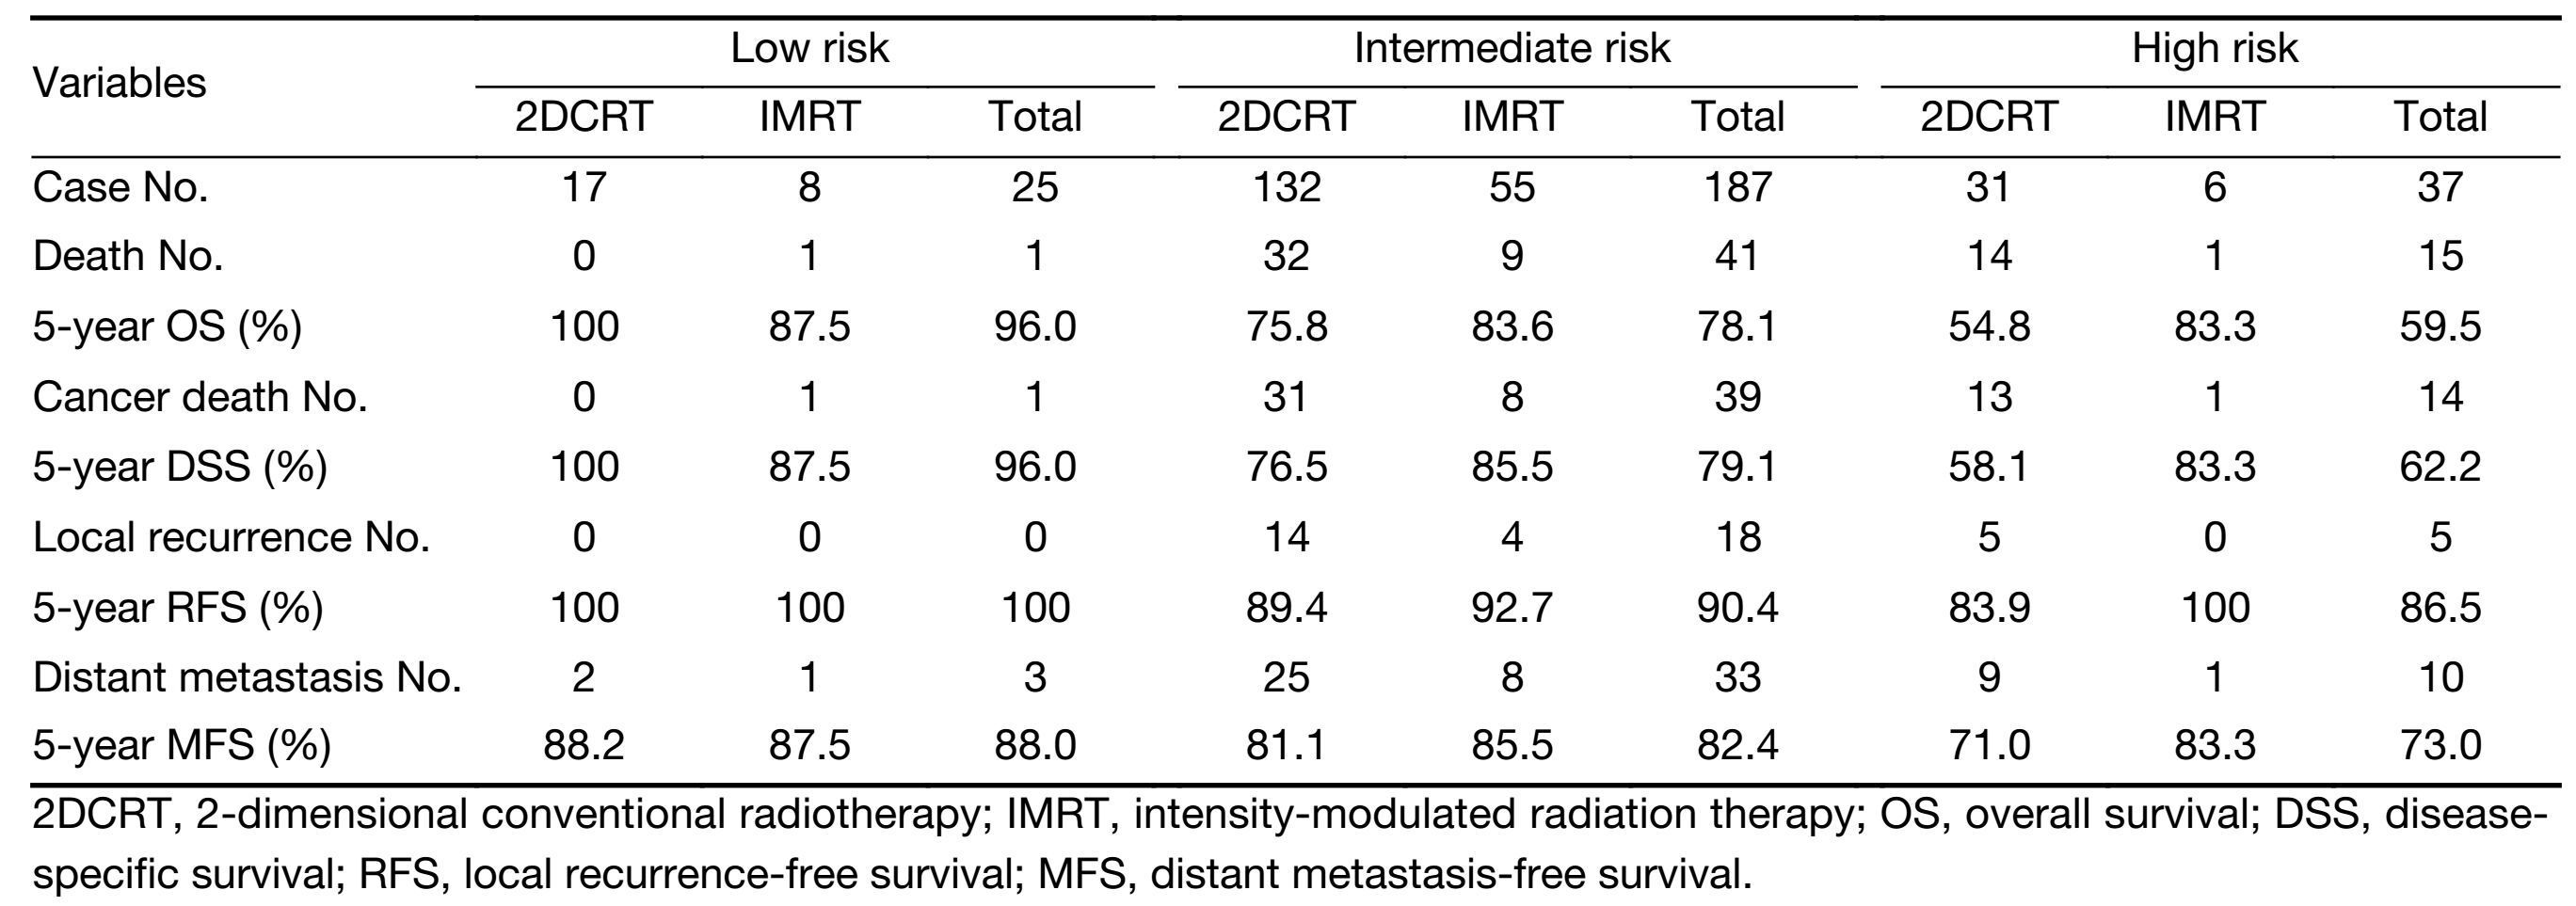
Full table
Through survival analysis, statistically significant differences were seen in the 5-year DSS among the three categories of patients. The 5-year DSS of the low-and intermediate-risk patients was better than that of the high-risk patients (P<0.001 and P<0.005, respectively). Though statistical significance was not achieved, there was a trend of better 5-year DSS in the low-risk patients, compared with the intermediate-risk patients (P=0.049).
No statistical difference in 5-year RFS was seen among the three categories of patients. However, there was a trend of better 5-year RFS in the low-risk patients, compared with the intermediate-risk patients (P=0.034). Statistical difference was not achieved in 5-year MFS among the three categories. Survival curves of the three categories of patients are summarized in Figure 2.
Comparison with TNM staging system
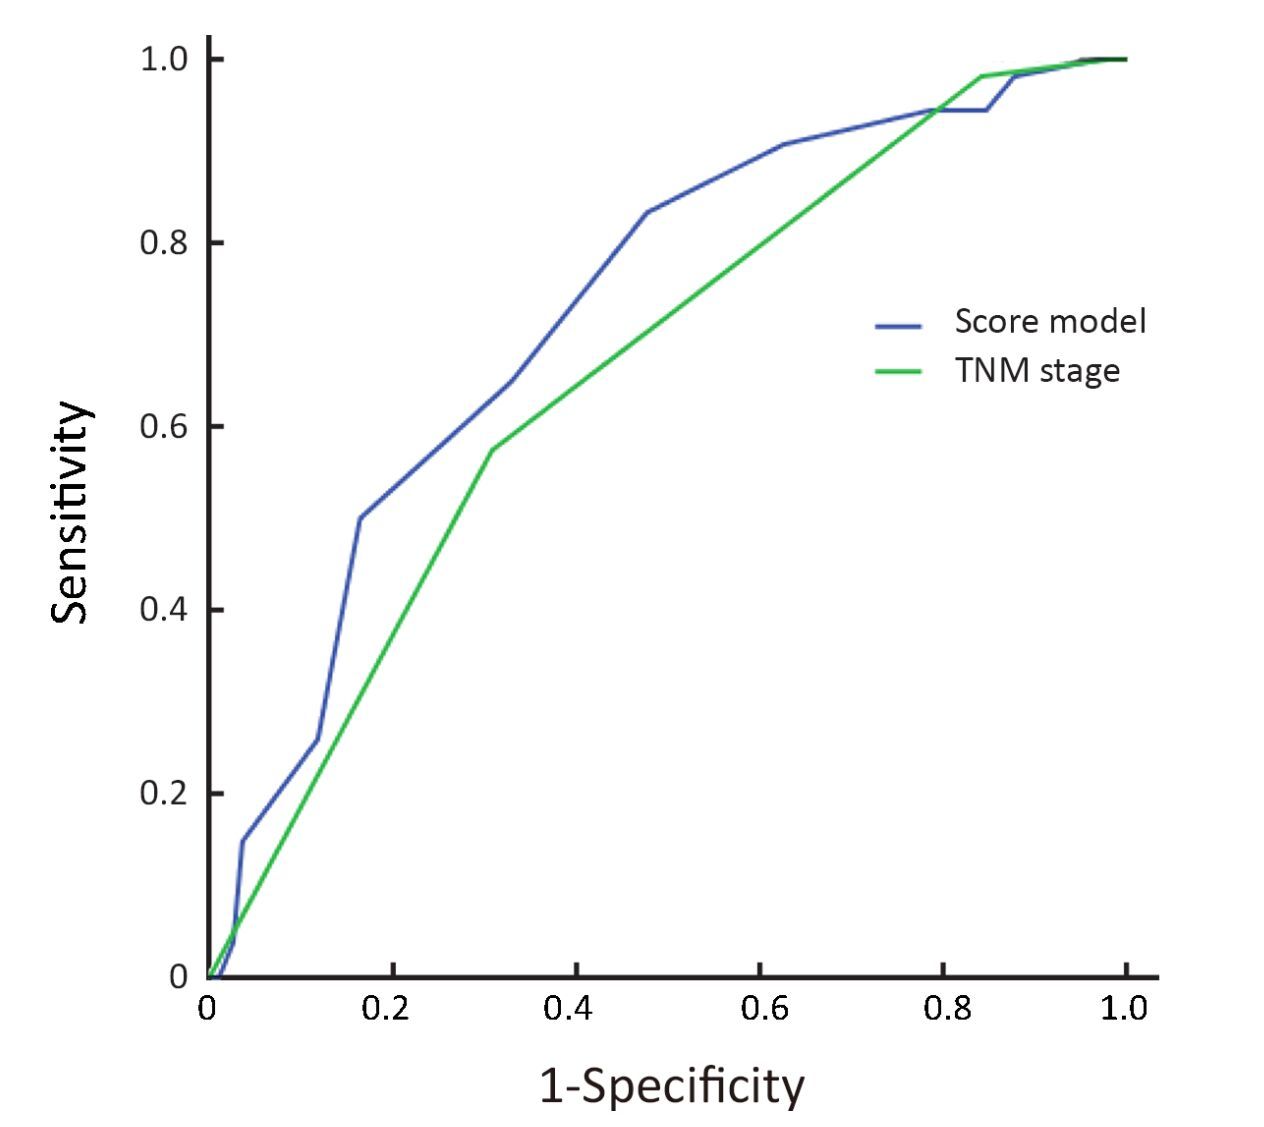
The prediction efficiency on 5-year DSS of our prognostic score model was compared with that of UICC/AJCC TNM staging system (7th edition). The ROC curves of the two systems are shown in Figure 3. AUC of our prognosis score model was larger than that of the 7th edition of UICC/AJCC TNM stage (0.726 vs. 0.661, P=0.023).
Discussion
CBC is a practical laboratory examination which is now routinely performed, but it had the capabilities to reflect the biological characteristics of tumor cells indirectly. As we know, Hb is the main natural carrier of oxygen in blood (23). And hypoxia in microenvironment of tumor cells is known as one of the main causes of acquired radioresistance, which can bring poor local control (24). So decrease of blood Hb concentration might result in hypoxia and radioresistance. In fact, Hb decline has been proved to be an independent risk factor of poor clinical outcome for cancer patients treated with RT, not only in NPC (12, 25-27). Moreover, it has been revealed by laboratory studies that inflammatory cells, such as neutrophils, lymphocytes and platelets, could enhance the proliferating and metastatic abilities of tumor cells (28). And metastatic ability of tumor cells is considered to play an important role in distant metastasis of NPC (29). Hence, elevated level of these inflammatory cells might affect prognosis adversely. That has already been demonstrated by many clinical studies in a series of solid tumors including NPC (13, 14, 30-33). In a word, combining CBC with TNM stage is very useful for building a more accurate predicting system of NPC patients' individualized outcomes.
Recently we published a prognostic score model for predicting the 5-year DSS of patients diagnosed with non-metastatic NPC (11). The model was a combination of T and N stage of the tumor, gender and age of a patient, and CBC indexes. Current UICC/AJCC staging systems of cancer do not incorporate the functional factors, especially CBC, as the model does (9). Furthermore, not only did we involve the static values of CBC such as HbDRT, but we also involved the dynamic changes like HbCD. In our previous study, the model was verified in an independent cohort of patients treated with non-IMRT technique to have higher prediction efficiency than TNM stage through comparison of AUC of ROC curves (0.697 vs. 0.619, P<0.001) (11). In this analysis, a similar result was achieved in another cohort of patients, which consisted of those treated with non-IMRT technique and those treated with IMRT. The AUC for the model and TNM stage were 0.726 and 0.661 (P=0.023), respectively. These results indicated that the model might be generalizable to a new and independent population of patients, and applicable even in the era of IMRT.
Nowadays the standard treatment for locoregionally advanced NPC was CCRT (34). The treatment effect is relatively ideal (1). However, local recurrence (5-year recurrence rate, 13.9%) and distant metastasis (5-year metastasis rate, 12.8%) still exist (35). Particularly, distant metastases are the major causes of failure. More than 30% of the patients with locoregionally advanced diseases eventually died of distant failure (2). The prompt appearance and progression of distant metastases after RT indicated that the potential subclinical micrometastases might already exist at diagnosis. And the intensity of CCT which mainly aims to enhance the radiosensitivity of the primary tumor might not be effective enough to eradicate the subclinical metastases. A more intensive systemic therapy such as ACT might be needed. But a certain conclusion of the impact of ACT on locoregionally advanced NPC is still unable to make, through the results of the studies so far (36-38). And ACT plus CCRT was proved to cause more acute adverse reactions such as severe bone marrow suppression and gastrointestinal reactions, compared with CCRT alone (38).
These facts all highlight the importance of making individualized treatment strategies, in which patients really at high risk for distant metastasis and death are given ACT. Yet an individualized risk-prediction model which could classify NPC patients, especially those with the same clinical stage, into populations with different levels of risk is an essential prerequisite for individualized treatment. Our CBC-based score model divided non-metastatic NPC patients into three categories with low, intermediate and high risk for death. In our previous study, the three categories of patients appeared to be have different 5-year DSS (96% vs. 78% vs. 52%, P<0.001 between any two categories) (11). We repeated external verification of the model through data of a prospective study this time. Though statistical difference was not achieved in 5-year DSS between the low-risk patients and the intermediate-risk patients (96.0% vs. 79.1%, P=0.049). The low-and intermediate-risk patients were both seen to have better 5-year DSS than the high-risk patients (96.0% vs. 62.2%, P<0.001; 79.1% vs. 62.2%, P=0.005). The results of this analysis provided evidences that the model was accurate in estimating DSS. And the high-risk patients in the model might be the suitable population for ACT after radical RT. In other words, our model could help to pick out those who would benefit from ACT.
Actually, some oncological physicians also established models to determine who should be applied ACT, such as the model of Chen et al. on basis of age, N stage, Hb and lactate dehydrogenase (39). Nevertheless, compared with these models, our model has several advantages. First of all, as we know, prospective data do not have limitations like retrospective data, such as selection bias and information bias. The model involved predictors representing anatomical regions of tumor invasion, clinical features of the patients, radioresistant and metastatic abilities of cancer cells, which confer it greater power on predicting prognosis. Additionally, the scoring method of our model is quantitative and user-friendly, which is also a strength.
Indeed, there were some limitations to be acknowledged. First, not all the patients in this analysis received IMRT. But in this analysis, there was no difference between the patients treated with IMRT and the ones treated with 2DCRT, either in the 5-year DSS (85.5% vs. 75.6%, P=0.067) or in the 5-year overall survival (OS, 84.1% vs. 74.4%, P=0.079). Actually, though IMRT has superiorities in improving local control and reducing late toxicities, compared with 2DCRT, its impact on the DSS or the OS remains controversial through studies up to now (40, 41). Second, as we discussed above, EBV-DNA was one of the important risk factors for the prediction of distant metastasis and should be taken into consideration. However, EBV-DNA was not included in this analysis largely due to laboratory conditions at that time. And involvement of the genes, the expression of which was related to inherited radioresistance, such as deoxyribonucleic acid-dependent protein kinase, might improve the prediction capacity of our model. Third, it was a single-institutional study with a small size of sample. The difference between the low-and the intermediate-risk patients in the 5-year DSS might be a false-negative result caused by the small sample size. To promote the popularization of the model, a further multi-center prospective study in a large scale of patients treated with IMRT is being conducted by us to resolve these shortcomings.
Conclusions
We revalidated the CBC-based prognostic score model built in our previous work through data of a prospective study. The model was also proved to be superior to TNM staging system on prediction efficiency. The model may be useful to clinicians for improving prediction of individual outcomes and screening patients potentially suitable for subsequent ACT.
Acknowledgements
Funding: This study was supported by Hi-Tech Research and Development Program of China (863 Program) (No. 2006AA02Z4B4). The funding sources had no role in the study design, data collection, analysis, interpretation or writing of the manuscript. We are grateful to Dr. Yu Lin (Editorial Office of Journal of Nasopharyngeal Carcinoma, Asia Press, Hong Kong, China) for his technical help with the statistical analysis for this analysis.
Footnote
Conflicts of Interest: The authors have no conflicts of interest to declare.
References
- Wei KR, Zheng RS, Zhang SW, et al. Nasopharyngeal carcinoma incidence and mortality in China in 2010. Chin J Cancer 2014;33:381–7. [PubMed] DOI:10.5732/cjc.014.10086
- NCCN Clinical Practical Guidelines in Oncology. Head and Neck Cancers, Version 2. 2015. Available at: http://www.nccn.org/professionals/physician_gls/pdf/head-and-neck.pdf
- Lai SZ, Li WF, Chen L, et al. How does intensity-modulated radiotherapy versus conventional two-dimensional radiotherapy influence the treatment results in nasopharyngeal carcinoma patients?. Int J Radiat Oncol Biol Phys 2011;80:661–8. [PubMed] DOI:10.1016/j.ijrobp.2010.03.024
- Zheng W, Zong J, Huang C, et al. Multimodality treatment may improve the survival rate of patients with metastatic nasopharyngeal carcinoma with good performance status. PLoS One 2016;11:e0146771. [PubMed] DOI:10.1371/journal.pone.0146771
- Guo Q, Lu T, Lin S, et al. Long-term survival of nasopharyngeal carcinoma patients with stage II in intensity-modulated radiation therapy era. Jpn J Clin Oncol 2016;46:241–7. [PubMed] DOI:10.1093/jjco/hyv192
- Li G, Gao J, Tao YL, et al. Increased pretreatment levels of serum LDH and ALP as poor prognostic factors for nasopharyngeal carcinoma. Chin J Cancer 2012;31:197–206. [PubMed] DOI:10.5732/cjc.011.10283
- Huang TL, Chien CY, Tsai WL, et al. Long-term late toxicities and quality of life for survivors of nasopharyngeal carcinoma treated with intensity-modulated radiotherapy versus non-intensity-modulated radiotherapy. Head Neck 2016;38:E1026–32. [PubMed] DOI:10.1002/hed.24150
- Hong JS, Tian J, Han QF, et al. Quality of life of nasopharyngeal cancer survivors in China. Curr Oncol 2015;22:e142–7. [PubMed] DOI:10.3747/co.22.2323
- Edge S, Byrd DR, Compton CC, et al. AJCC Cancer Staging Manual. 7th edition. Berlin: Springer, 2010.
- Cho WC. Nasopharyngeal carcinoma: Molecular biomarker discovery and progress. Mol Cancer 2007;6:1. [PubMed]
- Chang H, Gao J, Xu BQ, et al. Haemoglobin, neutrophil to lymphocyte ratio and platelet count improve prognosis prediction of the TNM staging system in nasopharyngeal carcinoma: development and validation in 3, 237 patients from a single institution. Clin Oncol (R Coll Radiol) 2013;25:639–46. [PubMed] DOI:10.1016/j.clon.2013.07.004
- Chua DT, Sham JS, Choy DT. Prognostic impact of hemoglobin levels on treatment outcome in patients with nasopharyngeal carcinoma treated with sequential chemoradiotherapy or radiotherapy alone. Cancer 2004;101:307–16. [PubMed] DOI:10.1002/(ISSN)1097-0142
- An X, Ding PR, Wang FH, et al. Elevated neutrophil to lymphocyte ratio predicts poor prognosis in nasopharyngeal carcinoma. Tumour Biol 2011;32:317–24. [PubMed] DOI:10.1007/s13277-010-0124-7
- Gao J, Zhang HY, Xia YF. Increased platelet count is an indicator of metastasis in patients with nasopharyngeal carcinoma. Tumour Biol 2013;34:39–45. [PubMed] DOI:10.1007/s13277-012-0508-y
- Wang HY, Sun BY, Zhu ZH, et al. Eight-signature classifier for prediction of nasopharyngeal carcinoma survival. J Clin Oncol 2011;29:4516–25. [PubMed] DOI:10.1200/JCO.2010.33.7741
- Yang L, Hong S, Wang Y, et al. Development and external validation of nomograms for predicting survival in nasopharyngeal carcinoma patients after definitive radiotherapy. Sci Rep 2015;5:15638. [PubMed] DOI:10.1038/srep15638
- Du XJ, Tang LL, Chen L, et al. Neoadjuvant chemotherapy in locally advanced nasopharyngeal carcinoma: defining high-risk patients who may benefit before concurrent chemotherapy combined with intensity-modulated radiotherapy. Sci Rep 2015;5:16664. [PubMed] DOI:10.1038/srep16664
- Gao J, Tao YL, Li G, et al. Involvement of difference in decrease of hemoglobin level in poor prognosis of Stage I and II nasopharyngeal carcinoma: implication in outcome of radiotherapy. Int J Radiat Oncol Biol Phys 2012;82:1471–8. [PubMed] DOI:10.1016/j.ijrobp.2011.05.009
- de Benoist B, McLean E, Egli I, et al. Worldwide prevalence of anaemia 1993-2005. WHO Global Database on Anaemia. Geneva: World Health Organization, 2008.
- Hu C, Chen R, Chen W, et al. Thrombocytosis is a significant indictor of hypercoagulability, prognosis and recurrence in gastric cancer. Exp Ther Med 2014;8:125–32. [PubMed] DOI:10.3892/etm.2014.1699
- DeLong ER, DeLong DM, Clarke-Pearson DL. Comparing the areas under two or more correlated receiver operating characteristic curves: a nonparametric approach. Biometrics 1988;44:837–45. [PubMed] DOI:10.2307/2531595
- Logan BR, Wang H, Zhang MJ. Pairwise multiple comparison adjustment in survival analysis. Stat Med 2005;24:2509–23. [PubMed] DOI:10.1002/(ISSN)1097-0258
- Linberg R, Conover CD, Shum KL, et al. Hemoglobin based oxygen carriers: how much methemoglobin is too much?. Artif Cells Blood Substit Immobil Biotechnol 1998;26:133–48. [PubMed] DOI:10.3109/10731199809119772
- Horsman MR, Overgaard J. The impact of hypoxia and its modification of the outcome of radiotherapy. J Radiat Res 2016;57:i90–i98. [PubMed] DOI:10.1093/jrr/rrw007
- Rades D, Stoehr M, Kazic N, et al. Locally advanced stage IV squamous cell carcinoma of the head and neck: impact of pre-radiotherapy hemoglobin level and interruptions during radiotherapy. Int J Radiat Oncol Biol Phys 2008;70:1108–14. [PubMed] DOI:10.1016/j.ijrobp.2007.07.2380
- Thakur P, Seam RK, Gupta MK, et al. Comparison of effects of hemoglobin levels upon tumor response among cervical carcinoma patients undergoing accelerated hyperfractionated radiotherapy versus cisplatin chemoradiotherapy. Asian Pac J Cancer Prev 2015;16:4285–9. [PubMed] DOI:10.7314/APJCP.2015.16.10.4285
- Metindir J, Bilir Dilek G. Preoperative hemoglobin and platelet count and poor prognostic factors in patients with endometrial carcinoma. J Cancer Res Clin Oncol 2009;135:125–9. [PubMed] DOI:10.1007/s00432-008-0430-2
- Coussens LM, Werb Z. Inflammation and cancer. Nature 2002;420:860–7. [PubMed] DOI:10.1038/nature01322
- Li ZQ, Xia YF, Liu Q, et al. Radiotherapy-related typing in 842 patients in canton with nasopharyngeal carcinoma. Int J Radiat Oncol Biol Phys 2006;66:1011–6. [PubMed] DOI:10.1016/j.ijrobp.2006.06.028
- Walsh SR, Cook EJ, Goulder F, et al. Neutrophil-lymphocyte ratio as a prognostic factor in colorectal cancer. J Surg Oncol 2005;91:181–4. [PubMed] DOI:10.1002/(ISSN)1096-9098
- He W, Yin C, Guo G, et al. Initial neutrophil lymphocyte ratio is superior to platelet lymphocyte ratio as an adverse prognostic and predictive factor in metastatic colorectal cancer. Med Oncol 2013;30:439. [PubMed] DOI:10.1007/s12032-012-0439-x
- Lou XL, Sun J, Gong SQ, et al. Interaction between circulating cancer cells and platelets: clinical implication. Chin J Cancer Res 2015;27:450–60. [PubMed] DOI:10.3978/j.issn.1000-9604.2015.04.10
- Ochmański W. Influence of antiplatelet drugs (AD) on the effectiveness of combined therapy of small cell lung cancer. Part II . Influence of treatment on time of remission and patients survival. Przegl Lek (in Polish) 2008;65:321–8.
- Wei WI, Kwong DL. Current management strategy of nasopharyngeal carcinoma. Clin Exp Otorhinolaryngol 2010;3:1–12. [PubMed] DOI:10.3342/ceo.2010.3.1.1
- Ng WT, Lee MC, Hung WM, et al. Clinical outcomes and patterns of failure after intensity-modulated radiotherapy for nasopharyngeal carcinoma. Int J Radiat Oncol Biol Phys 2011;79:420–8. [PubMed] DOI:10.1016/j.ijrobp.2009.11.024
- Chen L, Hu CS, Chen XZ, et al. Concurrent chemoradiotherapy plus adjuvant chemotherapy versus concurrent chemoradiotherapy alone in patients with locoregionally advanced nasopharyngeal carcinoma: a phase 3 multicentre randomised controlled trial. Lancet Oncol 2012;13:163–71. [PubMed] DOI:10.1016/S1470-2045(11)70320-5
- Lin CC, Chen TT, Lin CY, et al. Prognostic analysis of adjuvant chemotherapy in patients with nasopharyngeal carcinoma. Future Oncol 2013;9:1469–76. [PubMed] DOI:10.2217/fon.13.100
- Dong YY, Xiang C, Lu JX, et al. Concurrent chemoradiotherapy plus adjuvant chemotherapy versus concurrent chemoradiotherapy in locoregionally advanced nasopharyngeal carcinoma: A matched-pair multicenter analysis of outcomes. Strahlenther Onkol 2016;192:394–402. [PubMed] DOI:10.1007/s00066-016-0970-3
- Chen C, Chen S, Le QT, et al. Prognostic model for distant metastasis in locally advanced nasopharyngeal carcinoma after concurrent chemoradiotherapy. Head Neck 2015;37:209–14. [PubMed] DOI:10.1002/hed.v37.2
- Peng G, Wang T, Yang KY, et al. A prospective, randomized study comparing outcomes and toxicities of intensity-modulated radiotherapy vs. conventional two-dimensional radiotherapy for the treatment of nasopharyngeal carcinoma. Radiother Oncol 2012;104:286–93. [PubMed] DOI:10.1016/j.radonc.2012.08.013
- Zhang B, Mo Z, Du W, et al. Intensity-modulated radiation therapy versus 2D-RT or 3D-CRT for the treatment of nasopharyngeal carcinoma: A systematic review and meta-analysis. Oral Oncol 2015;51:1041–6. [PubMed] DOI:10.1016/j.oraloncology.2015.08.005