
Early prediction of pathological outcomes to neoadjuvant chemotherapy in breast cancer patients using automated breast ultrasound
Abstract
Objective: Early assessment of response to neoadjuvant chemotherapy (NAC) for breast cancer allows therapy to be individualized. The optimal assessment method has not been established. We investigated the accuracy of automated breast ultrasound (ABUS) to predict pathological outcomes after NAC.
Methods: A total of 290 breast cancer patients were eligible for this study. Tumor response after 2 cycles of chemotherapy was assessed using the product change of two largest perpendicular diameters (PC) or the longest diameter change (LDC). PC and LDC were analyzed on the axial and the coronal planes respectively. Receiver operating characteristic (ROC) curves were used to evaluate overall performance of the prediction methods. Youden's indexes were calculated to select the optimal cut-off value for each method. Sensitivity, specificity, positive and negative predictive values (PPV and NPV) and the area under the ROC curve (AUC) were calculated accordingly.
Results: ypT0/is was achieved in 42 patients (14.5%) while ypT0 was achieved in 30 patients (10.3%) after NAC. All four prediction methods (PC on axial planes, LDC on axial planes, PC on coronal planes and LDC on coronal planes) displayed high AUCs (all>0.82), with the highest of 0.89 [95% confidence interval (95% CI), 0.83-0.95] when mid-treatment ABUS was used to predict final pathological complete remission (pCR). High sensitivities (85.7%-88.1%) were observed across all four prediction methods while high specificities (81.5%-85.1%) were observed in two methods used PC. The optimal cut-off values defined by our data replicate the WHO and the RECIST criteria. Lower AUCs were observed when mid-treatment ABUS was used to predict poor pathological outcomes.
Conclusions: ABUS is a useful tool in early evaluation of pCR after NAC while less reliable when predicting poor pathological outcomes.
Keywords: Automated breast ultrasound; breast neoplasms; drug monitoring; neoadjuvant therapy; pathological complete remission; ultrasonography
Submitted Apr 09, 2016. Accepted for publication Aug 29, 2016.
doi: 10.21147/j.issn.1000-9604.2016.05.02
Introduction
Breast cancer is one of the most common cancers in females worldwide. Recent study showed an incidence of over 46 per 100,000 in urban areas in China (1). Neoadjuvant chemotherapy (NAC) is widely adopted to treat locally advanced breast cancer patients and some early breast cancer patients in recent years. A key advantage of NAC is the opportunity to assess response early during treatment as a predictor of final pathological response (2). Tumor response to chemotherapy may vary, and physical examination was the gold standard for assessing tumor response (3). Recently magnetic resonance imaging (MRI) showed some promising but inconclusive results. Ultrasound (US) is also frequently used for tumor monitoring.
However, US is highly operator dependent and has some problems with reproducibility. Automated breast ultrasound (ABUS) collects and stores image data in a digital fashion, each sectional plane of the saved volume can be visualized and reviewed repeatedly, thereby avoiding the investigator-dependence and non-standardized documentation. In addition, the generated coronal plane may offer new diagnostic information (4). It was proposed that ABUS may be used to monitor breast cancer patients treated with NAC (5).
We investigated the hypothesis that ABUS can circumvent the major limitations of conventional US and proportional change of primary tumor measured by ABUS after 2 cycles of NAC can reliably predict pathological outcomes after 4 cycles.
Methods
Patients and chemotherapy regimens
In 2010, we initiated a randomized clinical trial of comparative efficacy of three anthracycline-based NAC regimens for primary breast cancer which enrolled 501 patients (NCT01199432). The trial recruited histologically confirmed primary breast cancer patients whose disease stage (T1-3, N0-2, M0) was appropriate for NAC and received no previous treatment. Participants were randomly assigned to one of three treatment arms. The CEFci arm: 5-Fu 200 mg/m2 per day from d 1 to d 21 (continuous intravenous infusion); epirubicin 100 mg/m2 and cyclophosphamide 600 mg/m2 on d 1. The CEF arm: 5-Fu 600 mg/m2 (intravenous bolus), epirubicin 100 mg/m2 and cyclophosphamide 600 mg/m2 on d 1. The EC arm: epirubicin 100 mg/m2 and cyclophosphamide 600 mg/m2 on d 1. All patients received chemotherapy every 21 days for 4 cycles before surgery. The trial was approved by the Ethics Committee of Peking University Cancer Hospital and informed consent was obtained from each participant. The primary objective of the trial is pathological complete response (pCR) rates. As part of the study, ABUS image data before chemotherapy and prior to surgery were obtained for all enrolled patients. Additional ABUS image data after 2 cycles of chemotherapy were available in 290 of the 501 enrolled patients with unicentric disease. These 290 patients were included in the present analysis.
Automated Breast Ultrasound System (Somo-V, U-Systems, Sunnyvale, CA, USA) is a computer-based system for evaluating the whole breast. The system is used in combination with 6-14 MHz broadband mechanical transducers attached to a rigid compression plate and arm. A technician maintains appropriate contact pressure and vertical orientation to the breast surface. Sonographic images of the medial, central and lateral parts of the examined breast are collected. The mechanical arm controls the moving speed and position of the transducer. Over 300 images can be produced per acquisition and reconstructed coronal images from the skin to the chest wall can also be obtained. The radiologists can view breast images in the coronal, sagittal and axial planes simultaneously.
Chemotherapy response assessment with ABUS
All the ABUS measurements were made by one operator (XGW) who had 7 years of experience in breast US and over 1 year of experience in ABUS. He was blinded to the 2D US and clinical findings.
ABUS response after the first two cycles was assessed using the product change of two largest perpendicular diameters (PC) or the longest diameter change (LDC). For each of the 290 participants, ABUS tumor measurements were performed separately on the axial plane as well as the reconstructed coronal plane. Four prediction methods (PC on axial planes, LDC on axial planes, PC on coronal planes and LDC on coronal planes) were analyzed.
Pathological assessment criteria
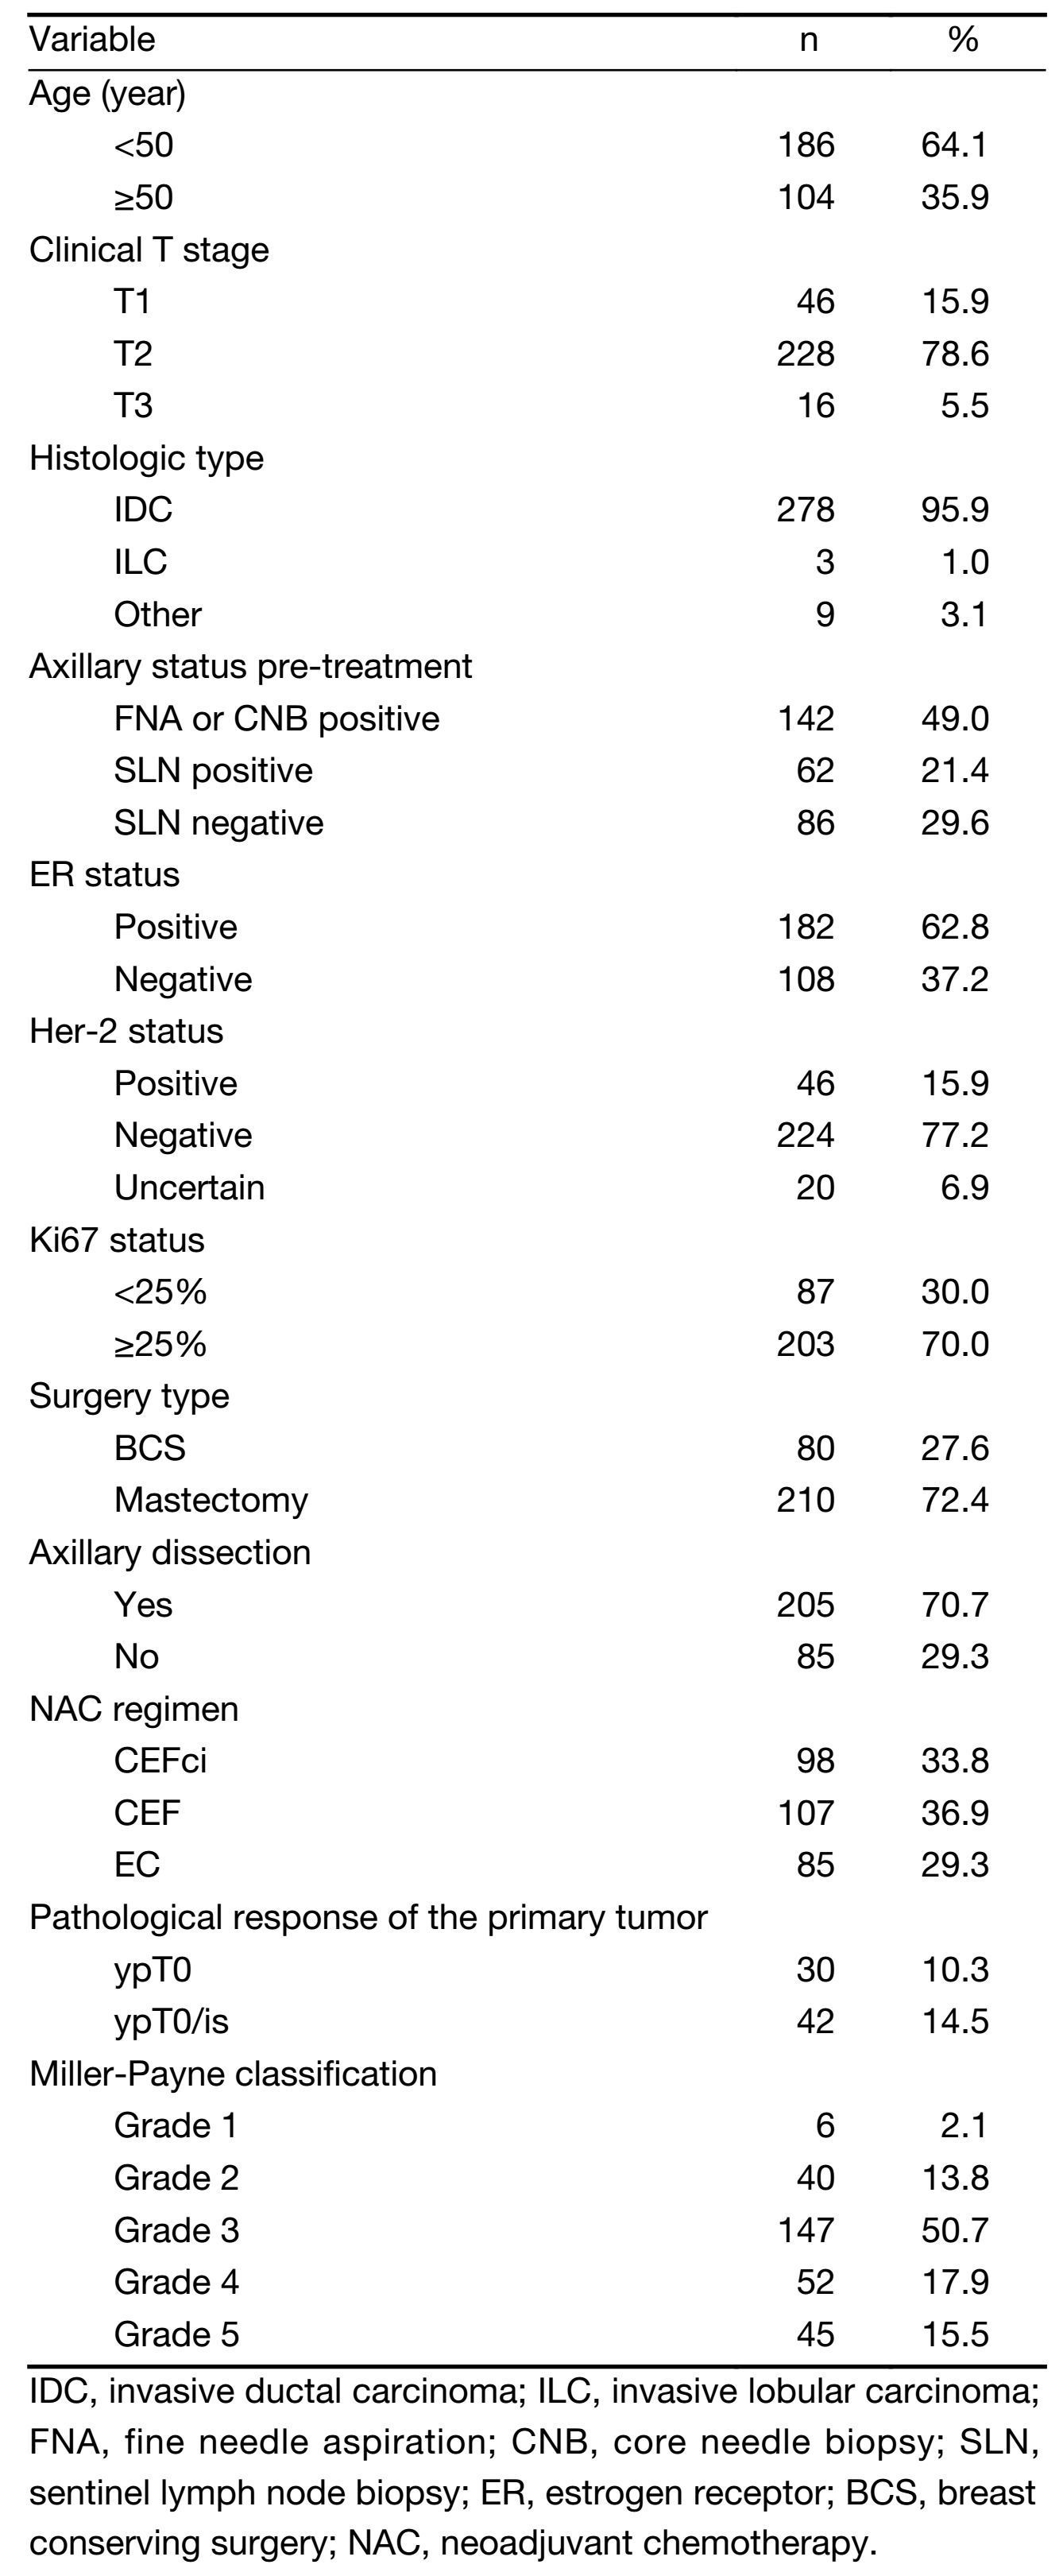
pCR of the breast was defined as no evidence of residual invasive cancer left in the primary breast tumor with or without residual ductal carcinoma in situ (DCIS). In addition, Miller-Payne classification (6) data derived from surgical specimen were collected for each of the participants (grade 1: no reduction in tumor cellularity; grade 2: reduction in tumor cellularity ≤30%; grade 3: reduction in tumor cellularity 30%-90%; grade 4: reduction in tumor cellularity ≥90%; grade 5: no residual invasive cancer).
Statistical analysis
Diagnostic performance was assessed using the receiver operating characteristic (ROC) curve. Youden’s index (J=sensitivity+specificity−1) was calculated for all points of an ROC curve, and the maximum value of the index was used as a criterion for selecting the optimum cut-off point. For calculated optimal cut-off point of each prediction method, sensitivity, specificity, positive and negative predictive values (PPV and NPV) were calculated accordingly. Statistical analysis was performed using SPSS software version 15.0 (SPSS Inc., Chicago, IL, USA). All statistical tests were two-sided and at the 0.05 significance level.
Results
Patient characteristics and treatments
Patient and tumor characteristics of the 290 enrolled patients are listed in Table 1. The median age was 47 years old (range: 22-67 years old). The majority of patients had T2 tumors (78.6%), and invasive ductal carcinoma was the predominant histologic type (95.9%). Two hundred and four (70.3%) patients were pathologically proven to be node-positive pre-treatment, and 210 (72.4%) patients received mastectomy rather than breast conserving surgery.
Full table
Pathological outcomes
pCR-breast (ypT0/is) was achieved in 42 of the 290 patients (14.5%) while ypT0 in 30 patients (10.3%) after 4 cycles of NAC. Tumor response according to the Miller-Payne classification is listed in Table 1. One hundred and ninety-three (66.6%) patients had grade 1 to 3 tumors after 4 cycles of chemotherapy, and 97 (33.4%) patients had grade 4/5 tumors.
Overall performance of ABUS for predicting pCR
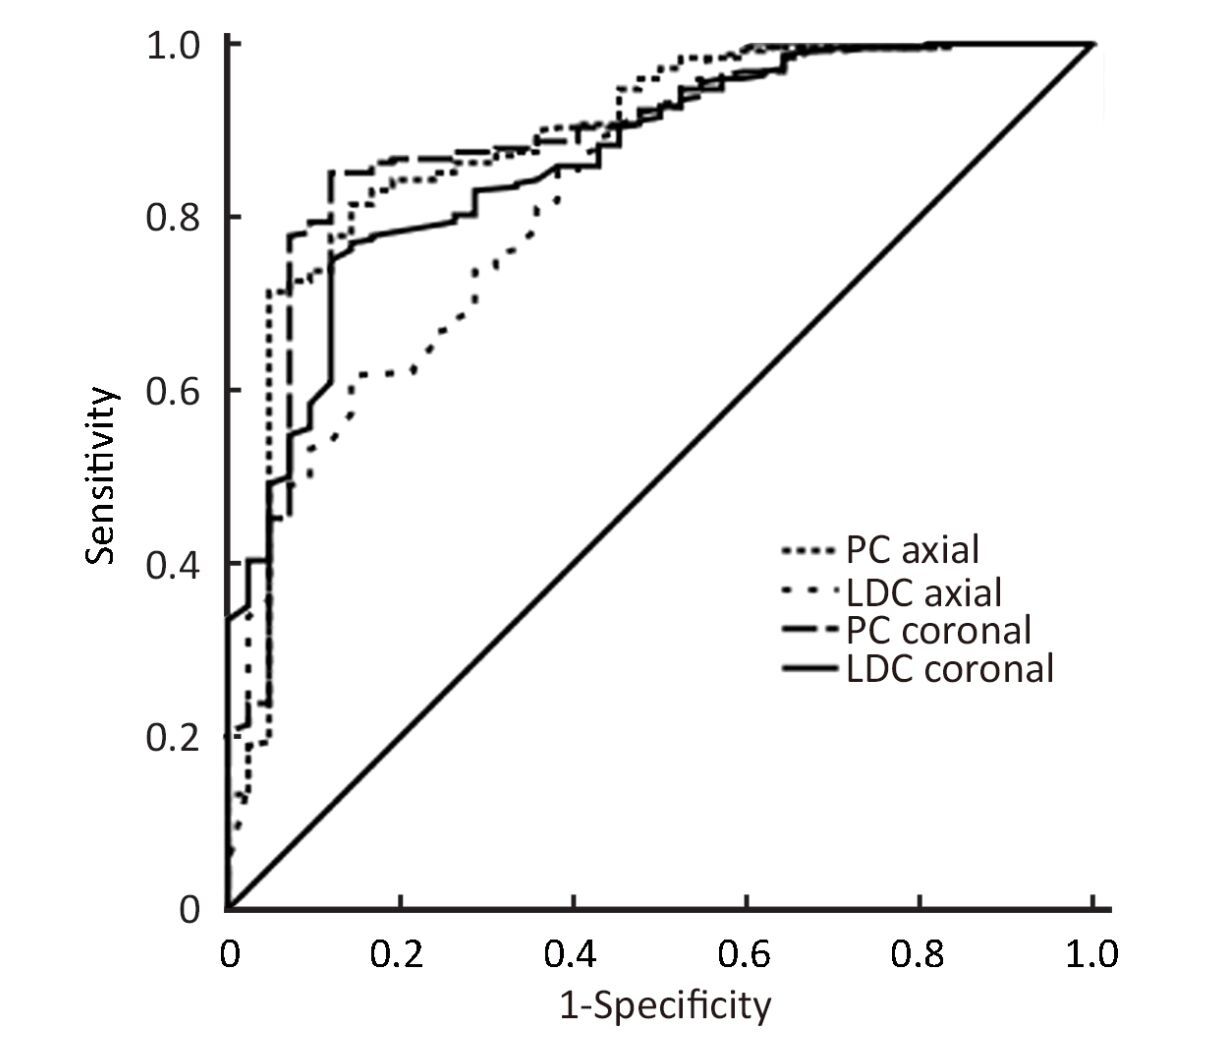
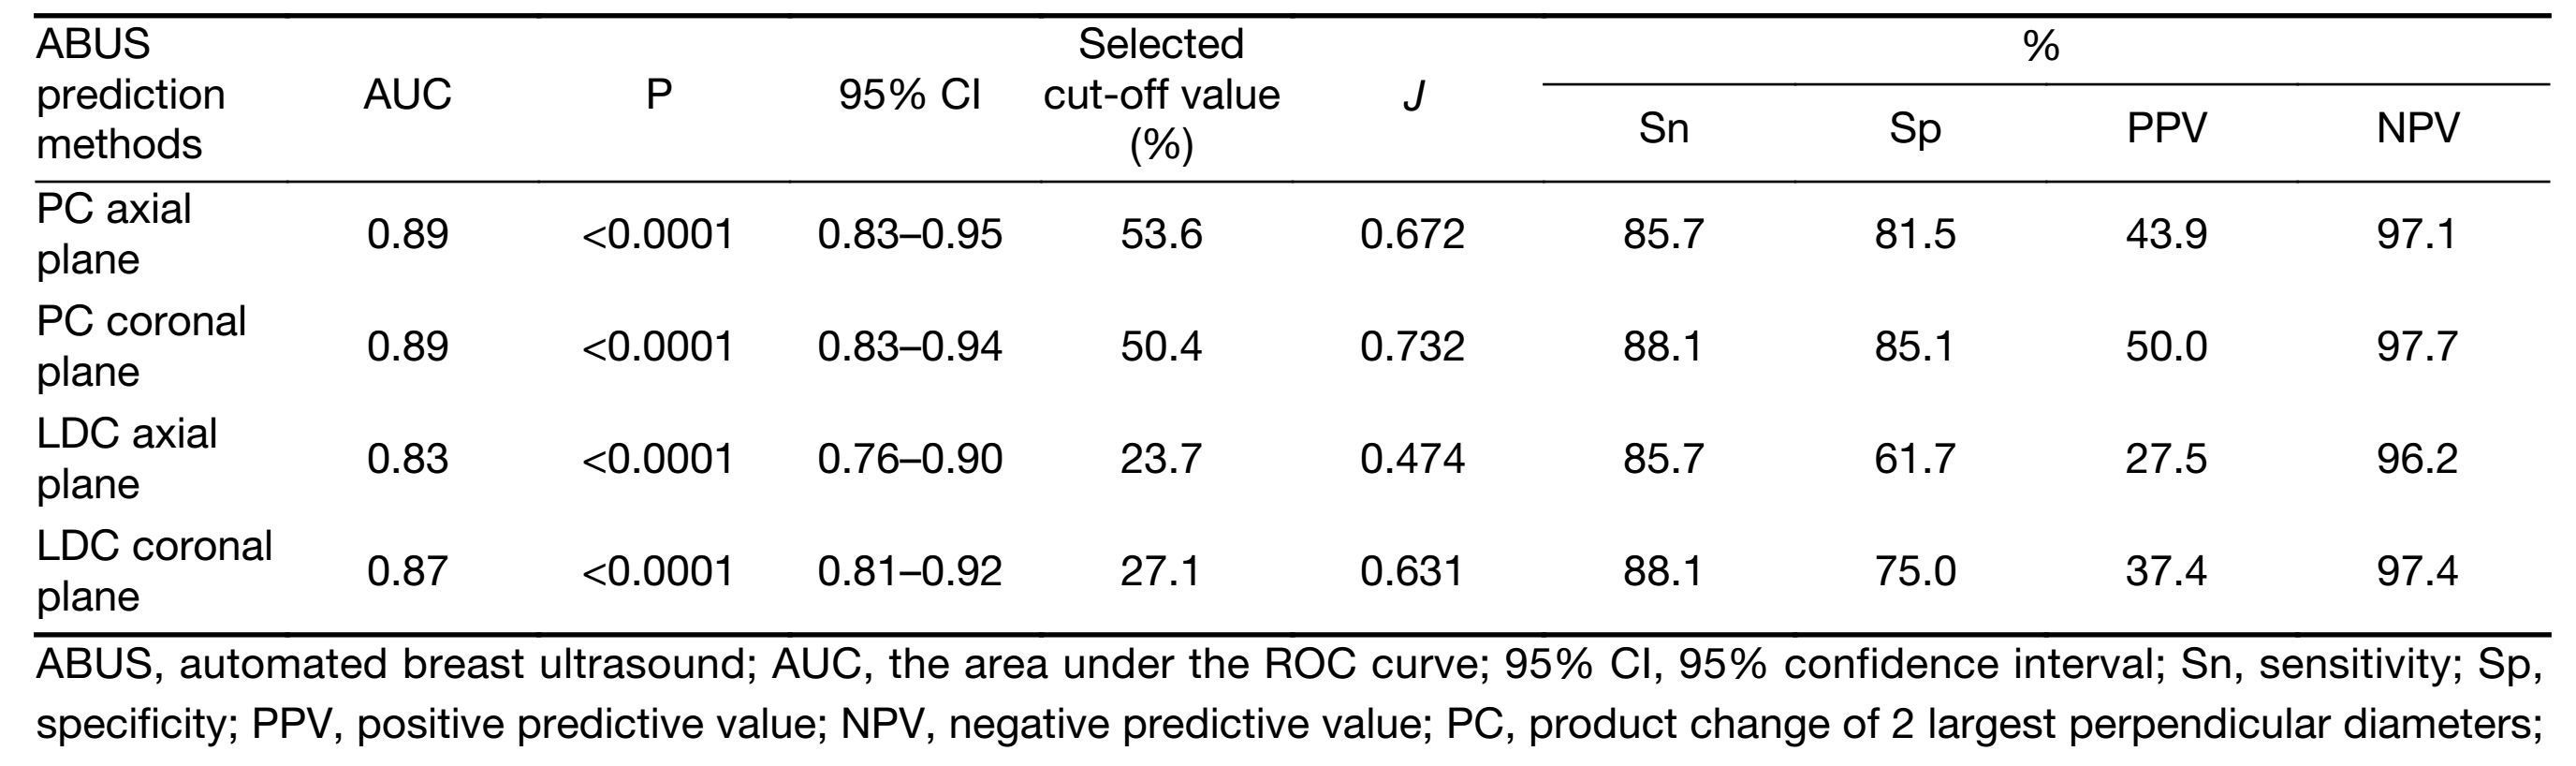
The overall performances of four methods for the prediction of pCR after 4 cycles were evaluated. All four methods yielded high AUCs (all >0.82), with the highest AUC of 0.89 [95% confidence interval (95% CI), 0.83-0.95] (Figure 1). There was no statistical significance among the four methods (P=0.263). For all the selected cut-off values, sensitivities, specificities, PPVs and NPVs were calculated accordingly. Similar high sensitivities (85.7%-88.1%) were observed across all four prediction methods. High specificities were also observed in prediction methods using PC (81.5%-85.1%) but relatively low specificities (61.7%-75.0%) were observed in methods using LDC (Table 2).
Full table
Overall performance of ABUS for predicting poor pathological response
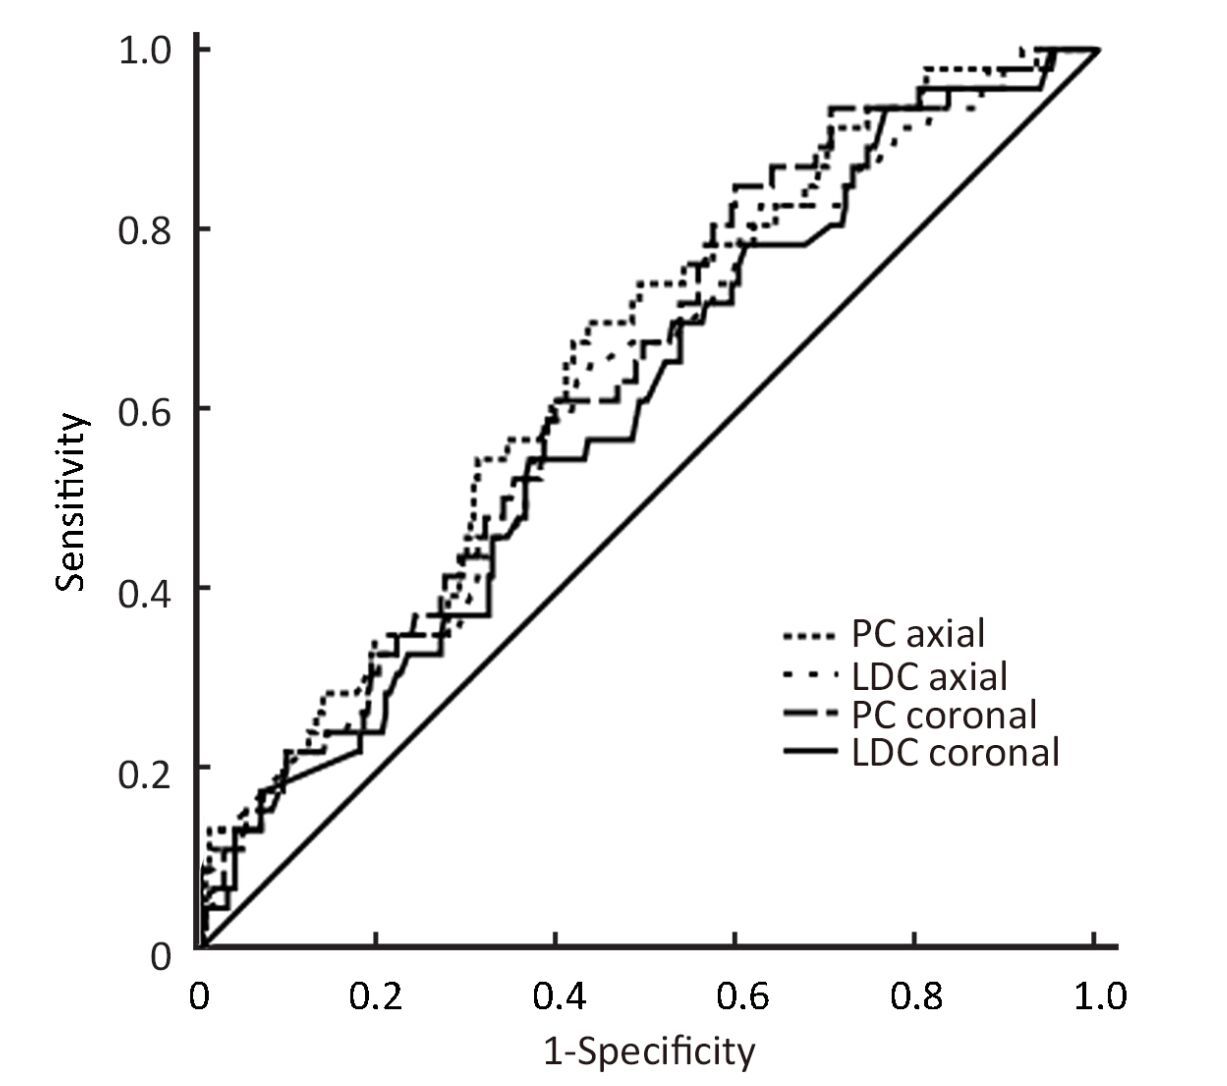
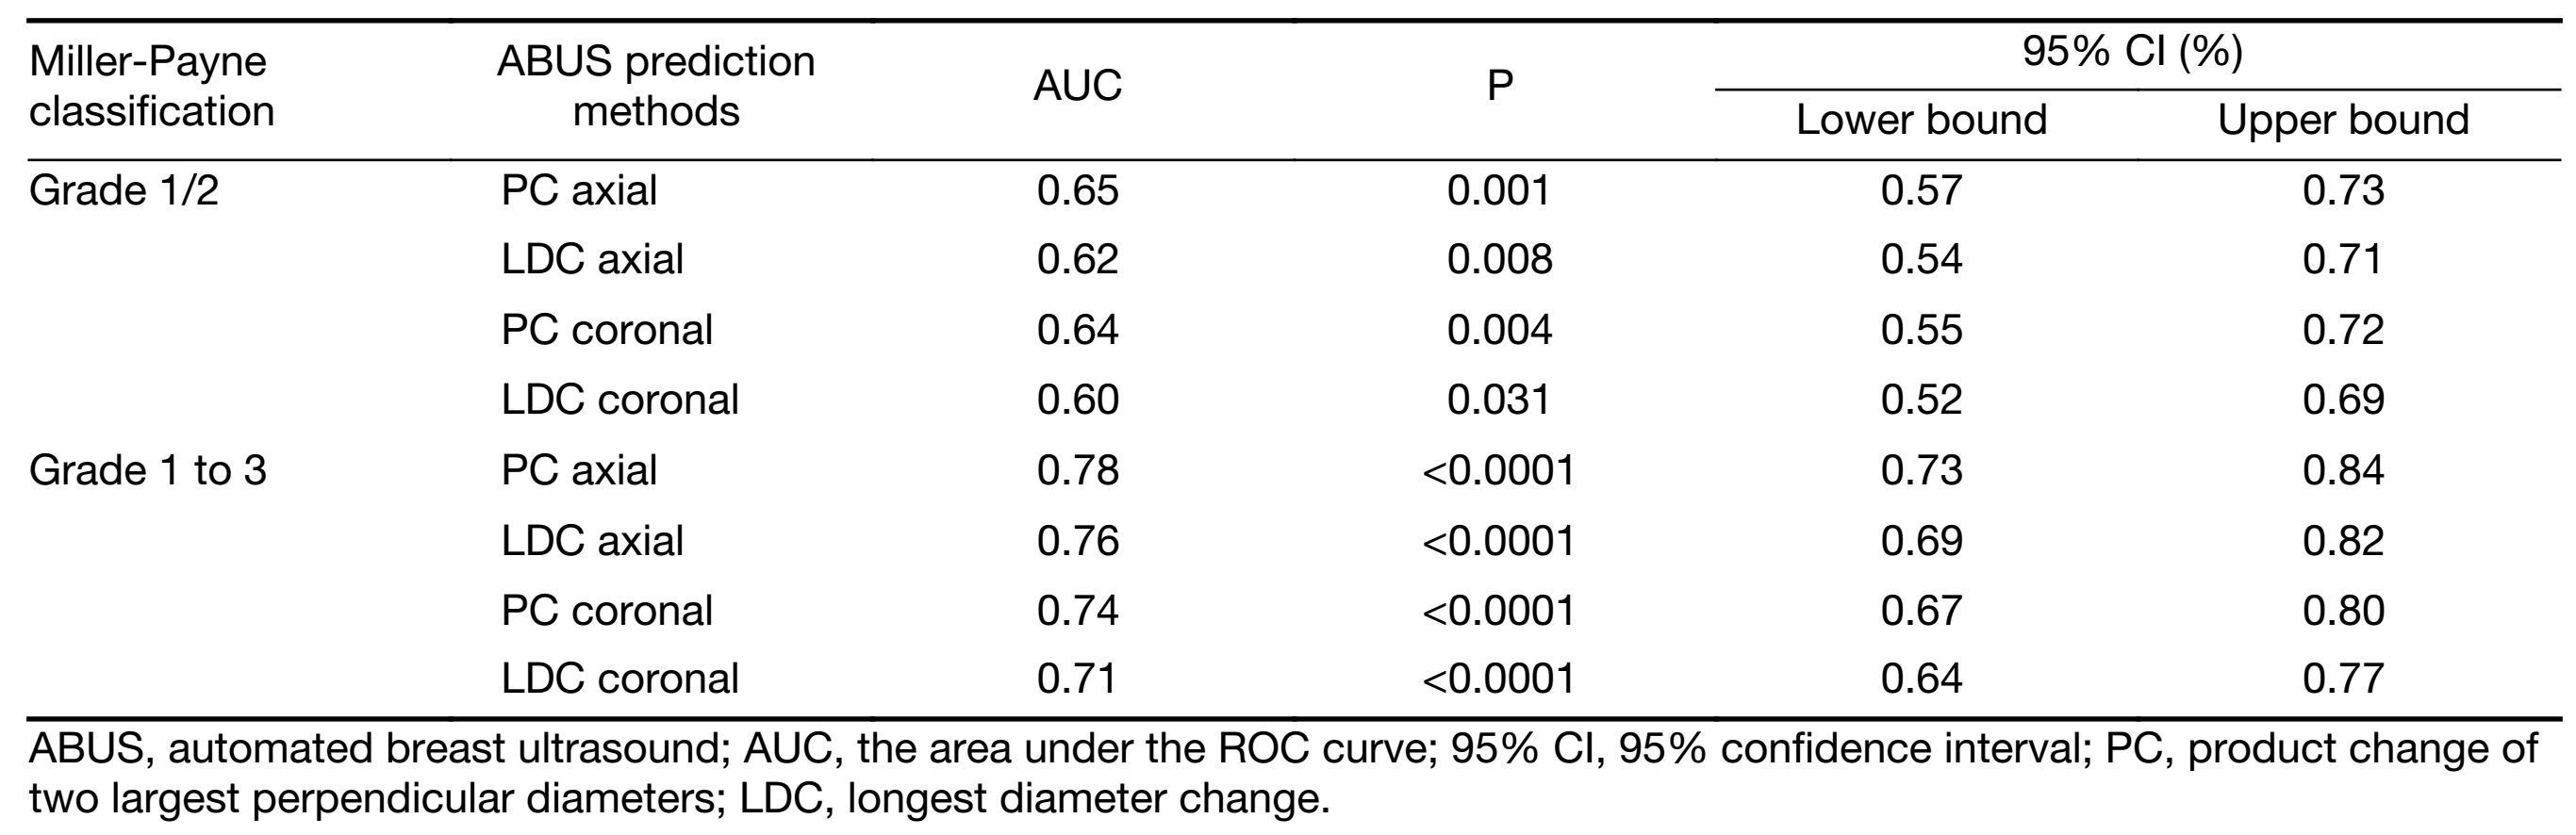
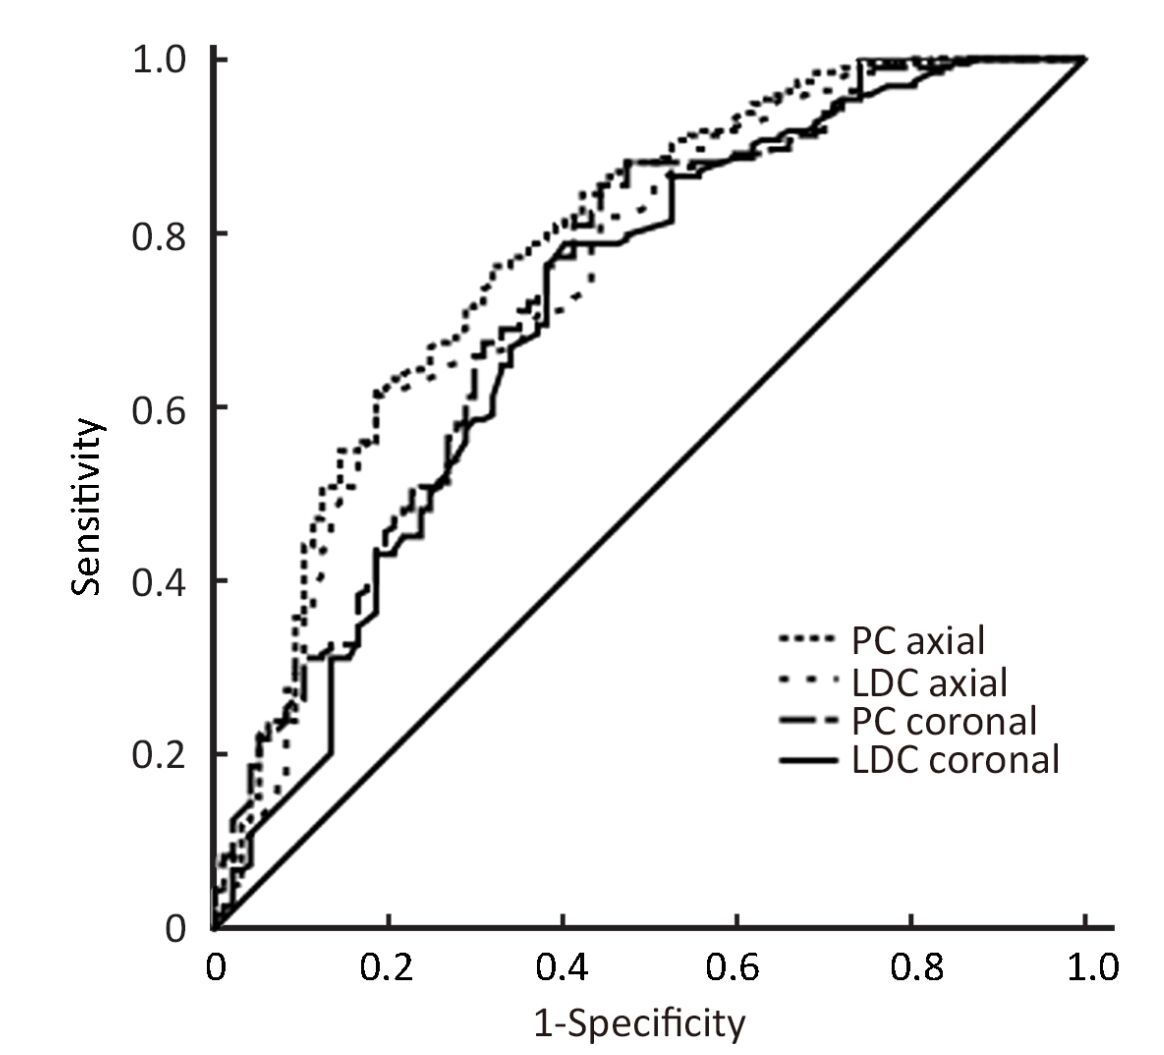
When poor pathological outcome was defined as Miller-Payne classification grade 1/2 tumors after 4 cycles of chemotherapy, all four prediction methods yielded low AUCs (0.60-0.65) (Figure 2, Table 3). No statistical significance tested among the four methods (P=0.303). When poor pathological outcome was defined as Miller-Payne classification grade 1−3 tumors, higher AUCs (0.71-0.78) (Figure 3, Table 3) were observed. No statistical significance is tested among the four methods (P=0.297).
Full table
Discussion
Non-responders to a certain NAC regimen benefit little from continuing the same treatment. Early recognition of non-responders facilitates early change to a non-cross-resistant regimen, thereby minimizing toxicity and optimizing the timing of surgery (7). In addition, response evaluation also facilitates the identification of suitable candidates for breast conservation whose primary tumors are adequately down-staged by NAC (8).
The Response Evaluation Criteria In Solid Tumors (RECIST) guideline states that conventional US is unsuitable for monitoring tumor size because of high operator dependence and low reproducibility. It also recommended MRI for assessing response (9). Despite the RECIST recommendations, US is frequently used to monitor tumor response in routine clinical practice because it is an easily available and noninvasive modality. The optimal method to monitor tumor response and predict pathological outcomes remains controversial.
There exist a few studies regarding the utility of conventional US in assessing response to NAC and predicting pathological outcomes. Data from the GeparTrio trial showed that in the group of non-responders identified by US after 2 cycles, the pCR rate was only 5.3%, whereas it was 32.1% in the group of responders. In the multivariate analysis, only sonographic response after 2 cycles and hormonal receptor status were predictive of a final pCR (10). However, retrospective data from a subset of patients enrolled in the Neo-tAnGo trial showed that at mid-treatment (after 4 cycles out of total 8 cycles of NAC) proportional tumor size changes (on the basis of the RECIST criteria) assessed by conventional US were not predictive of good pathological response at end-treatment (11). Our own data also indicated that pCR after 4 cycles of anthracycline or taxane-based NAC cannot be reliably predicted by PC measured by conventional US after 2 cycles of NAC (AUC=0.65) (12).
Previous research indicated that ABUS may reduce inter-operator variability, provide greater consistency, and ensure reproducibility of high-quality images (13). In this study, we investigated the diagnostic value of ABUS for early prediction of pathological outcomes.
Our data indicate that ABUS measured proportional change is of high diagnostic value when used to predict end-treatment pCR. Similar high AUCs were observed across all four prediction methods. By calculating the Youden’s index, the optimal cut-off values defined by our data are approximately 50% PC reduction and approximately 30% LDC reduction. With the selected cut-off values, all four prediction methods showed high sensitivities (85.7%-88.1%) while high specificities (81.5%-85.1%) were also shown with prediction methods used PC. Our data fits perfectly with the existing World Health Organization (WHO) (14) and RECIST (9) criteria which defined patients with ≥50% reduction of the product of the longest PC and patients with ≥30% reduction of the longest diameter as responders. Our data confirm the theoretical comparability of those criteria (15), and indicate that both the WHO and the RECIST are suitable criteria for predicting pCR using ABUS. Higher specificity indicates that the WHO criteria may be of greater diagnostic value. Numerically highest sensitivities (88.1%) and specificities (85.1%) were observed simultaneously with prediction methods based on PC and measured on the coronal plane.
A recent Australian study focusing on the accuracy of conventional US for predicting pCR after NAC also showed high sensitivities and AUC for prediction of pCR as high as 0.84. But the reported specificities were relatively low (around 50%) (16). However, results from the Australian study cannot be compared with our results directly since the Australian study incorporated conventional US and outcome of the axilla was included in their analysis of prediction while our study incorporated ABUS and only outcome of the breast was predicted.
Our data reveal that when poor pathological outcome is defined by the Miller-Payne classification (grade 1/2 or grade 1 to 3), ABUS measurements after 2 cycles of NAC cannot reliably predict outcomes after 4 cycles. Our previous work showed that conventional US cannot reliably predict poor pathological response (12). New method needs to be developed before poor pathological outcomes can be reliably predicted.
The Aberdeen trial and the GeparTrio trial suggested that responders would benefit from switching to a new regimen (17) or receiving extended original regimen (18). For the non-responders, it was also hypothesized that a response guided approach would benefit the non-responders, but the GeparTrio trial failed to demonstrate an improvement in pCR rate when early non-responders were switched to vinorelbine and capecitabine (19). A recent analysis by the GeparTrio study group reported improved disease-free survival (DFS) in early non-responders treated with TAC-NX compared with TAC×6 (20). But it is important to notice that as the sample size was calculated to provide adequate power for the primary end point (pCR), the study is underpowered for the end points of DFS and overall survival (OS). Therefore it seems that the responders will benefit from either way, stay on the old regimen or switch to a new regimen. But we don’t have enough evidence to determine the best treatment option for the non-responders. It may be of greater clinical significance to recognize non-responders early since new treatment strategy is needed.
Dynamic contrast enhanced MRI (DCE-MRI) has theoretical advantages over conventional assessment methods in measuring angiogenic changes in response to NAC which may occur prior to reductions in tumor size (21). Studies focused on MRI imaging parameter changes after cycle 1 demonstrated AUCs greater than 0.70 when predicting final pCR (22, 23). DCE-MRI kinetic parameters after 2 cycles of anthracycline-based NAC were also shown to be predictive of final clinical and pathologic response after 6 cycles (24). Interestingly, many of these studies also showed that change in MRI-derived tumor size did not predict pathologic response (22, 24). Analysis of 216 patients from the prospective ACRIN 6657/I-SPY TRIAL showed that the AUCs for predicting pCR after one cycle of anthracyline-based chemotherapy using MRI was 0.64 for longest diameter (LD) measurement, 0.70 for volume measurement and 0.57 for signal enhancement ratio (SER) measurement (25). It is important to note that most of these studies included small sample sizes and used a wide variety of DCE-MRI acquisition and parameter analysis techniques. Consensus recommendations specify that early response assessment with MRI is worthy of further investigation (26). Since there is no data directly comparing MRI with ABUS, the optimal method for early prediction of pCR remains to be determined.
ABUS has its limitations. First and foremost, it is very difficult for US to differentiate residual tumor from post-treatment fibrosis. The presence of other post-treatment changes such as tumor fragmentation, stromal reaction and residual carcinoma in situ make the situation even more complicated (27). The consequence is that US often shows a residual mass in cases where pathological examination reveals pCR or minimum residual disease. This may explain why prediction of poor pathological outcomes is less reliable in our study. Secondly, due to shadowing artifact caused by the nipple, data acquisition in the subareolar region may be problematic (28). However, as the technology continues to evolve, the degree of artifact should continue to diminish. One study showed that the visualization rate for the under-the-nipple mammary gland using the four-scan technique was as high as 98% and automated US was not inferior to handheld US (29). Thirdly, current design of the scanning paddle cannot fully cover the axilla. Therefore, there is incomplete assessment of the entire breast. In our study, conventional US was also performed after every 2 cycles of chemotherapy for all patients by an experienced radiologist (LH). In addition, compared with conventional US, ABUS does not provide additional information about blood flow.
To our knowledge, no other study so far has explored the diagnostic value of ABUS for response prediction during NAC. ABUS has potential advantages over MRI in being less costly, less complex, and it does not involve the use of intravenous contrast agents, which make it ideal for multiple scans typically required for treatment monitoring. Our results show that ABUS measurements after 2 cycles of NAC can accurately predict pCR after 4 cycles.
Our study has several limitations. One major limitation is that patients included in this analysis are a subset of patients from a randomized clinical trial. The PPV and NPV are meaningful only if the patients involved can represent the population of real patients. The retrospective nature of our study makes it prone to biases, and thus our results and the diagnostic value of the WHO criteria for predicting pCR need to be evaluated prospectively. All the patients included in this study received anthracycline-based NAC, and further study is needed before applying the results to patients receiving other regimens (e.g. taxane-based).
Conclusions
ABUS is a useful tool in early evaluation of pCR after NAC while less reliable when predicting poor pathological outcomes. Prospective trials to further evaluate these results are needed.
Acknowledgements
We thank all the patients who participated in this trial.
Footnote
Conflicts of Interest: The authors have no conflicts of interest to declare.
References
- Chen W, Zheng R, Zeng H, et al. Annual report on status of cancer in China, 2011. Chin J Cancer Res 2015;27:2–12. [PubMed] DOI:10.3978/j.issn.1000-9604.2015.01.06
- Liu SV, Melstrom L, Yao K, et al. Neoadjuvant therapy for breast cancer. J Surg Oncol 2010;101:283–91. [PubMed] DOI:10.1002/jso.v101:4
- Yeh E, Slanetz P, Kopans DB, et al. Prospective comparison of mammography, sonography, and MRI in patients undergoing neoadjuvant chemotherapy for palpable breast cancer. AJR Am J Roentgenol 2005;184:868–77. [PubMed] DOI:10.2214/ajr.184.3.01840868
- Lin X, Wang J, Han F, et al. Analysis of eighty-one cases with breast lesions using automated breast volume scanner and comparison with handheld ultrasound. Eur J Radiol 2012;81:873–8. [PubMed] DOI:10.1016/j.ejrad.2011.02.038
- Chang JM, Cha JH, Park JS, et al. Automated breast ultrasound system (ABUS): reproducibility of mass localization, size measurement, and characterization on serial examinations. Acta Radiol 2015;56:1163–70. [PubMed] DOI:10.1177/0284185114551565
- Ogston KN, Miller ID, Payne S, et al. A new histological grading system to assess response of breast cancers to primary chemotherapy: prognostic significance and survival. Breast 2003;12:320–7. [PubMed] DOI:10.1016/S0960-9776(03)00106-1
- Shin HJ, Kim HH, Ahn JH, et al. Comparison of mammography, sonography, MRI and clinical examination in patients with locally advanced or inflammatory breast cancer who underwent neoadjuvant chemotherapy. Br J Radiol 2011;84:612–20. [PubMed] DOI:10.1259/bjr/74430952
- Bhattacharyya M, Ryan D, Carpenter R, et al. Using MRI to plan breast-conserving surgery following neoadjuvant chemotherapy for early breast cancer. Br J Cancer 2008;98:289–93. [PubMed] DOI:10.1038/sj.bjc.6604171
- Eisenhauer EA, Therasse P, Bogaerts J, et al. New response evaluation criteria in solid tumours: revised RECIST guideline (version 1.1). Eur J Cancer 2009;45:228–47. [PubMed] DOI:10.1016/j.ejca.2008.10.026
- von Minckwitz G, Blohmer JU, Raab G, et al. In vivo chemosensitivity-adapted preoperative chemotherapy in patients with early-stage breast cancer: the GEPARTRIO pilot study. Ann Oncol 2005;16:56–63. [PubMed] DOI:10.1093/annonc/mdi001
- Gounaris I, Provenzano E, Vallier AL, et al. Accuracy of unidimensional and volumetric ultrasound measurements in predicting good pathological response to neoadjuvant chemotherapy in breast cancer patients. Breast Cancer Res Treat 2011;127:459–69. [PubMed] DOI:10.1007/s10549-011-1454-x
- Qi M, Li JF, Xie YT, et al. Feasibility of predicting pathological evaluation by ultrasonic evaluation in initial stage of neoadjuvant chemotherapy for primary breast cancer. Zhonghua Yi Xue Za Zhi (in Chinese) 2010;90:511–4.
- Kelly KM, Dean J, Lee SJ, et al. Breast cancer detection: radiologists' performance using mammography with and without automated whole-breast ultrasound. Eur Radiol 2010;20:2557–64. [PubMed] DOI:10.1007/s00330-010-1844-1
- Miller AB, Hoogstraten B, Staquet M, et al. Reporting results of cancer treatment. Cancer 1981;47:207–14. [PubMed] DOI:10.1002/(ISSN)1097-0142
- James K, Eisenhauer E, Christian M, et al. Measuring response in solid tumors: unidimensional versus bidimensional measurement. J Natl Cancer Inst 1999;91:523–8. [PubMed] DOI:10.1093/jnci/91.6.523
- Marinovich ML, Houssami N, Macaskill P, et al. Accuracy of ultrasound for predicting pathologic response during neoadjuvant therapy for breast cancer. Int J Cancer 2015;136:2730–7. [PubMed] DOI:10.1002/ijc.v136.11
- Heys SD, Hutcheon AW, Sarkar TK, et al. Neoadjuvant docetaxel in breast cancer: 3-year survival results from the Aberdeen trial. Clin Breast Cancer 2002;3 Suppl 2:S69–74. [PubMed]
- von Minckwitz G, Kümmel S, Vogel P, et al. Intensified neoadjuvant chemotherapy in early-responding breast cancer: phase III randomized GeparTrio study. J Natl Cancer Inst 2008;100:552–62. [PubMed] DOI:10.1093/jnci/djn089
- von Minckwitz G, Kümmel S, Vogel P, et al. Neoadjuvant vinorelbine-capecitabine versus docetaxel-doxorubicin-cyclophosphamide in early nonresponsive breast cancer: phase III randomized GeparTrio trial. J Natl Cancer Inst 2008;100:542–51. [PubMed] DOI:10.1093/jnci/djn085
- von Minckwitz G, Blohmer JU, Costa SD, et al. Response-guided neoadjuvant chemotherapy for breast cancer. J Clin Oncol 2013;31:3623–30. [PubMed] DOI:10.1200/JCO.2012.45.0940
- Arlinghaus LR, Li X, Levy M, et al. Current and future trends in magnetic resonance imaging assessments of the response of breast tumors to neoadjuvant chemotherapy. J Oncol 2010;2010:919620. [PubMed] DOI:1155/2010/919620. Epub 2010 Sep 29
- Abramson RG, Li X, Hoyt TL, et al. Early assessment of breast cancer response to neoadjuvant chemotherapy by semi-quantitative analysis of high-temporal resolution DCE-MRI: preliminary results. Magn Reson Imaging 2013;31:1457–64. [PubMed] DOI:10.1016/j.mri.2013.07.002
- Li X, Arlinghaus LR, Ayers GD, et al. DCE-MRI analysis methods for predicting the response of breast cancer to neoadjuvant chemotherapy: pilot study findings. Magn Reson Med 2014;71:1592–602. [PubMed] DOI:10.1002/mrm.v71.4
- Ah-See ML, Makris A, Taylor NJ, et al. Early changes in functional dynamic magnetic resonance imaging predict for pathologic response to neoadjuvant chemotherapy in primary breast cancer. Clin Cancer Res 2008;14:6580–9. [PubMed] DOI:10.1158/1078-0432.CCR-07-4310
- Hylton NM, Blume JD, Bernreuter WK, et al. Locally advanced breast cancer: MR imaging for prediction of response to neoadjuvant chemotherapy--results from ACRIN 6657/I-SPY TRIAL. Radiology 2012;263:663–72. [PubMed] DOI:10.1148/radiol.12110748
- Sardanelli F, Boetes C, Borisch B, et al. Magnetic resonance imaging of the breast: recommendations from the EUSOMA working group. Eur J Cancer 2010;46:1296–316. [PubMed] DOI:10.1016/j.ejca.2010.02.015
- Gounaris I, Provenzano E, Vallier AL, et al. Accuracy of unidimensional and volumetric ultrasound measurements in predicting good pathological response to neoadjuvant chemotherapy in breast cancer patients. Breast Cancer Res Treat 2011;127:459–69. [PubMed] DOI:10.1007/s10549-011-1454-x
- Kaplan SS. Automated whole breast ultrasound. Radiol Clin North Am 2014;52:539–46. [PubMed] DOI:10.1016/j.rcl.2014.01.002
- Isobe S, Tozaki M, Yamaguchi M, et al. Detectability of breast lesions under the nipple using an automated breast volume scanner: comparison with handheld ultrasonography. Jpn J Radiol 2011;29:361–5. [PubMed] DOI:10.1007/s11604-010-0555-5