
Influencing factors of inpatient expenditure pattern for cancer in China, 2015
Introduction
Since the 1970s, incidence rate and mortality for cancer have been rising in China. Cancer has become the first killer of human in the 21st century. Based on the data of China National Cancer Center, the crude morbidity rate of cancers in 2012 has reached 264.85/100,000 and the crude mortality rate of cancers has reached 161.49/100,000 (1). About 13% of death in Chinese residents (1 out of 7−8 deaths) was caused by cancer (2). Cancer not only seriously affects the health of the residents, but also causes heavy economic burden to family and society. The prevention and treatment for cancer has become a major public health problem in China. In 2010, the total expenditure for the prevention and treatment of cancer was 94.84 billion RMB (13.79 billion US dollars), accounting for 5.14% of the total health expenses and 0.24% of gross domestic product (GDP) in China at the same period (3). In 2015, the total expense for cancer in tumor special hospitals reached 50.76 billion RMB (7.38 billion US dollars) (4).
Information on hospital expenditure is an important input to the economic and financial analyses of many types of health interventions, and is also essential for budgeting and planning exercises. Previous studies (5,6) mainly focused on the quantification of the cost of cancer, which is an absolute number and cannot account for the cancer-caused proportion of health resources in various diseases. Moreover, analysts estimating the costs of health interventions requiring hospitalization often cut corners because they lack data and the costs of undertaking full step-down costing studies are high. They sometimes use the costs taken from a single hospital; and sometimes use simple rules of thumb for allocating total hospital costs (7,8). To fill the gap, for the first time, we analyzed the proportion of cancer-caused hospitalization expenses in total hospitalization expenses from the national authoritative data, explored the influencing factors of the proportion, and provided effective data information for more rational utilization of health resources, so as to control unreasonable medical expenses, reduce the economic burden, and promote health care system reform and the management of health care costs. Furthermore, this study could be used to understand possible influencing factors of inpatient expenditure pattern for cancer (IEPC), and provides evidence for future studies to predict costs in regions where data were not available.
Materials and methods
Data source
The related information on inpatient expenditure for cancer in China in 2015 is from the inpatient medical record home page (IMRHP) of general hospitals, whose main contents include patients’ demographic information, code of diagnosis, code of surgery, results of treatments, hospitalization expenses, etc. The IMRHP was quarterly reported by the general and special hospitals in the secondary and above levels through the Health Statistics and Report System of Center for Health Statistics and Information (CHSI), National Health and Family Planning Commission, China. Hospital information reported by every hospital in China is from hospital information database. Hospitals update their information as long as the information changed through the Health Statistics and Report System of CHSI. Hospital information mainly includes hospital’s property, level, number of staff, number of beds, situation of equipment, volume of medical services, etc. Provincial data, including GDP per capita, the proportion of urban population, age structure, sex ratio and so on, are from China Health and Family Planning Statistical Yearbook 2016.
Every year before March, national CHSI checks the completeness and validity of IMRHP and hospital information of last year by provincial level and informs the provincial CHSIs of the results of data quality control. Besides, national CHSI carries out data quality supervision and inspection regularly, and helps the provinces with poorer data quality to improve their data’s completeness and validity.
Statistical analysis
Brief conceptual framework
Considering the possible clustering in IEPC, we used multilevel model to explore the influencing factors of ratio. As the ratio after logarithmic transformation obeys normal distribution, we proposed two-level (hospital level and province level) linear regression model. We used SAS software (Version 9.3; Institute Inc., Cary, USA) to clean data, explore analysis and choose explanatory variables, and modeled by MLwiN (Version 2.02; Multilevel Models Project Institute of Education, London, UK).
Multilevel model
To keep the consistency with World Health Organizaiton relative study (9) we applied linear regression model to estimate the influencing factors of IEPC. To better explain the potential clustering and differences of the proportions, we proposed two-level linear regression model, with hospital as the low level and province as the high level, taking account of the potential homogeneity with similar disease distribution in provinces (10).
Outcome variable
As the outcome variable, IEPC’s numerator is the total hospitalization expenditure of patients primarily diagnosed as cancer (International Classification of Diseases 10: C00-C97) in a hospital and denominator is the total hospitalization expenditure in a hospital. A total of 40.76 million IMRHP from 2,886 general hospitals were included in the analysis.
Explanatory variables
We took almost all observed relevant variables of hospital and province into consideration in order to analyze influencing factors of inpatient expenditure pattern. Two factors determined the choice of explanatory variables. One was the possible application of the model in predicting IEPC in regions without IMRHP for the future, namely the availability of data. Second, we considered the variables used in previous studies (9,11). Firstly, data included in this paper are available all over the country because of the availability of national hospital information database and China Health and Family Planning Statistical Yearbook. Adam et al. analyzed influencing factors of the ratio of the ward-specific cost to the total cost by the explanatory variables: province, number of staff, number of beds and occupancy rate (11), and modeled by GDP per capita, occupancy rate, hospital beds, public or not, etc., to analyze influencing factors of variation in the cost of inpatient stays versus outpatient visits in hospitals (9). We referenced variables used by Adam, but tried more variables to explore possible correlations. In addition to the aforementioned variables, hospital level, age-standardized mortality, floating population, age structure and sex ratio were also brought into model. The multilevel model is as follows:
| $ \begin{aligned} {y_{ij}} = & {\beta _0}_{ij} + {\beta _1}grad{e_{ij}} + {\beta _2}propert{y_{ij}} + {\beta _3}be{d_{ij}} + \\ & {\beta _4}butilizatio{n_{ij}} + {\beta _5}G\!\;\!D\!\;\!{P_j} + {\beta _6}s\!m\!ortalit{y_j} + \\ & {\beta _7}oprovinc{e_j} + {\beta _8}ym\!iddl{e_j} + {\beta _9}ol{d_j} + {\beta _{10}}s\!ex\!{r_j} \end{aligned} $ |
| ${{\beta }_{0ij}}={{\beta }_{0}}+{{u}_{0j}}+{{e}_{0ij}}$ |
| $\left[ {{u}_{0j}} \right]\tilde{\ }N\left(0,\sigma _{{{u}_{0}}}^{2} \right)$ |
| $\left[ {{u}_{0ij}} \right]\tilde{\ }N\left(0,\sigma _{{{e}_{0}}}^{2} \right)$ |
i: the first/low level, hospital level; j: the second/high level, province level; yij: nature logarithmic of IEPC in a hospital; βk: fixed coefficient of each explanatory variable, k=1,2, 3 …… 10; gradeij: hospital level; propertyij: hospital property; bedij: number of beds in a hospital; butilizationij: bed utilization in a hospital; GDPj: GDP per capital in a province; smortalityj: age-standardized mortality for cancer in a province; oprovincej: proportion for inpatient outside of home province; ymiddlej: ratio of population aged 15−64 years old in a province; oldj: ratio of population ≥65 years old in a province; sexrj: sex ratio in a province;
Results
Descriptive analysis
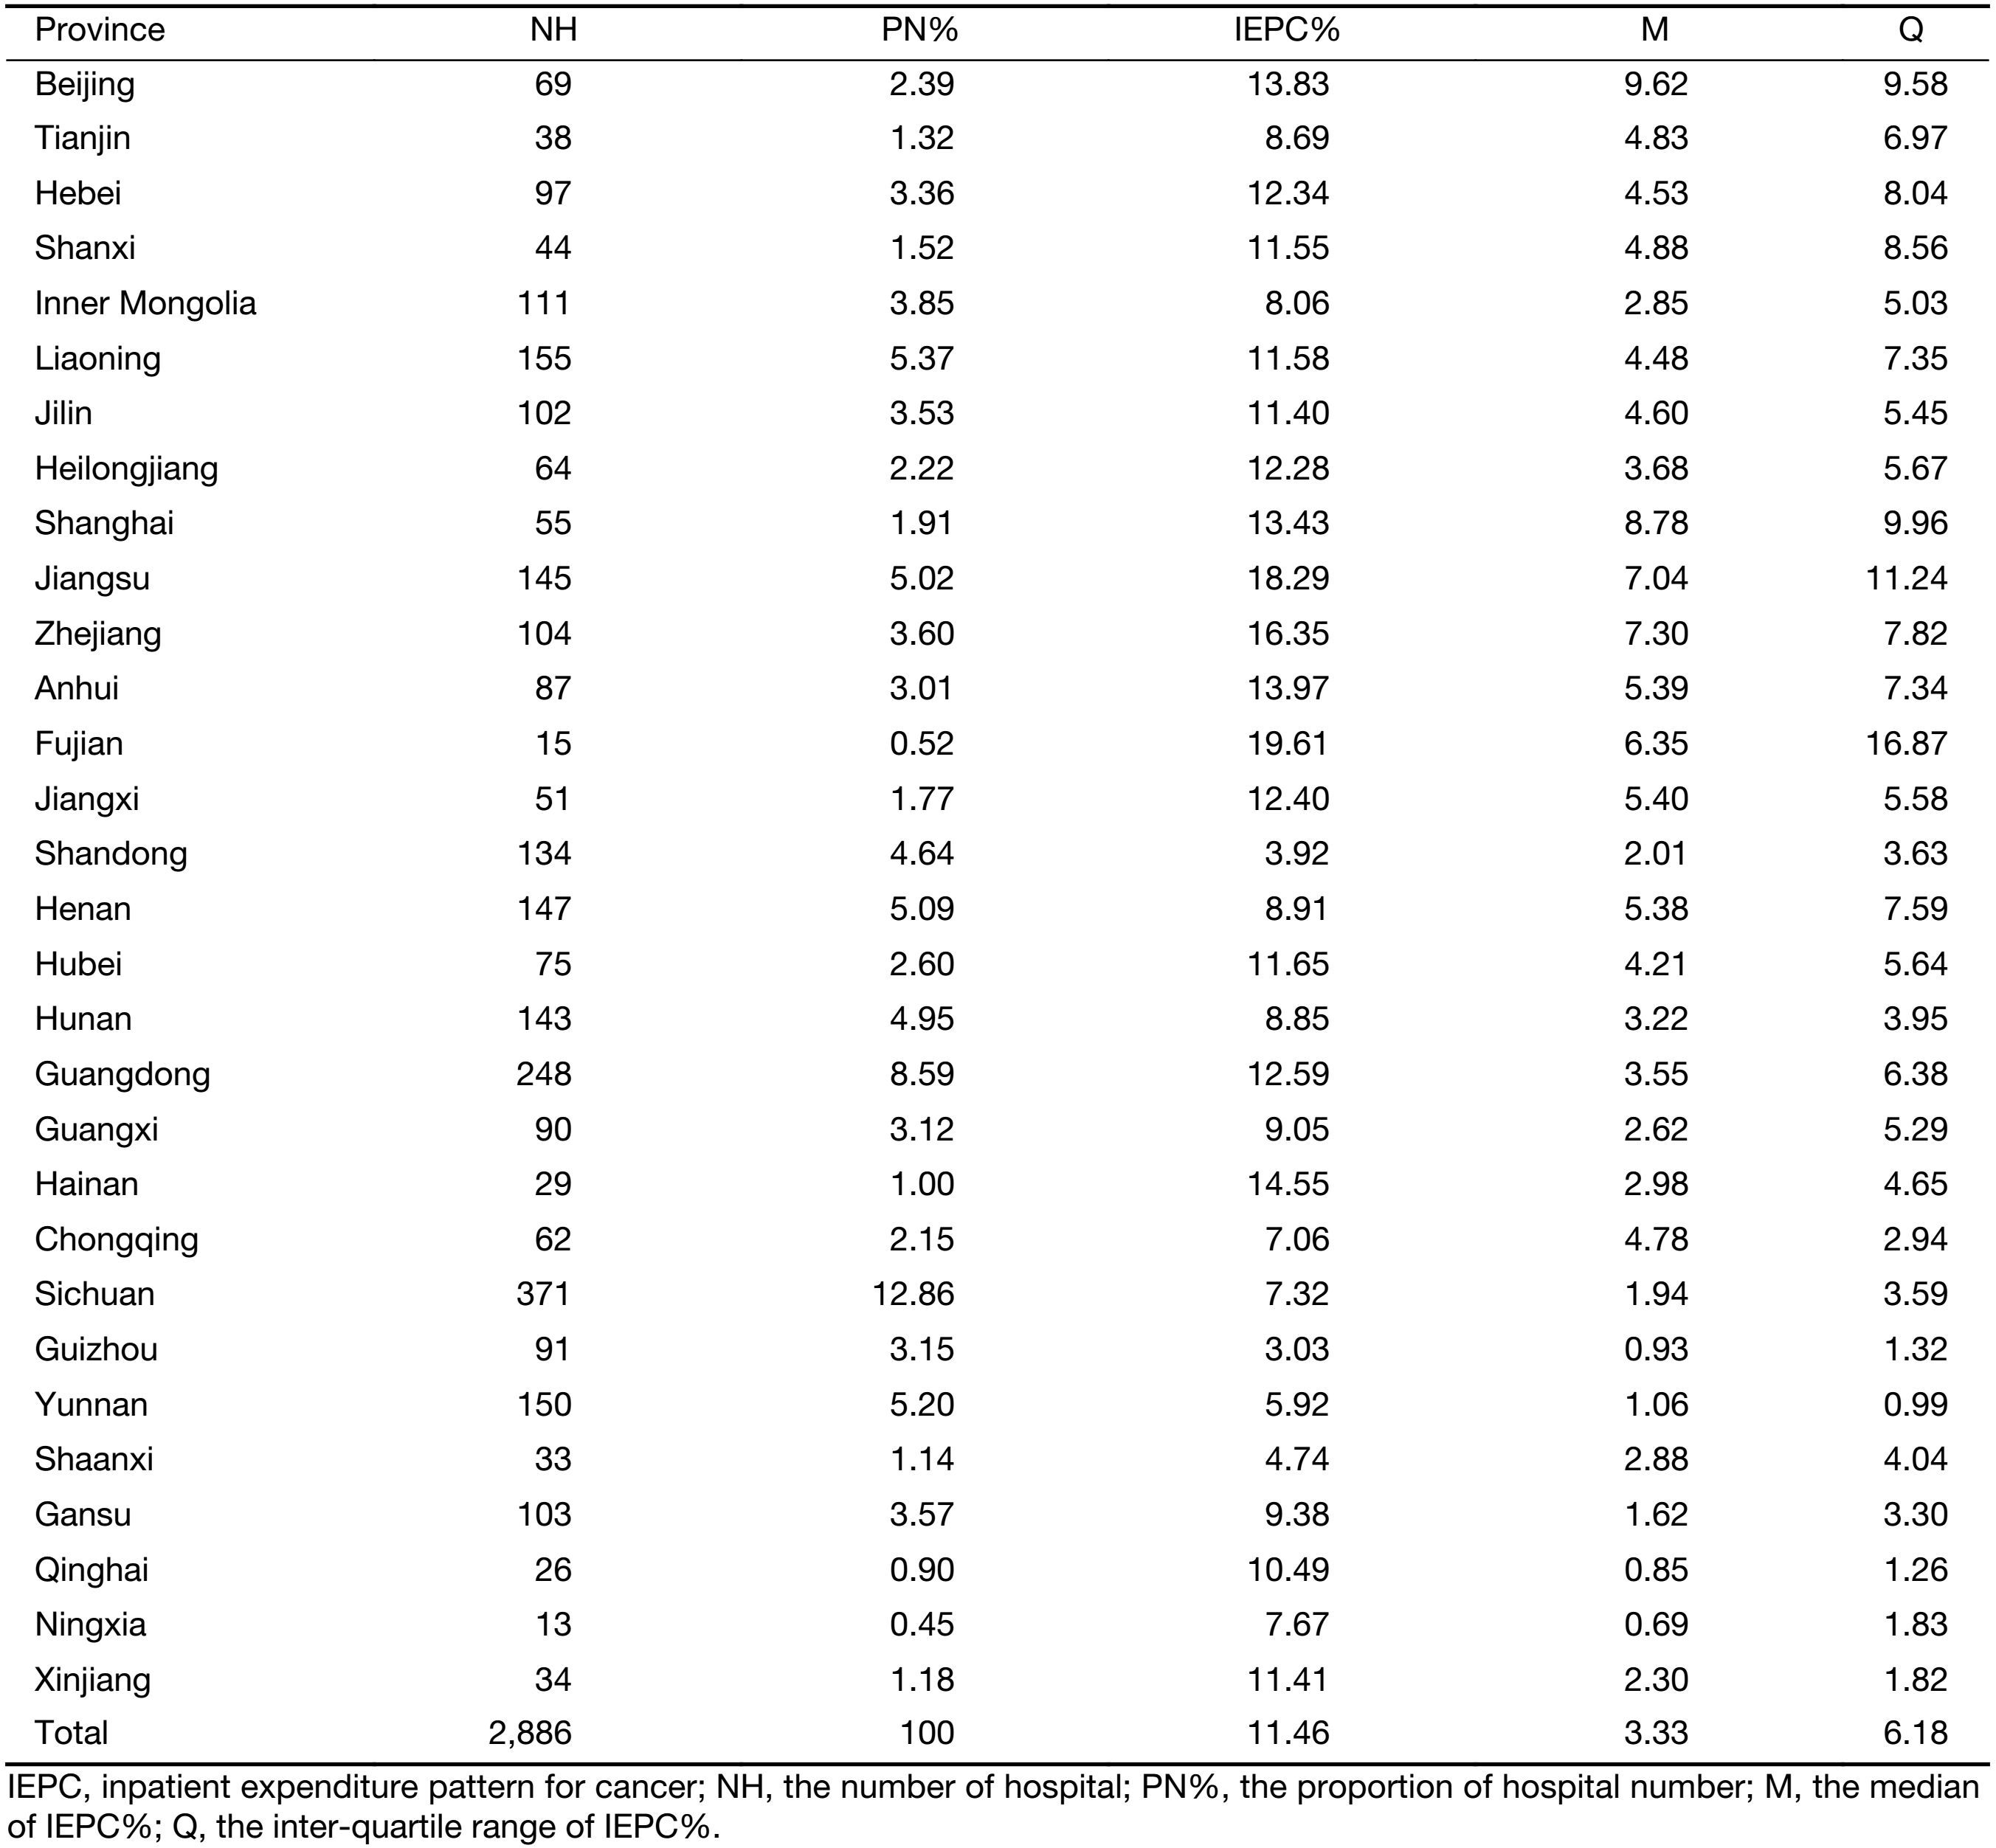
We analyzed 40.76 million IMRHP of 2,886 hospitals in 30 provinces of China in 2015 except Tibet because of few data on Tibet. The distribution of IMRHP is presented in Figure 1. There was a big difference in the number of the eligible reported IMRHP among provinces in China in 2015. The IEPC of the total inpatient records was 11.46% in China in 2015, ranging from 3.03% to 19.61% across provinces. Top three provinces on IEPC was Fujian, Jiangsu and Zhejiang, whose IEPC were 19.61%, 18.29% and 16.35%, respectively. Guizhou, Shandong and Shaanxi had the least proportion of IEPC, which were 3.03%, 3.92% and 4.74%, respectively. Due to the skewed distribution for IEPC, we used median and inter-quartile range as presented in Table 1.

Full table
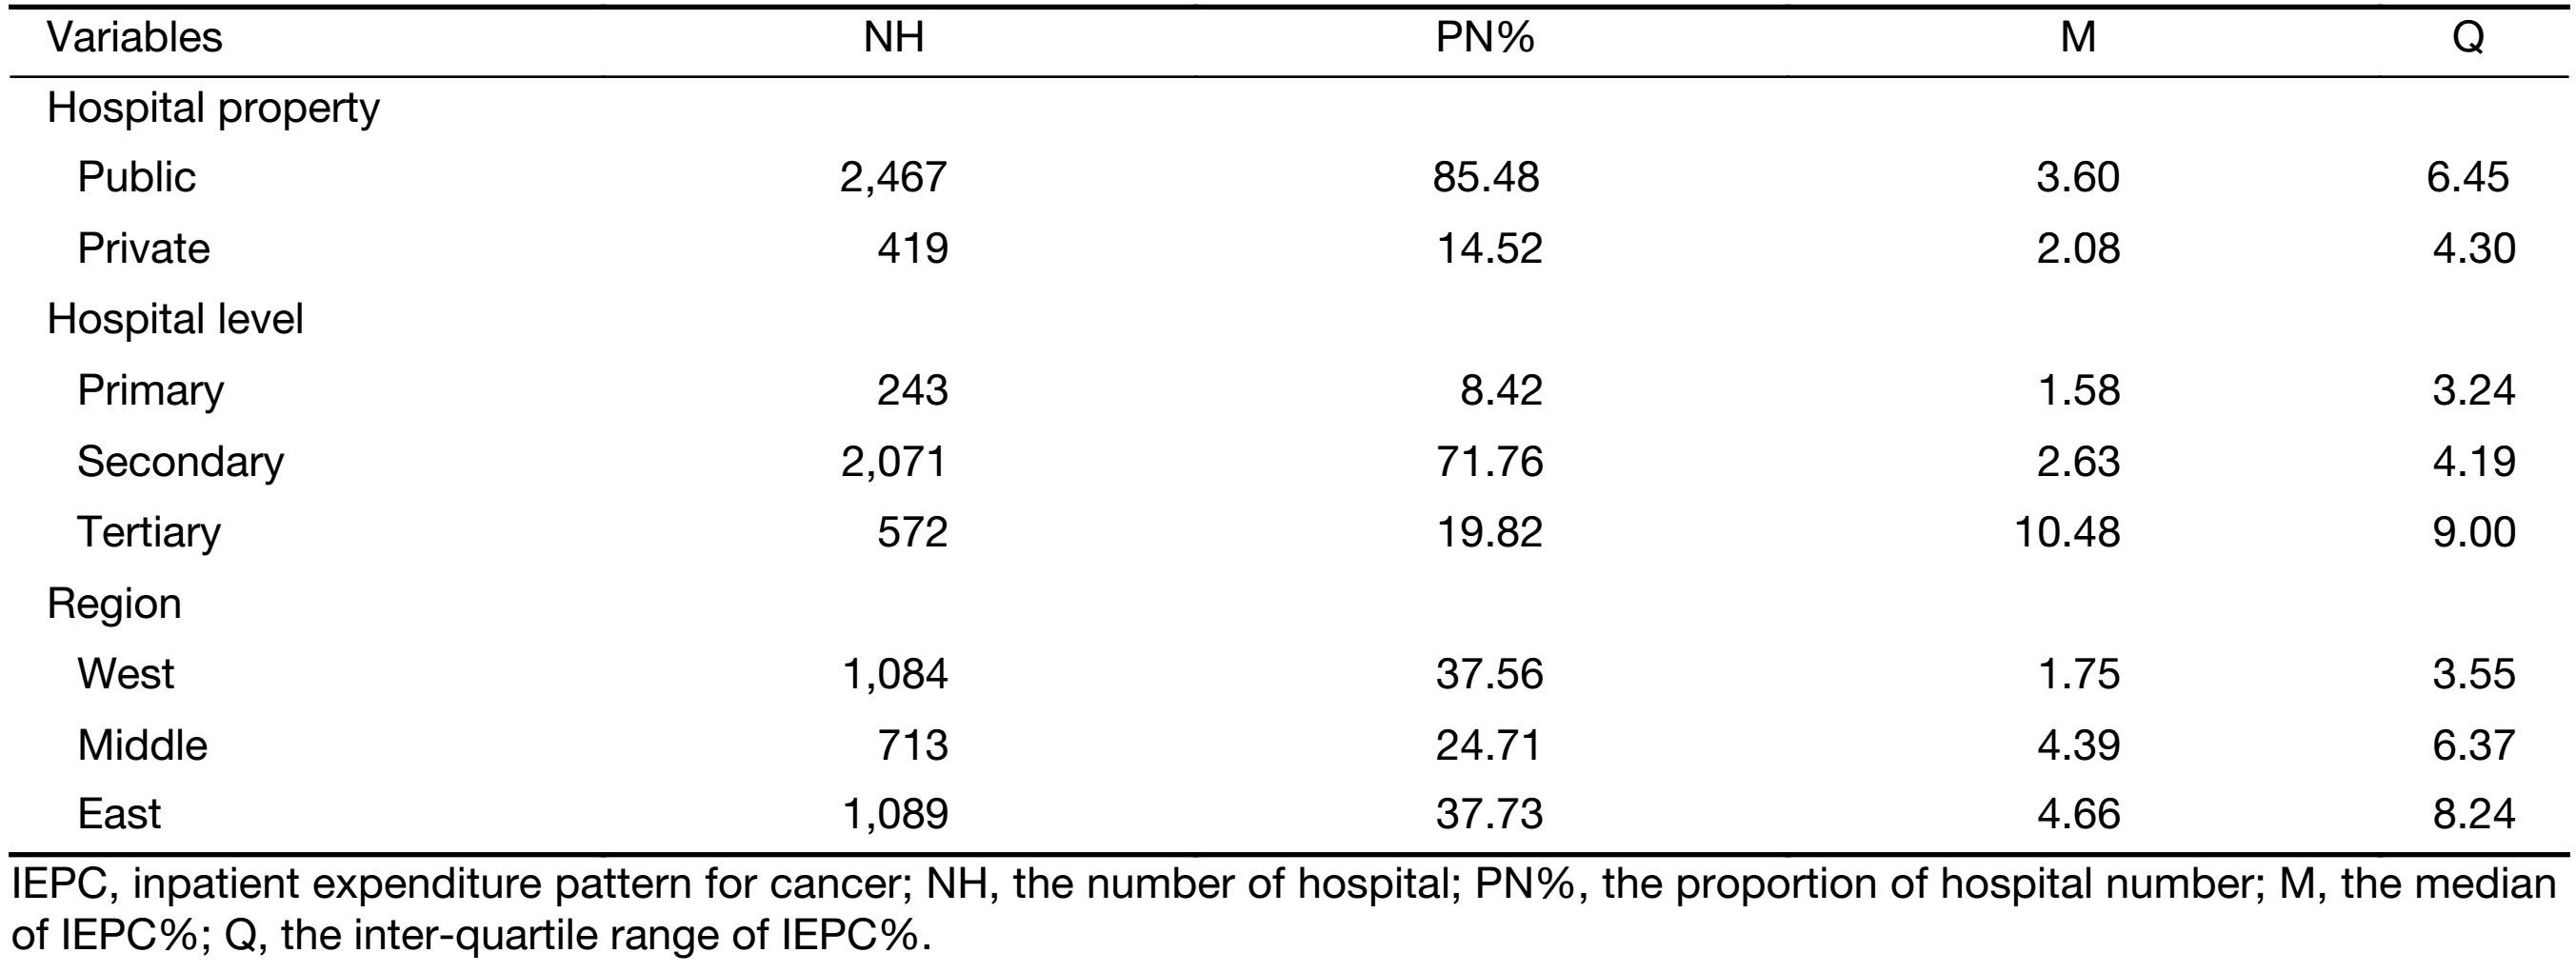
The number of public hospitals was approximately 6 times as many as that of private hospitals, while the median of IEPC% of public hospitals was about 2 times as high as that of private hospitals. The number of secondary hospitals amounted to 2,071, which was far more than the numbers of primary and tertiary hospitals. For IEPC%, tertiary hospitals were the highest, secondary hospitals were about a quarter of tertiary hospitals, and the remaining was approximately one seventh of the tertiary. Despite middle regions had the least number of hospitals than the west and the east regions, the median of IEPC% of east regions was slightly higher than that of the middle, and that of west regions was the least (Table 2).
Full table
Model results
Single factor analysis and correlation analysis were carried out for explanatory variables. We established a variance covariance matrix to analyze the correlations in all variables, which were divided into four categories: property, level, scale and efficiency of hospital. The results of correlations showed that staff and income variables are highly correlated with beds (Pearson correlation coefficient >0.9). The highly correlated variable (Pearson correlation coefficient >0.75) with the rest variables in each category was selected as representative. Finally, we selected four representative types: hospital property (1 is a public hospital, 0 is a private hospital), hospital level (1,2, 3 are primary, secondary and tertiary hospital, respectively), number of beds in a hospital, and bed utilization in a hospital (numerator is bed-days used by patients and denominator is total bed-days in hospital).
Variance covariance matrix for provincial variables showed that the region (the east, middle and west of China) and life expectancy per capita are highly correlated with GDP per capita. According to single factor liner regression model, the population variable had no statistical significance. In the end, the provincial variables include: GDP per capital, age-standardized mortality for cancer (12), proportion for inpatient outside of home province (numerator is the total number of trans-provincial inpatients and denominator is the total number of provincial inpatients), ratio of population aged 15−64 years old, ratio of population ≥65 years old, and sex ratio.
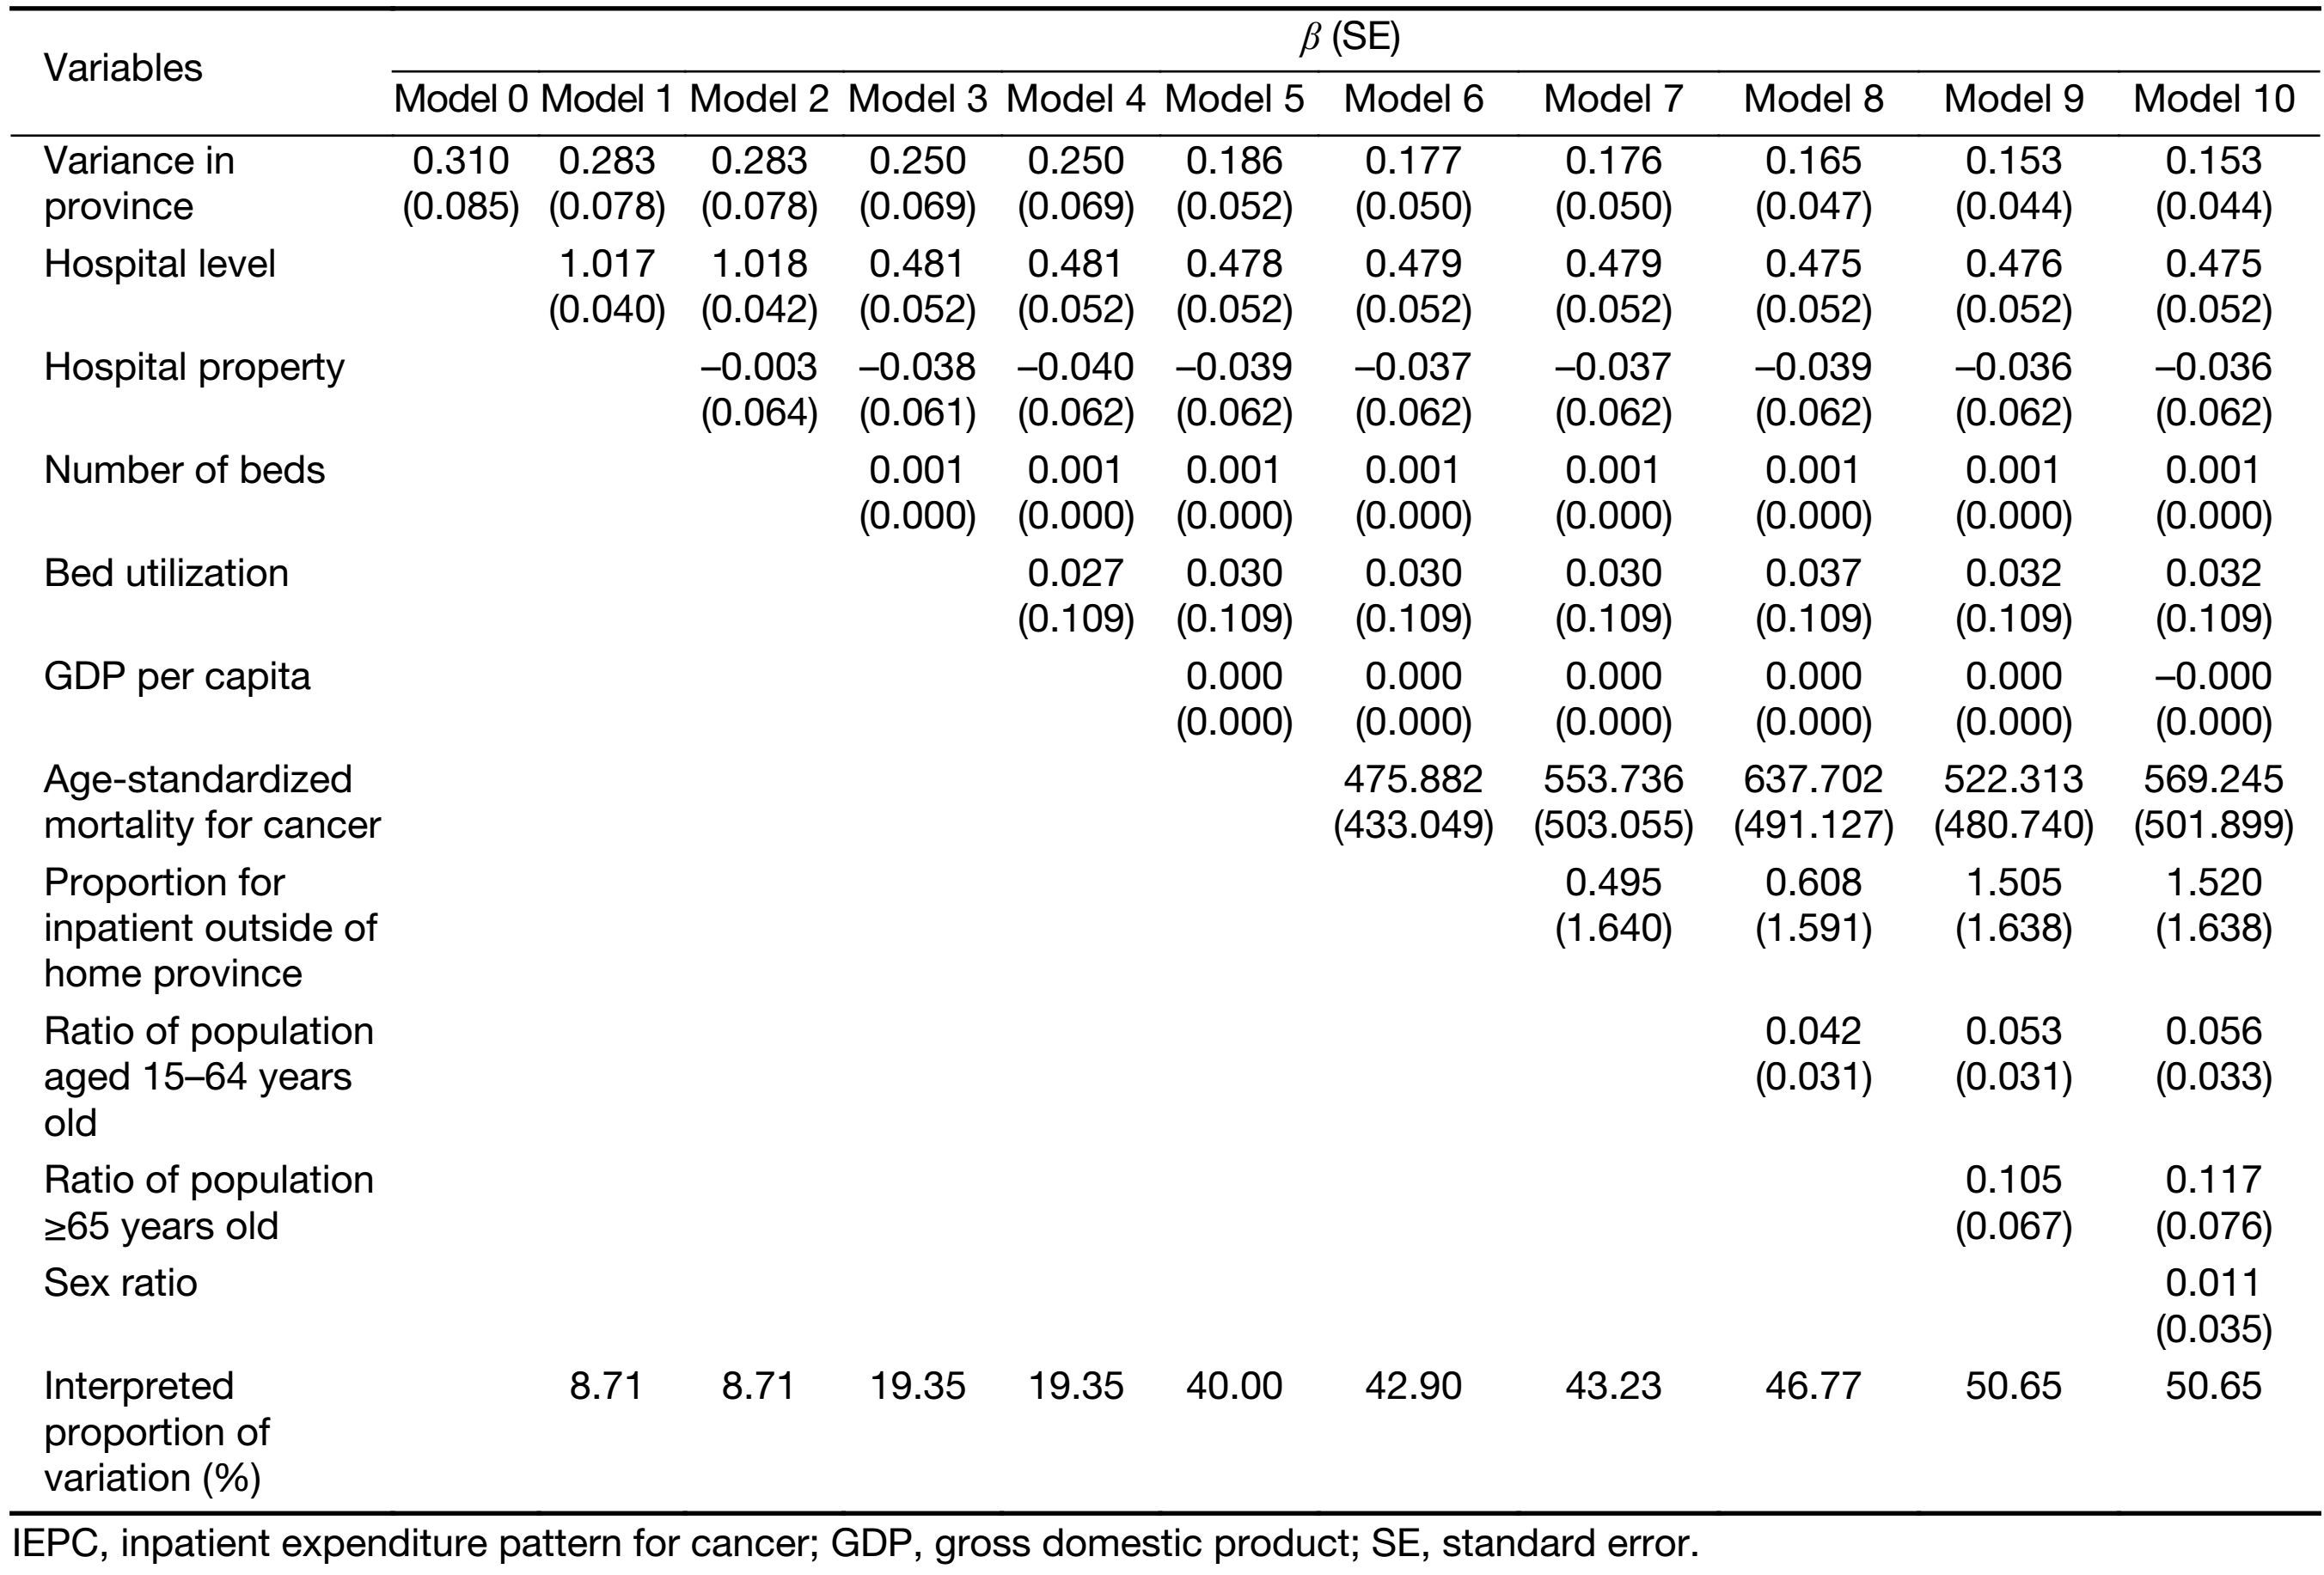
Then we put the selected variables one by one into the model to model. As shown in model 0 without any explanatory variables, also called zero model, second-level’s residual had statistically significant difference, suggesting the IEPC in a province having homogeneity. When we put the variables successively in the model, we found that hospital level and number of beds in a hospital had statistical significance, and the rest of the explanatory variables showed no significance. The interpreted proportion of the variation reached 50.65% in the final model. The residual normal figures of hospital level and province level were similar to a straight line, indicating that the hypothesis of first level and second level’s residual obeying normal distribution is reasonable and the application of the above model is correct. Fixed coefficient of each variable is presented in Table 3. The results of final model are as follows:
| $ \begin{aligned} \quad {y_{ij}} = & {\beta _0}_{ij} + 0.475grad{e_{ij}} {\rm{ \, -\, }} 0.036propert{y_{ij}} \, + \\ & 0.001be{d_{ij}} + 0.032butilizatio{n_{ij}} {\rm{ \, -\, }} {\rm{0}}.{\rm{000}}G\!D\!{P_j} \, + \\ & 569.245s\!m\!ortalit{y_j} + 1.520oprovinc{e_j} \, + \\ & 0.056ym\!iddl{e_j} + 0.117ol{d_j} + 0.011sex{r_j} \end{aligned} $ |
| ${{\beta }_{0ij}}=\text{-}12.390+{{u}_{0j}}+{{e}_{0ij}}$ |
| $\left[ {{u}_{0j}} \right]\tilde{\ }N\left(0,\text{0}.\text{153} \right)$ |
| $\left[ {{u}_{0ij}} \right]\tilde{\ }N\left(0,\text{0}.\text{986} \right)$ |
Full table
Discussion
Studying influencing factors of IEPC in China can provide evidence for more reasonable allocation of limited health resources. The results show that cancer takes up a large amount of health resources, strengthening the importance of greater attention. Additionally, IEPC in a high level has clustering, namely that there is heterogeneity between provinces and similarity within a province.
Model results demonstrate that hospital level and number of beds are the influencing factors of IEPC. We can see that the higher the level of hospitals, the higher the value of IEPC. This result can be explained by the fact that the patients with severe diseases tend to visit the hospitals with higher level. Although the levels can reflect the ability of diagnosis and treatment of hospitals in a certain level, there still is a high variation of inpatient volume among hospitals in the same level. The number of beds in tertiary hospitals ranges from 400 to 2,000. Our study shows that the expenditure of cancer was concentrated in hospitals with more beds. Briefly, rising one level of the hospital led to the increase of 0.475 natural logarithm units of IEPC averagely. The number of beds increasing 1,000 each made the natural logarithm of IEPC increase one unit averagely.
Although the rest of the explanatory variables cannot influence the IEPC, they can explain the differences between provinces to some extent, including GDP per capita, age-standardized mortality for cancer, proportion for inpatient outside of home province and ratio of population aged 15−64 years old. The final model can explain 50.65% of the variation, and the independent variables explained the model well (13).
To our knowledge, this is the first study exploring the IEPC using national authoritative data to acquire the proportion of cancer in various diseases in China. We estimated the proportion and identified the influencing factors of it by multilevel model.
Limitations should be noted in interpreting the results of our study. Firstly, some influencing factors (such as the price of cancer treatment) on IEPC could not be included in the model due to the limitation of data accessibility. Secondly, the variation of data completeness among different levels of hospitals and different regions may influence our final model. However, this is still the inpatient expenditure pattern study with the largest data sample.
Our study showed that a considerable proportion of IEPC variation could be explained by the differences of hospital level and number of beds. It implied that it is possible to estimate disease-specific ratio of inpatient expense taking account of key influencing factors in China. Furthermore, this study is an input to economic and financial analyses and provides evidence for future study on the national economic burden of cancer. What’s more, the influencing factors obtained from this study can predict the ratio in the area where data are not available.
Acknowledgements
This work was supported by National Natural Science Foundation of China (No. 71403189).
Footnote
Conflicts of Interest: The authors have no conflicts of interest to declare.
References
- Chen W, Zheng R, Zuo T, et al. National cancer incidence and mortality in China, 2012. Chin J Cancer Res 2016;28:1–11. [PubMed] DOI:10.3978/j.issn.1000-9604.2016.02.08
- He J, Chen W. Chinese cancer registration report, 2012.Beijing: Military Medical Science Press, 2012.
- Xu C, Cai P, Zhang Y, et al. Results and analysis of expenditure on prevention and treatment for malignant tumor in China in 2010. Zhongguo Wei Sheng Jing Ji (in Chinese) 2014;33:24–6.
- China Health and Family. Planning Statistical Yearbook, 2016.Beijing: China Union Medical College Press, 2016.
- Zhou L, Guan P, Sun LP, et al. Health economic assessment for screening of gastric cancer in a high risk population in northeastern China. Chin J Cancer Res 2011;23:21–4. [PubMed] DOI:10.1007/s11670-011-0021-7
- Gelband H, Sankaranarayanan R, Gauvreau C, et al. Costs, affordability, and feasibility of an essential package of cancer control interventions in low-income and middle-income countries: key messages from Disease Control Priorities, 3rd edition. Lancet 2016;387:2133–44. [PubMed] DOI:10.1016/S0140-6736(15)00755-2
- Keating NL, Landrum MB, Huskamp HA, et al. Dartmouth atlas area-level estimates of end-of-life expenditures: How well do they reflect expenditures for prospectively identified advanced lung cancer patients? Health Serv Res 2016;51:1584–94. [PubMed] DOI:10.1111/hesr.2016.51.issue-4
- Hirth RA, Chernew ME, Miller E, et al. Willingness to pay for a quality-adjusted life year: in search of a standard. Med Decis Making 2000;20:332–42. [PubMed] DOI:10.1177/0272989X0002000310
- Adam T, Evans DB. Determinants of variation in the cost of inpatient stays versus outpatient visits in hospitals: a multi-country analysis. Soc Sci Med 2006;63:1700–10. [PubMed] DOI:10.1016/j.socscimed.2006.04.023
- Goldstein H, Rasbash J, Yang M, et al. A multilevel analysis of school examination results. Oxf Rev Educ 1993;19:425–33. DOI:10.1080/0305498930190401
- Adam T, Evans DB, Ying B, et al. Variability in costs across hospital wards. A study of Chinese hospitals. PLoS One 2014;9:e97874. [PubMed] DOI:10.1371/journal.pone.0097874
- GBD 2015 DALYs and HALE Collaborators. Global, regional, and national disability-adjusted life-years (DALYs) for 315 diseases and injuries and healthy life expectancy (HALE), 1990-2015: a systematic analysis for the Global Burden of Disease Study 2015. Lancet 2016;388:1603–58. [PubMed] DOI:10.1016/S0140-6736(16)31460-X
- Ning M, Zhang Q, Yang M. Comparison of self-reported and biomedical data on hypertension and diabetes: findings from the China Health and Retirement Longitudinal Study (CHARLS). BMJ Open 2016;6:e009836. [PubMed] DOI:10.1136/bmjopen-2015-009836