
Comparison of cancer incidence and mortality in three GDP per capita levels in China, 2013
Introduction
Cancer is a major public health problem in China and has been the leading cause of death since 2010 (1). The findings of International Agency for Research on Cancer (IARC) showed that in 2012, approximately 21.8% of the world’s new cases and 26.9% of the world’s deaths occurred in China (2), indicating therefore a heavy cancer burden in China (3). This burden could be even heavier. According to our recent researches, there were more than 10,000 new cancer cases diagnosed and about 6,100 cancer deaths every day in 2013 (4), whereas the numbers were predicted to increase to 12,000 and 7,500 respectively in 2015 (5). A rising temporal trend could also be found in incidence and mortality rates (6-9). The crude incidence and mortality rates of all cancers were 235.23/100,000 and 148.81/100,000 in 2010 (6), whereas they were 284.55/100,000 and 176.28/100,000 respectively in 2013 (9).
These rising trends of cancer burden can be attributed to the aging and growing population as well as the rapid economic development. Of all the influential factors on cancer epidemiology, economic factors, especially the economic development, have always played an important role. One of the most widely used measures for comparing economic development is gross domestic product per capita (GDPPC). On the international scale, the relation between cancer disparity and the economic development has already been well studied. Prostate cancer, which had the highest age-standardized incidence rate (ASIR) in all cancer types for men in more developed areas, was also the second most common cancer for men worldwide. It, together with breast cancer, the most common cancer and the leading cause of cancer death for women worldwide (10), was the two most studied cancer types. That the incidence rate of prostate cancer was greater in countries with higher GDPPC or more developed areas had been pointed out by many researchers (10-13). The mortality rate was comparatively low in these countries, yet still higher than less developed regions (10,12,13). As for breast cancer, wealthier countries tended to have higher incidence rate (14,15), with the ASIR in more developed countries two times as high as in less developed countries (10). In China, positive correlation between breast cancer mortality rate and GDPPC was found (16). Researches based on GLOBOCAN data showed that liver cancer incidence and mortality was negatively correlated with GDPPC (17), and cervical cancer incidence and mortality rates in developing countries were two-fold and three-fold higher respectively than women in developed countries (18). A study on women in the USA showed agreeable relation between poverty and cervical cancer incidence and mortality rates (19).
Along with the economic development, the distribution of risk factors for cancer in Chinese population changes. The influence of economic variations on cancer patterns in China has not been as well studied as that on the international scale. Furthermore, detailed research of this influence on especially all cancer types in China is yet to be published. In this article, using data on GDPPC, we provide an in-depth overview of cancer incidence and mortality in China in 2013, including a comparison of cancer patterns in three GDPPC levels.
Materials and methods
Data sources
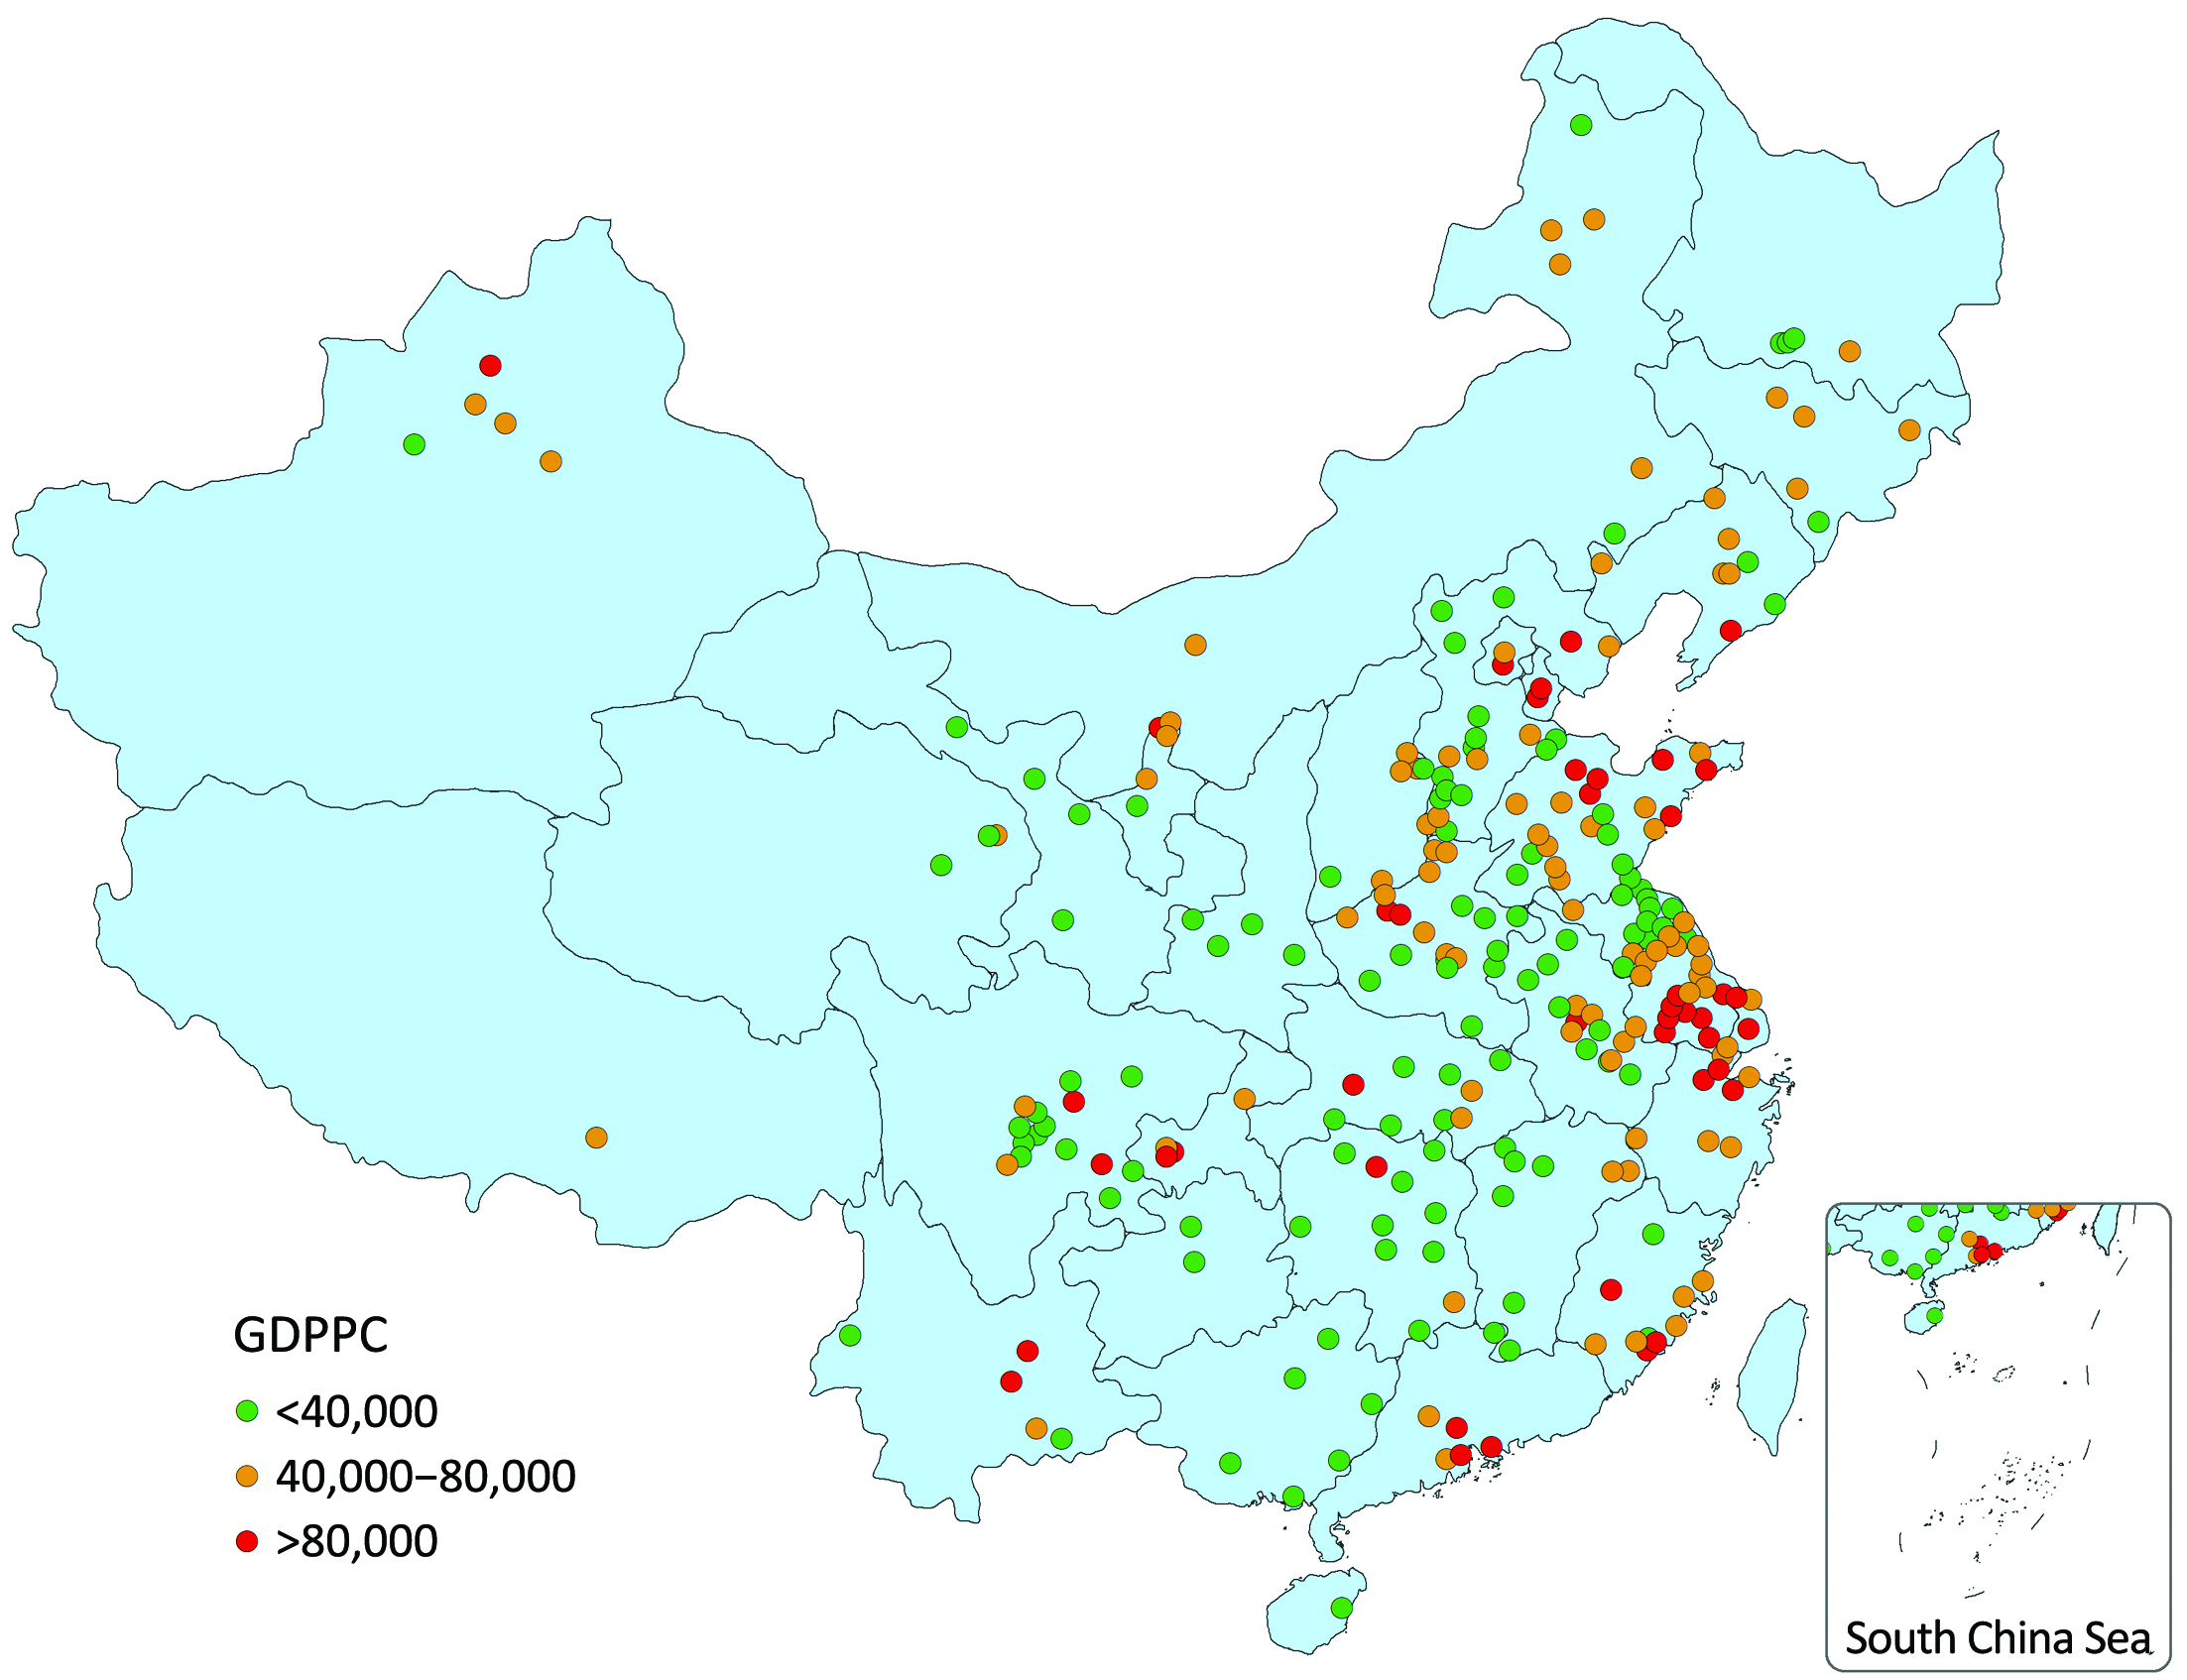
Population-based cancer registry data of 2013 were used in this study, including 255 qualified cancer registries which are distributed in 31 provinces, covering 16.65% of the national population at the end of 2013 (4,9). GDPPC data were obtained from the publication of National Bureau of Statistics and Ministry of Public Security (20,21). The geographical distribution of these 255 cities/counties is shown in Figure 1 stratified by GDPPC level.
Statistical analysis
All the 255 qualified registries were classified into high-, middle- and low-GDPPC areas with 40,000 RMB per year and 80,000 RMB per year as the cut points. Cancer incidence and mortality were calculated by gender and age group in different areas. The numbers of new cases, incidence rates and mortality rates of the top 10 cancers were reported in each GDPPC level. We used the Chinese population in 2000 and World Segi’s population to calculate the age-standardized rates. The cumulative risk of developing or dying from cancer before 75 years old (in the absence of competing causes of death) was calculated and presented as percentage. All statistical analysis was conducted by SAS software (SAS Institute Inc., Cary, NC, USA).
Results
Brief description of GDPPC
The values of GDPPC were not normally distributed. In all 255 cities/counties in 2014, the median of GDPPC (RMB per year) was 42,485, while the maximum and minimum were 183,480 and 7,413 respectively. The 25th percentile was 28,773 and the 75th percentile was 66,777. The 255 registries (88 in cities and 167 in counties) were classified into 43 high-GDPPC areas (28 cities and 15 counties), 95 middle-GDPPC areas (29 cities and 66 counties) and 117 low-GDPPC areas (31 cities and 86 counties). The median value of GDPPC in high-, middle- and low-GDPPC areas were 98,305, 53,771 and 27,580, respectively.
Incidence of overall cancers
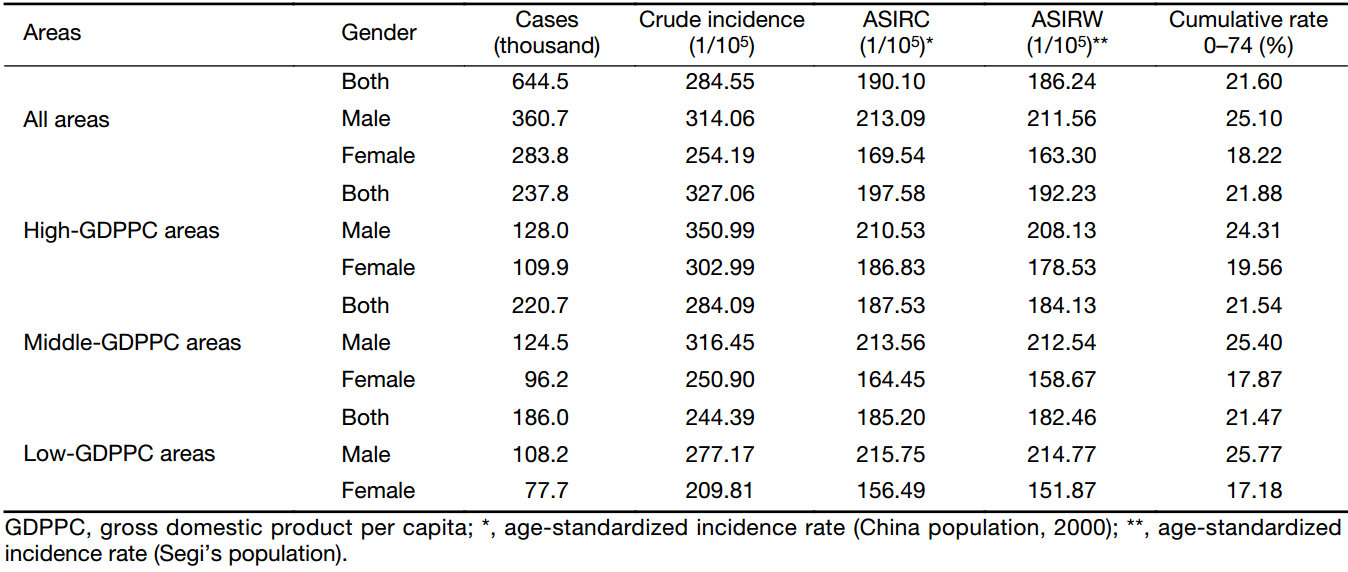
The result of cancer incidences in three GDPPC levels is displayed in Table 1. In 2013, about 644,500 new cases in the 255 cancer registries were diagnosed as cancer. The crude incidence rate in middle-GDPPC areas (284.09/100,000) was close to that in all areas (284.55/100,000), with high-GDPPC areas having a higher rate (327.06/100,000) and low-GDPPC areas having a lower rate (244.39/100,000). A similar association could be found in ASIR. Sex-specific crude incidence rates showed a positive association with GDPPC levels like the whole population in each GDPPC level did, as well as the ASIR for females. However, after adjusted by age, the incidence rate for males contradicted the association above, with the rates of 210.53/100,000, 213.56/100,000 and 215.75/100,000 in the high-, middle- and low-GDPPC areas respectively. Furthermore, the ASIR for males in each GDPPC level was higher than that for females, although the difference was not substantial.
Full table
Mortality of overall cancers
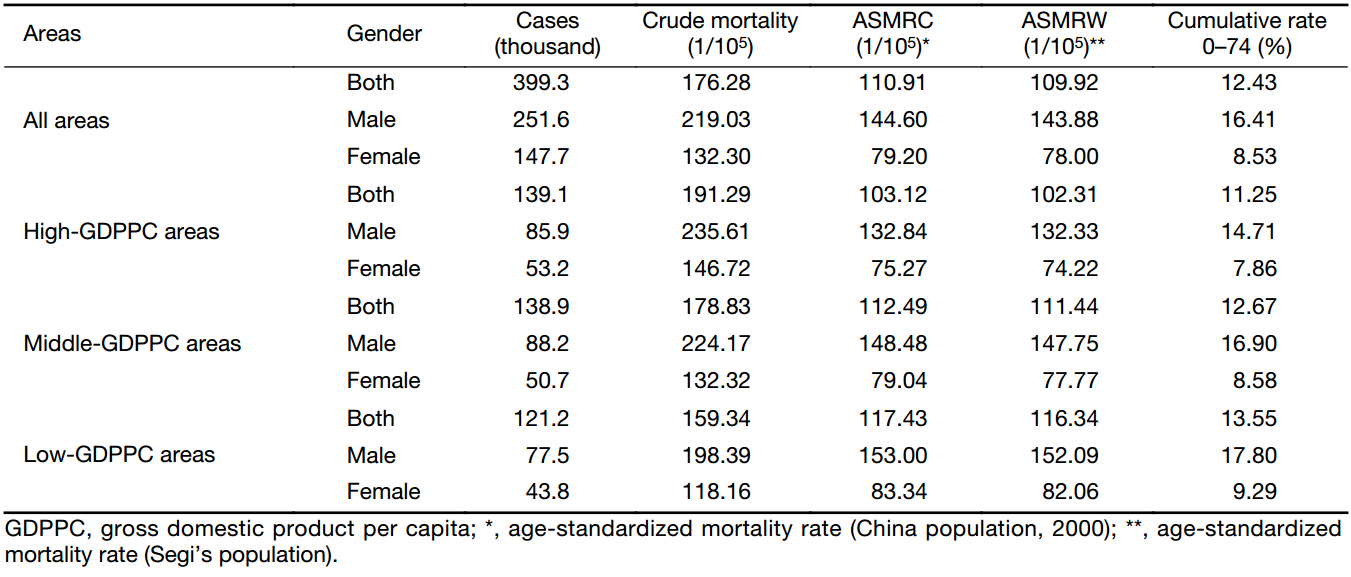
The result of cancer mortalities in three GDPPC levels is displayed in Table 2. In 2013, there were about 399,300 cancer death cases in the 255 cancer registries. The crude mortality rate in middle-GDPPC areas (178.83/100,000) was close to that in all areas (176.28/100,000), with high-GDPPC areas having a higher rate (191.29/100,000) and low-GDPPC areas having a lower rate (159.34/100,000). A similar association could be found in sex-specific mortality rates. After adjusted by age, nevertheless, the mortality rates of not only the whole population, but also each gender, contradicted the association above and showed negative associations with GDPPC levels. The age-standardized mortality rate (ASMR) in high-, middle- and low-GDPPC areas were 103.12/100,000, 112.49/100,000 and 117.43/100,000 respectively. The ASMR for males in each level was higher than that for females, and the difference was substantial. Mostly the rate for males was two times as high as the rate for their female counterparts.
Full table
Age-specific incidence and mortality rates
The age-specific incidence rate stayed relatively low before 40 years old, while increased dramatically since then and peaked at the age of 80–84 years old. This pattern of age-specific incidence rate was similar in each GDPPC level (Figure 2). In high-GDPPC areas, women between 10 and 54 years old had a higher incidence rate compared with their male counterparts, while in middle- and low-GDPPC areas, 20 to 49 years old. To the age groups not mentioned above, the incidence rates for males were always higher than that for females.

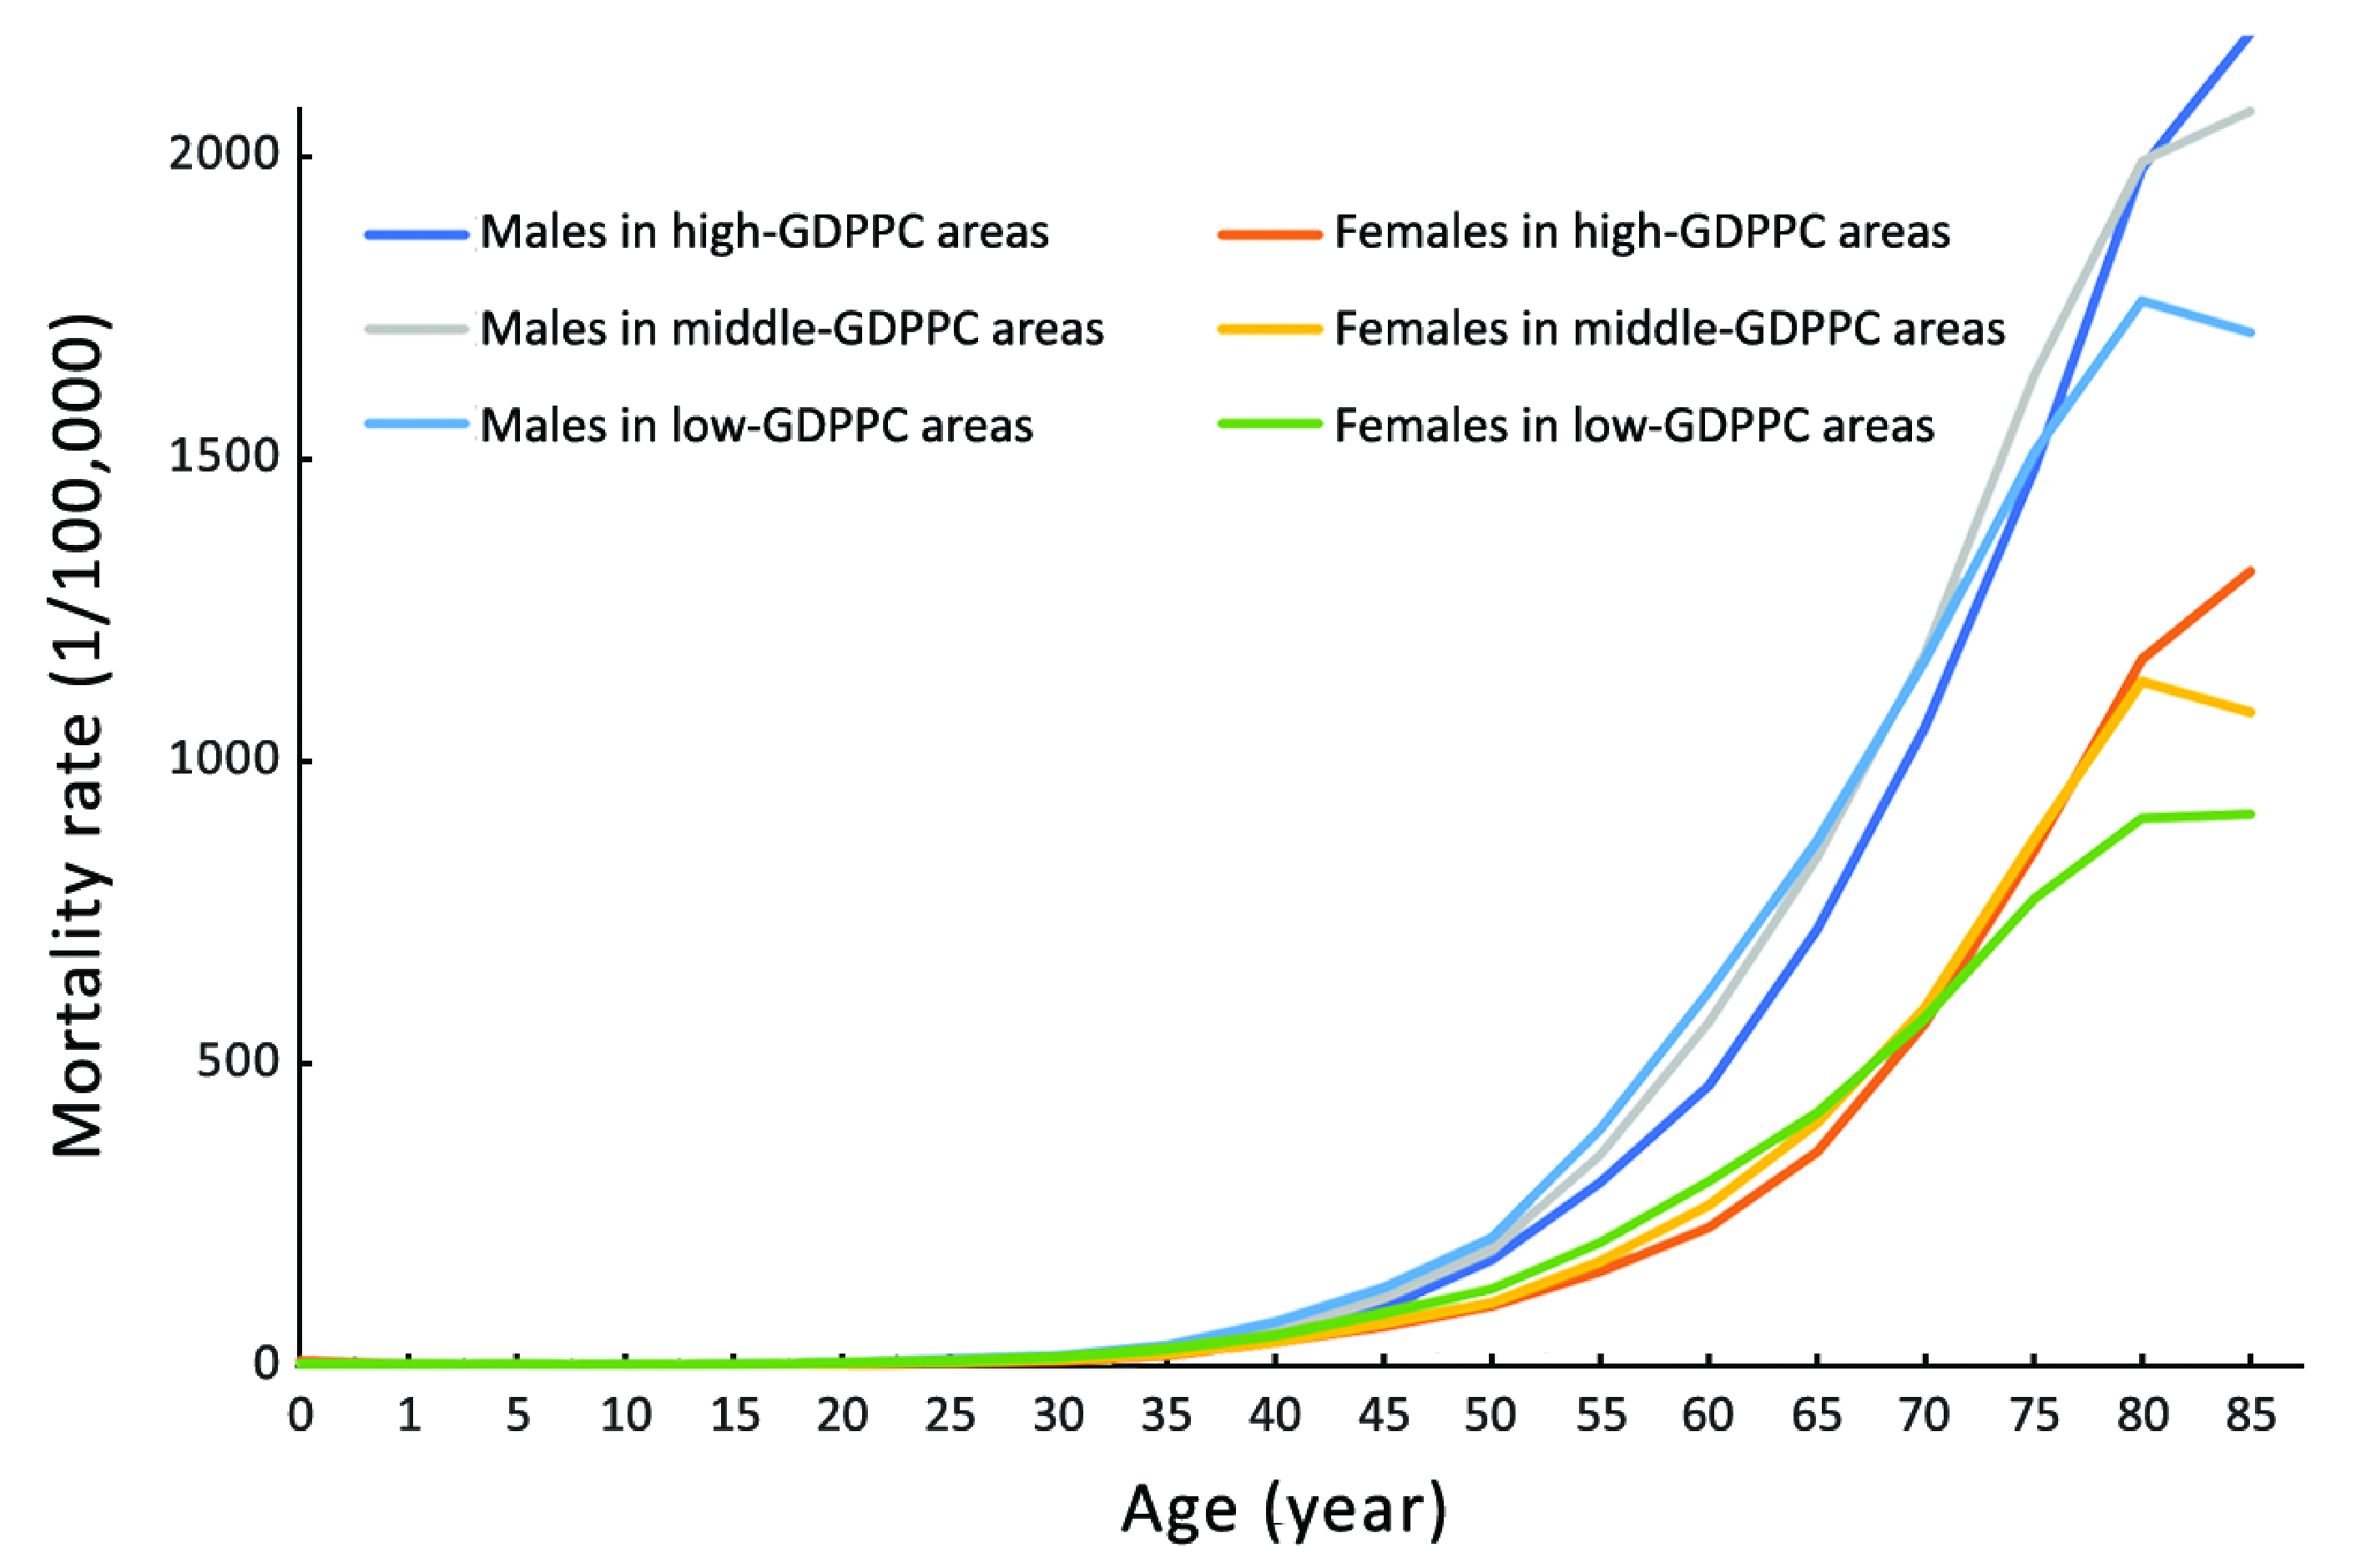
The age-specific mortality rate stayed relatively low before 50 years old, while increased dramatically since then and peaked at 80–84 or more than 85 years old. This pattern of age-specific mortality rate was similar in each GDPPC level (Figure 3). To almost all the age groups in every GDPPC level, the mortality rates for males were always higher than that for females.
Top ten leading cancer types for new cancer cases
The top 10 cancer incidence rates in three GDPPC levels are displayed in Table 3. In 2013, about 46,200, 45,400 and 39,100 people were diagnosed as lung cancer in high-, middle- and low-GDPPC areas respectively, making lung cancer the most common cancer in every GDPPC level. Colorectal cancer, stomach cancer, breast cancer and liver cancer were the other cancer types with leading incidence rate in high-GDPPC areas, while in middle- and low-GDPPC areas, stomach, liver, esophageal and colorectal cancers, with the same ranking. Lung cancer showed a negative association with GDPPC level. A similar association of ASIR could also be found in stomach, liver and esophageal cancers, with high-GDPPC areas having a lower rate and low-GDPPC areas having a higher rate. Colorectal cancer, nevertheless, showed a positive association, with high-GDPPC areas having the highest ASIR. Lung, stomach, colorectum, liver and esophagus were the top 5 cancer sites for males in each GDPPC level, only with different rankings. As for females, breast cancer had the top incidence rate in high- and middle-GDPPC areas but dropped to the second place in low-GDPPC areas. The ASIR of breast cancer and colorectal cancer showed a positive association with GDPPC level. Similar associations like their male counterparts could be found in stomach cancer, liver cancer and esophageal cancer.
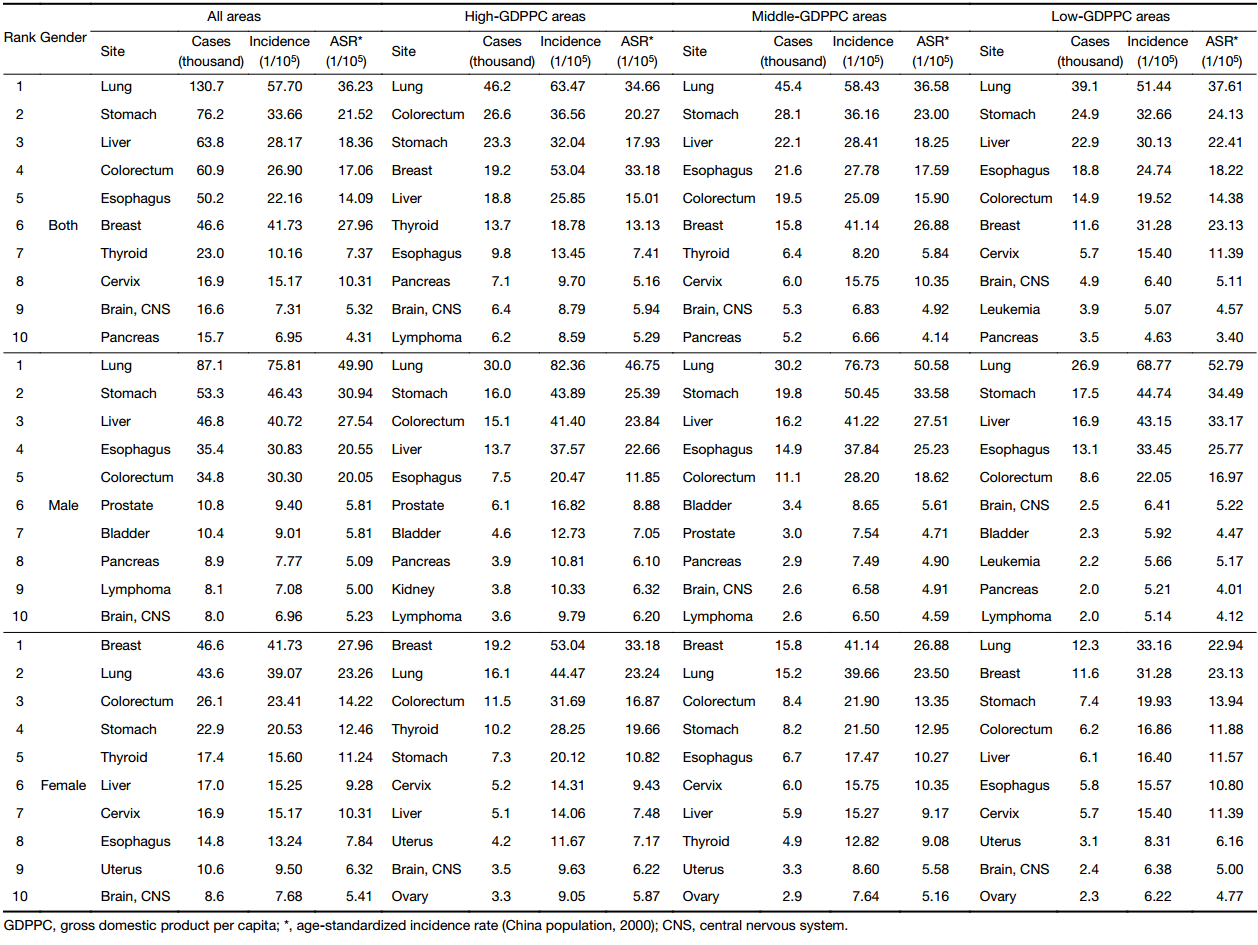
Full table
Top ten leading cancer types for deaths
The top 10 cancer mortality rates in three GDPPC levels are displayed in Table 4. In 2013, about 38,600, 36,500 and 31,200 people died of lung cancer in high-, middle- and low-GDPPC areas respectively, making lung cancer the leading cause of death, regardless of gender or GDPPC level. Stomach cancer, liver cancer, colorectal cancer and esophageal cancer were the other top causes of cancer death both in the whole population and in males in each GDPPC level, only with different rankings. As for females, the top five leading causes of cancer death were lung, colorectal, stomach, liver and breast cancers in high-GDPPC areas, lung, stomach, liver, esophageal and colorectal cancers in middle-GDPPC areas, and lung, stomach, liver, esophageal and breast cancers in low-GDPPC areas. The ASMR of lung cancer was higher in middle- and low-GDPPC areas than in high-GDPPC areas. A similar association could also be found in stomach and liver cancers. Colorectal cancer, however, showed a positive association, with high-GDPPC areas having the highest ASMR.
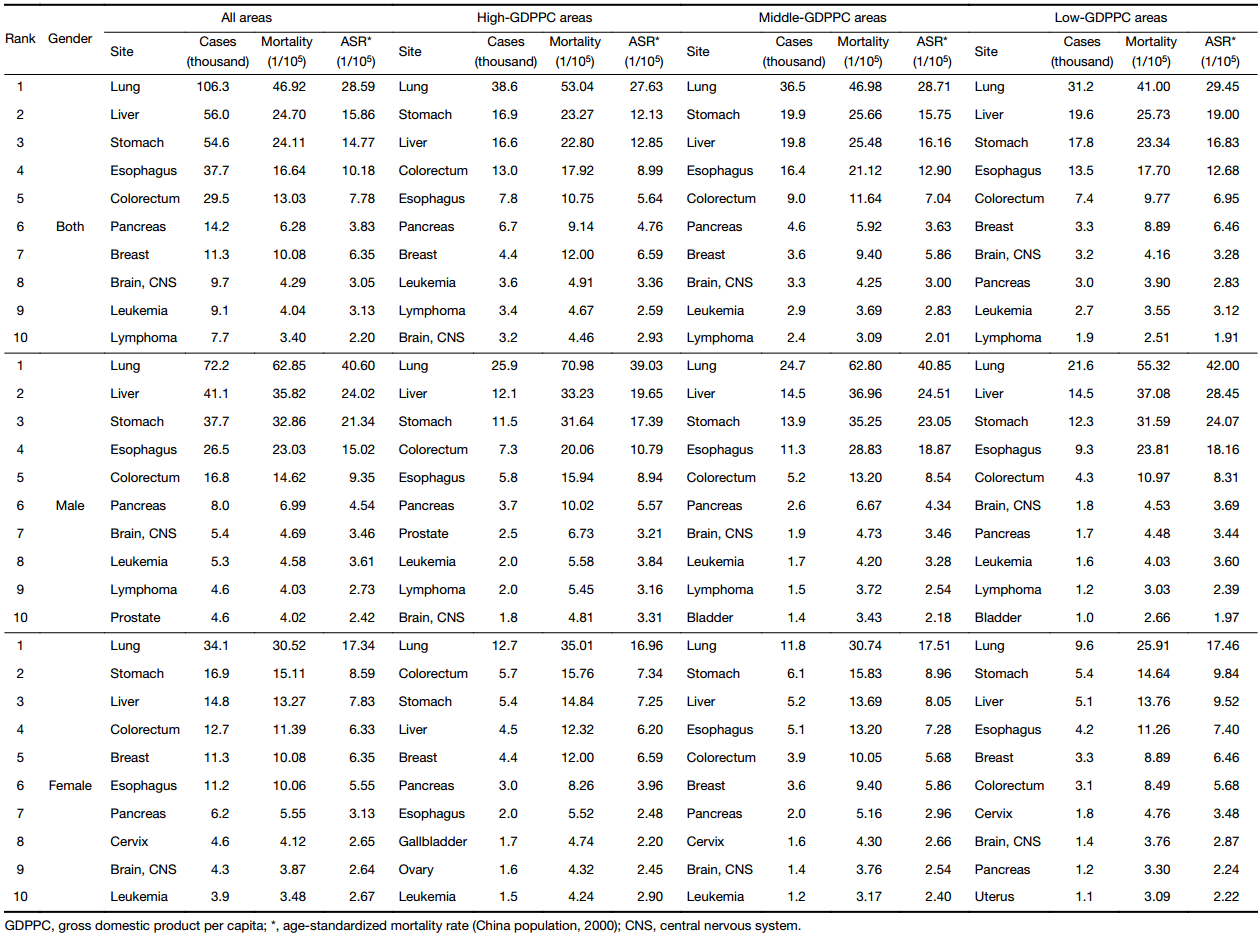
Full table
Discussion
This study is, to our knowledge, the first in China to show the variation of all-sites cancer incidence and mortality in different GDPPC levels. Economic factors, of which GDPPC is a commonly quoted indicator, have always played an important role in cancer epidemiology. Internationally, there are already many articles on the difference of the incidence and mortality of a certain cancer type in countries or states with different economic developments, when it comes to all cancer types, nevertheless, the articles are not as many. With regard to China, there are only a handful of articles on the association between economic factors and the pattern of a certain cancer in certain cities (16,22).
High-GDPPC areas had both the highest crude incidence and mortality rates, followed by middle- and low-GDPPC areas. Agreeable results could be found in a research based on GLOBOCAN 2012 showing that all-sites cancer incidence rate in Western Europe was more than twice as high as that in Eastern Africa, whereas mortality rates were 8% to 15% higher in more developed countries (10). Colorectal cancer and breast cancer were two of the major contributors to the high incidence rate in high-GDPPC areas as Table 3 showed. This echoed the result of our recent research on the relation between cancer incidence and mortality with urbanization level in China (9). In 2013, breast cancer accounted for 17.07% of all new cancer cases in Chinese females (4). A study in Europe showed that incidence rates of breast cancer were much higher in developed Western European countries like France and the UK than in developing Eastern European countries like Ukraine and Moldova (23). Therefore, it was reasonable to find a high incidence rate of breast cancer in high-GDPPC areas in China. This variation in incidence may reflect the differences in the availability of early detection and risk factors in three GDPPC levels. Reproductive factors and the use of oral contraceptives are the main risk factors of breast cancer (24), and they vary significantly across China owing to the contradiction between traditional concept and westernized concept alongside with the economic development. Colorectal cancer is also well-known for its relation with a westernized lifestyle, obesity and other factors that are easy to find in an affluent society (25). The high incidence of breast cancer and colorectal cancer in high-GDPPC areas agreed with the researches in developed countries (14,15,26,27), which further proved our result.
The ASIRs showed similar associations with GDPPC levels like crude rates. The association between ASMR and GDPPC level nevertheless was exactly opposite to that of crude rate, with high-GDPPC areas having the lowest ASMR and low-GDPPC areas having the highest. This disparity can be attributed to the younger age structure, immaturity of the tobacco epidemic and competing causes of death in less developed areas with lower GDPPC (10), while the growing and aging population in high-GDPPC areas contributed to the overall high crude mortality rate (5,9), since the incidence and mortality rates for most cancers increase rapidly with age. In terms of the low ASMR in high-GDPPC areas, a study in major developed countries pointed out that countries with the greatest proportional increase in GDP expenditure on health had the biggest reduction in cancer deaths and vice versa (28). Affluent cities/counties are more likely to spend a larger proportion of GDP on health, which may lead to easier access to better medical sources for the citizens, while people in poor cities/counties cannot have. As a result, a better prognosis and a lower ASMR were achieved.
Lung cancer, accounting for about 23.86% of all new cancer cases in Chinese males in 2013 (4), was the most common cancer in all GDPPC levels and both genders except females in high- and middle-GDPPC areas, where it was replaced by breast cancer. Same ranking of it for females in differently developed countries was reported by other researchers (10). Lung cancer was also the leading cause of cancer death throughout the population covered by this research, regardless of gender or GDPPC level. The burden of lung cancer was similar in Korea, since it was the third common cancer in incidence and the most common cancer resulting in death (29). Despite the low prevalence of smoking, incidence of lung cancer in Chinese women was higher than their counterparts in Europe (10). This may be owing to the indoor air pollution from unventilated coal-fueled stoves and cooking fumes (30), especially in less developed areas with lower GDPPC. In 2012, lung cancer was the most fatal cancer for males in all European countries except Sweden, and was one of the top three fatal cancers for females in most European countries (23). Tobacco smoking is an undisputed carcinogen of lung cancer. Recent study also found its relation with cancers in other organs including esophagus, pancreas, stomach, liver, kidney and even uterine cervix (31). Although the burden of lung cancer is heavy worldwide, it is one of the most preventable cancers. A study carried out in the USA showed that tobacco control was effective and could reduce significantly the number of lung cancer death (32). Therefore, it is urgent to continue the implemented tobacco control policy in China.
Stomach cancer, esophageal cancer and liver cancer had higher incidence and mortality rates in middle and low-GDPPC areas than in high-GDPPC areas. On the global scale, many researches agreed with our finding, pointing out that countries with higher levels of GDPPC reported low incidence and mortality rates of these cancers (17,26). Prevalence of stomach and liver cancers has always been high in East Asian countries compared with not only other continents but also other Asian countries (17,33). Furthermore, the age-standardized five-year net survival from liver cancer was generally low both in the developed and developing world (34). And the mortality rate of liver cancer ranked higher than its incidence rate in our study, regardless of GDPPC level. As for esophageal cancer, it is even more popular in China because it occurred in China at a rate of 20 to 30 times higher than in the USA and far above average level in the world (35). However, significantly declining trends in incidence and mortality were observed for these three cancers, to which the control of hepatitis B virus (HBV) and hepatitis C virus (HCV) for liver cancer and Helicobacter pylori for stomach cancer may contribute (5).
Understanding cancer pattern is important in the monitoring of cancer control and in the evaluation of changes in cancer risks and the effectiveness of health care. Therefore, enlarging cancer registration areas and enhancing cancer registration qualification should be the priority. With the continuous economic development, the burden of cancer in China will keep rising and differentiating in the near future. As a consequence, targeted prevention, early detection and treatment programs should be carried out accordingly.
Conclusions
The crude incidence and mortality rates showed positive associations with GDPPC levels, with high-GDPPC areas having the highest crude rates followed by middle- and low-GDPPC areas. The ASIR was highest in high-GDPPC areas and lowest in low-GDPPC areas, whereas the ASMR was highest in low-GDPPC areas and lowest in high-GDPPC areas. Other than lung cancer, which was the most common cancer as well as the leading cause of cancer death in all areas, the incidence and mortality patterns for the major cancers varied in each GDPPC level. Middle- and low-GDPPC areas had higher ASIR and ASMR for stomach, liver and esophageal cancers than high-GDPPC areas. As for colorectal cancer, the ASIR and ASMR were positively associated with GDPPC levels. Therefore, economic factors can influence the epidemiology of cancers and the economic development is one of the main factors of the heavy cancer burden on Chinese population. It would be reasonable to implement cancer control strategies referring to the local GDPPC level.
Acknowledgements
We acknowledged the cooperation of all the population-based cancer registries in providing cancer statistics, data collection, sorting, verification and database creation. This work was supported by Ministry of Science and Technology of China (Grant No. 2014FY121100), CAMS Innovation Fund for Medical Sciences (CIFMS) (Grant No. 2016-12M-2-004), National Key Research and Development Program (Grant No. 2016YFC1302502) and the Basic Research Fund of Central Public Welfare Scientific Institute (Grant No. 2016ZX310182-2).
Footnote
Conflicts of Interest: The authors have no conflicts of interest to declare.
References
- National Bureau of Statistics of China. China Statistical Yearbook, 2010. Beijing: China Statistics Press, 2010.
- Ervik M, Lam M, Ferlay J, et al. Cancer Today. Lyon, France: International Agency for Research on Cancer, 2016. Available online: http://gco.iarc.fr/today
- Chen W. Cancer statistics: updated cancer burden in China. Chin J Cancer Res 2015;27:1. [PubMed] DOI:10.3978/j.issn.1000-9604.2015.02.07
- Chen W, Zheng R, Zhang S, et al. Cancer incidence and mortality in China, 2013. Cancer Lett 2017;401:63–71. [PubMed] DOI:10.1016/j.canlet.2017.04.024
- Chen W, Zheng R, Baade PD, et al. Cancer statistics in China, 2015. CA Cancer J Clin 2016;66:115–32. [PubMed] DOI:10.3322/caac.21338
- Chen W, Zheng R, Zhang S, et al. Annual report on status of cancer in China, 2010. Chin J Cancer Res 2014;26:48–58. [PubMed] DOI:10.3978/j.issn.1000-9604.2014.01.08
- Chen W, Zheng R, Zeng H, et al. Annual report on status of cancer in China, 2011. Chin J Cancer Res 2015;27:2–12. [PubMed] DOI:10.3978/j.issn.1000-9604.2015.01.06
- Chen W, Zheng R, Zuo T, et al. National cancer incidence and mortality in China, 2012. Chin J Cancer Res 2016;28:1–11. [PubMed] DOI:10.3978/j.issn.1000-9604.2016.02.08
- Chen W, Zheng R, Zhang S, et al. Cancer incidence and mortality in China in 2013: an analysis based on urbanization level. Chin J Cancer Res 2017;29:1–10. [PubMed] DOI:10.21147/j.issn.1000-9604.2017.01.01
- Torre LA, Bray F, Siegel RL, et al. Global cancer statistics, 2012. CA Cancer J Clin 2015;65:87–108. [PubMed] DOI:10.3322/caac.21262
- Wong MC, Goggins WB, Wang HH, et al. Global incidence and mortality for prostate cancer: analysis of temporal patterns and trends in 36 countries. Eur Urol 2016;70:862–74. [PubMed] DOI:10.1016/j.eururo.2016.05.043
- Neupane S, Bray F, Auvinen A. National economic and development indicators and international variation in prostate cancer incidence and mortality: an ecological analysis. World J Urol 2017;35:851–8. [PubMed] DOI:10.1007/s00345-016-1953-9
- Chen SL, Wang SC, Ho CJ, et al. Prostate cancer mortality-to-incidence ratios are associated with cancer care disparities in 35 countries. Sci Rep 2017;7:40003. [PubMed] DOI:10.1038/srep40003
- Coccia M. The effect of country wealth on incidence of breast cancer. Breast Cancer Res Treat 2013;141:225–9. [PubMed] DOI:10.1007/s10549-013-2683-y
- Chagpar AB, Coccia M. Breast cancer and socio-economic factors. Working Paper of Public Health 7/2012.
- Xia C, Kahn C, Wang J, et al. Temporal trends in geographical variation in breast cancer mortality in China, 1973-2005: An analysis of nationwide surveys on cause of death. Int J Environ Res & Public Health 2016;13:963. [PubMed] DOI:10.3390/ijerph13100963
- Wong MC, Jiang JY, Goggins WB, et al. International incidence and mortality trends of liver cancer: a global profile. Sci Rep 2017;7:45846. [PubMed] DOI:10.1038/srep45846
- Singh GK, Azuine RE, Siahpush M. Global inequalities in cervical cancer incidence and mortality are linked to deprivation, low socioeconomic status, and human development. Int J MCH AIDS 2012;1:17–30. [PubMed]
- Singh GK, Miller BA, Hankey BF, et al. Persistent area socioeconomic disparities in U.S. incidence of cervical cancer, mortality, stage, and survival, 1975-2000. Cancer 2004;101:1051–7. [PubMed] DOI:10.1002/cncr.20467
- Ministry of Public Security Authority. Demographic Statistics of the People’s Republic of China, 2012. Beijing: Qunzhong Press, 2014.
- Rural social and Economic Research Bureau of National Bureau of Statistics. China Statistical Yearbook (Township). Beijing: China Statistics Press, 2014.
- Wen D, He Y, Wei L, et al. Incidence rate of female breast cancer in urban Shijiazhuang in 2012 and modifiable risk factors. Thorac Cancer 2016;7:522–9. [PubMed] DOI:10.1111/1759-7714.12357
- Ferlay J, Steliarova-Foucher E, Lortet-Tieulent J, et al. Cancer incidence and mortality patterns in Europe: estimates for 40 countries in 2012. Eur J Cancer 2013;49:1374–403. [PubMed] DOI:10.1016/j.ejca.2012.12.027
- Li L, Ji J, Wang JB, et al. Attributable causes of breast cancer and ovarian cancer in China: reproductive factors, oral contraceptives and hormone replacement therapy. Chin J Cancer Res 2012;24:9–17. [PubMed] DOI:10.1007/s11670-012-0009-y
- Aran V, Victorino AP, Thuler LC, et al. Colorectal cancer: epidemiology, disease mechanisms and interventions to reduce onset and mortality. Clin Colorectal Cancer 2016;15:195–203. [PubMed] DOI:10.1016/j.clcc.2016.02.008
- Bray F, Jemal A, Grey N, et al. Global cancer transitions according to the Human Development Index (2008-2030): a population-based study. Lancet Oncol 2012;13:790–801. [PubMed] DOI:10.1016/S1470-2045(12)70211-5
- Banas T, Juszczyk G, Pitynski K, et al. Incidence and mortality rates in breast, corpus uteri, and ovarian cancers in Poland (1980–2013): an analysis of population-based data in relation to socioeconomic changes. Onco Targets Ther 2016;9:5521–30. [PubMed] DOI:10.2147/OTT.S112187
- Pritchard C, Hickish T. Changes in cancer incidence and mortality in England and Wales and a comparison of cancer deaths in the major developed countries by age and sex 1979-2002 in context of GDP expenditure on health. Ecancermedicalscience 2008;2:80. [PubMed] DOI:10.3332/eCMS.2008.80
- Jung KW, Shin HR, Kong HJ, et al. Long-term trends in cancer mortality in Korea (1983-2007): a joinpoint regression analysis. Asian Pac J Cancer Prev 2010;11:1451–7. [PubMed]
- IARC Working Group on the Evaluation of Carcinogenic Risks to Humans. Personal habits and indoor combustions. Lyon: International Agency for Research on Cancer, 2012.
- Vineis P, Alavanja M, Buffler P, et al. Tobacco and cancer: recent epidemiological evidence. J Nati Cancer Inst 2004;96:99–106. [PubMed]
- Moolgavkar SH, Holford TR, Levy DT, et al. Impact of reduced tobacco smoking on lung cancer mortality in the United States During 1975-2000. J Nati Cancer Inst 2012;104:541–8. [PubMed] DOI:10.1093/jnci/djs136
- Varghese C, Carlos MC, Shin HR. Cancer burden and control in the Western Pacific region: challenges and opportunities. Ann Glob Health 2014;80:358–69. [PubMed] DOI:10.1016/j.aogh.2014.09.015
- Allemani C, Weir HK, Carreira H, et al. Global surveillance of cancer survival 1995-2009: analysis of individual data for 25,676,887 patients from 279 population-based registries in 67 countries (CONCORD-2). Lancet 2015;385:977–1010. [PubMed] DOI:10.1016/S0140-6736(14)62038-9
- Zhang Y. Epidemiology of esophageal cancer. World J Gastroenterol 2013;19:5598–606. [PubMed] DOI:10.3748/wjg.v19.i34.5598