
Higher PD-1 expression concurrent with exhausted CD8+ T cells in patients with de novo acute myeloid leukemia
Introduction
Acute myeloid leukemia (AML) is an aggressive malignant disease with unfavorable prognosis for most subtypes. Moreover, the prognosis of this disease is related to the T cell immune status of patients (1). Increasing data have revealed that T cell immunodeficiency is a common characteristic of patients with leukemia that plays an important role in leukemia progression and promotes the expansion of malignant clones (1-3). However, different degrees of T cell dysfunctionality have been described for different leukemia subtypes and different cases (1). Previous studies have shown that such T cell immunodeficiencies are characterized by peripheral T cells that are incapable of interacting with blasts, reduced thymic output function, and oligoclonally restricted T cell repertoires, and led to low activation and low antigen responses. Moreover, the immunosuppressive microenvironment, including dysregulation of Th subset cytokines in the bone marrow, where both the innate and adaptive immune responses are profoundly deregulated, sustains and modulates the proliferation, survival, and drug resistance of AML (4-10).
Based on the T cell immune status of AML patients, targeted molecular therapies and immune-based therapies, such as a leukemia-associated antigen (LAA) vaccine and antigen-specific cytotoxic T cells, are under investigation for managing high-risk AML (2,11). Long-term complete remission (CR) was demonstrated for some AML cases with cellular cytotoxicity against myeloid leukemia cells (3). However, the effects of such immunotherapies vary for different cases, which may be due to the T cell suppression and exhaustion that is facilitated by the T cell inhibitory receptor. For example, upregulating of programmed death 1 (PD-1) and its ligand PD-L1 mediates CD8+ T cell dysfunction in chronic lymphocytic leukemia (CLL) (12).
PD-1 is a co-receptor that is expressed on T cells and interacts with its ligands upon TCR ligation, resulting in modulation of the T cell response. The PD-1 ligands PDL1 and PDL2 are expressed on antigen presenting cells (APCs) and many tumor cells. Significantly increased PD-1/PDL1 expression is related to immunosuppression in cancer and the enhancement of resistance to immunotherapy in cancer (13,14). Recently, researchers have focused on the context of T cell exhaustion, a state of T cell dysfunction defined by the increased expression of several inhibitory receptors in combination with poor effector function, which is a unique immune inhibitory mechanism that was first demonstrated for chronic viral infections in mice and recently reported in several cancers in humans. Such T cells lose their capacity to produce cytokines, such as interleukin 2 (IL-2), tumor necrosis factor-α (TNF-α) and interferon-γ (IFN-γ), as well as the ability to proliferate and produce cytotoxicity, ultimately undergoing apoptosis (15). It was demonstrated that leukemia cells such as CLL can induce an exhausted T cell phenotype in a CLL mouse model, and T cell exhaustion contributes to CLL pathogenesis (16). Moreover, the exhausted T cell phenotype could be identified as co-expressing PD-1, T cell immunoglobulin and mucin domain-containing protein 3 (Tim-3) on CD8+ T cells in mice with advanced AML (17). Furthermore, it was also reported that increased PD-1hiTim-3+ T cells could predict leukemia relapse in AML patients after allogeneic stem cell transplantation (allo-HSCT) (15). However, there were different findings regarding the role of such T cell inhibitory receptors in AML. For example, it was suggested that increased PD-1 expression is only observed at the time of relapse, and T cell exhaustion does not play a major role in AML (18). In addition, no significant impact of PD-1/PD-L1 expression on the survival of AML patients was observed in a study of a cohort of 90 patients (19). One reason explaining this result may be the immune heterogeneity found in different cohorts of patients and different leukemia subtypes.
In this study, we investigated the characteristics of the distribution of PD-1, CD244 and CD57 on CD3+, CD4+ and CD8+ T cells from patients with de novo AML and AML in CR. In our previous studies showing the cases in which there were low T cell activation and a significant difference in T cell dysfunction in AML (1,20), T cell exhaustion may have been a significant cause of this phenotype. There are few data regarding alterations in T cell exhaustion and T cell senescence in AML, particularly for Chinese leukemia cases.
Materials and methods
Samples
The peripheral blood samples used in this study were derived from 20 newly diagnosed, untreated AML patients including 10 males and 10 females (median age: 46 years, range: 11–81 years) and 10 cases with AML in CR including 4 males and 6 females (median age: 31.5 years, range: 20–59 years). The clinical data of the patients are listed in Table 1. Twenty-three healthy individuals including 10 males and 13 females (median age: 40 years, range: 19–78 years) served as controls. All human peripheral blood samples were obtained with informed consent. All procedures were conducted according to the guidelines of the Medical Ethics Committees of the Health Bureau of the Guangdong Province in China, and ethical approval was obtained from the Ethics Committee of the Medical School of Jinan University.
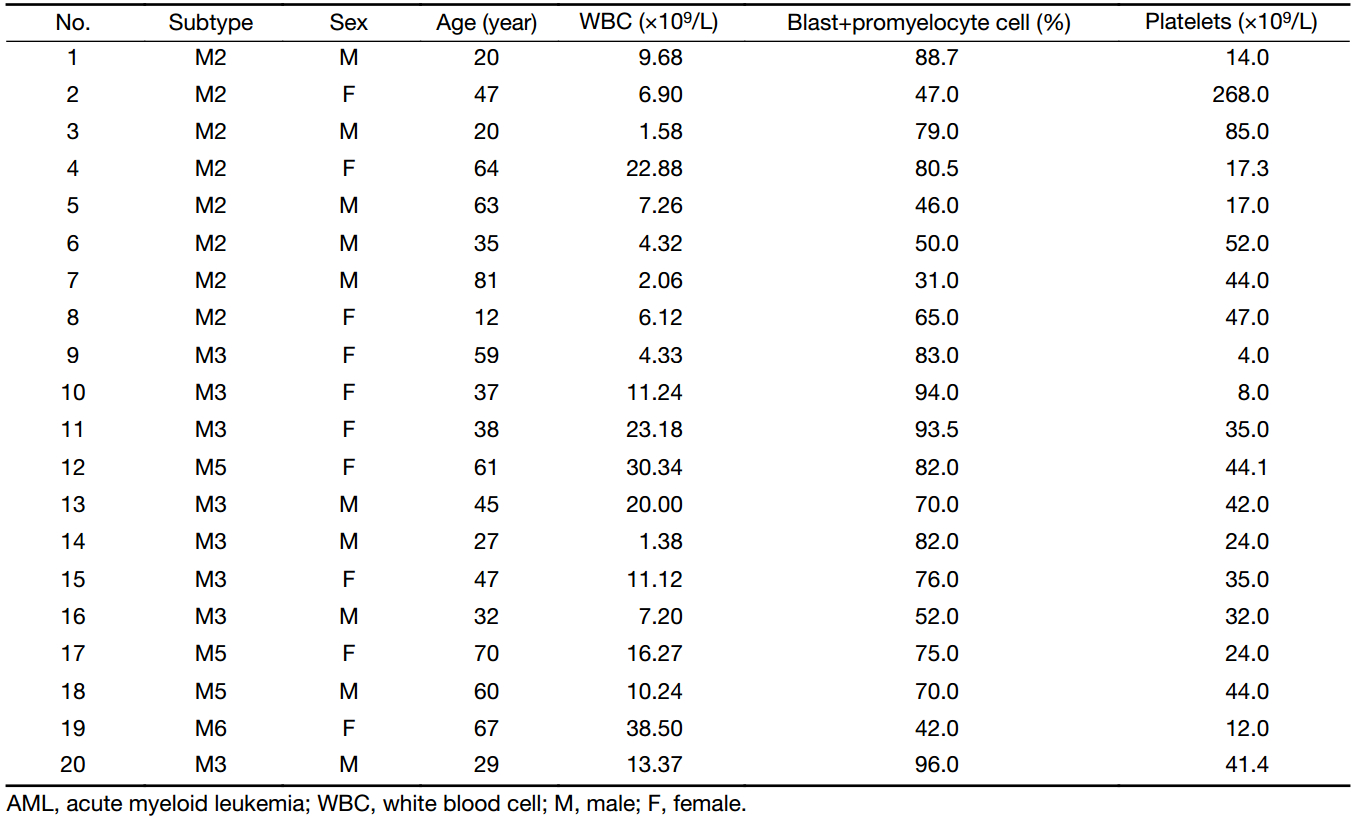
Full table
Sample preparation for flow cytometry
Cell surface staining analysis by flow cytometry was performed using the following antibodies (21): CD45-BV510 (clone HI30), CD3-FITC (clone HIT3a), CD8-PerCP/Cy5.5 (clone SK1), CD244 (2B4)-PE (clone C1.7), CD57-Pacific Blue (clone HCD57) (Biolegend, San Diego, USA), CD4-APC-H7 (clone RPA-T4), PD-1 (CD279)-PE-Cy7 (clone EH12.1), and a PE-Cy7 isotype control (clone MOPC-21) (BD Biosciences, San Jose, USA). Extracellular staining was performed according to the manufacturer’s instructions. First, 7 μL of conjugated fluorescent antibodies (different surface marker combinations) was added to 100 μL of each peripheral blood sample without plasma and incubated at room temperature for 15 min in the dark. Next, 2 mL 1× red blood cell (RBC) lysis buffer (BD) was then added to resuspend the stained sample, which was then incubated at room temperature for 20 min. Afterward, the mixture was centrifuged for 5 min at 350×g, and the supernatant was discarded to stop cell lysis. Finally, the cells were washed twice with 2 mL cell staining buffer by centrifugation at 350×g for 5 min and discarding the supernatant. The samples were resuspended with 0.5 mL staining buffer to prepare for flow cytometry analysis. A total of 30,000 CD3+ cells were analyzed with a BD FACS VERSE flow cytometer (BD Biosciences, San Jose, USA), and data analysis was performed with Flowjo software (Flowjo LLC, USA).
Statistical analyses
The frequency of PD-1+, CD57+, PD-1+CD57+ in CD3+, CD4+ or CD8+ T cells and CD244+CD8+ T cells was expressed as x±s, whereas medians were used for presentation the frequency of CD244+CD4+, PD-1+CD244+CD4+ T cells and PD-1+CD244+CD8+ T cells. Statistical analyses were performed using independent-sample t-test and Mann-Whitney test by SPSS software (Version 13.0; SPSS Inc., Chicago, IL, USA). P<0.05 was considered statistically significant.
Results
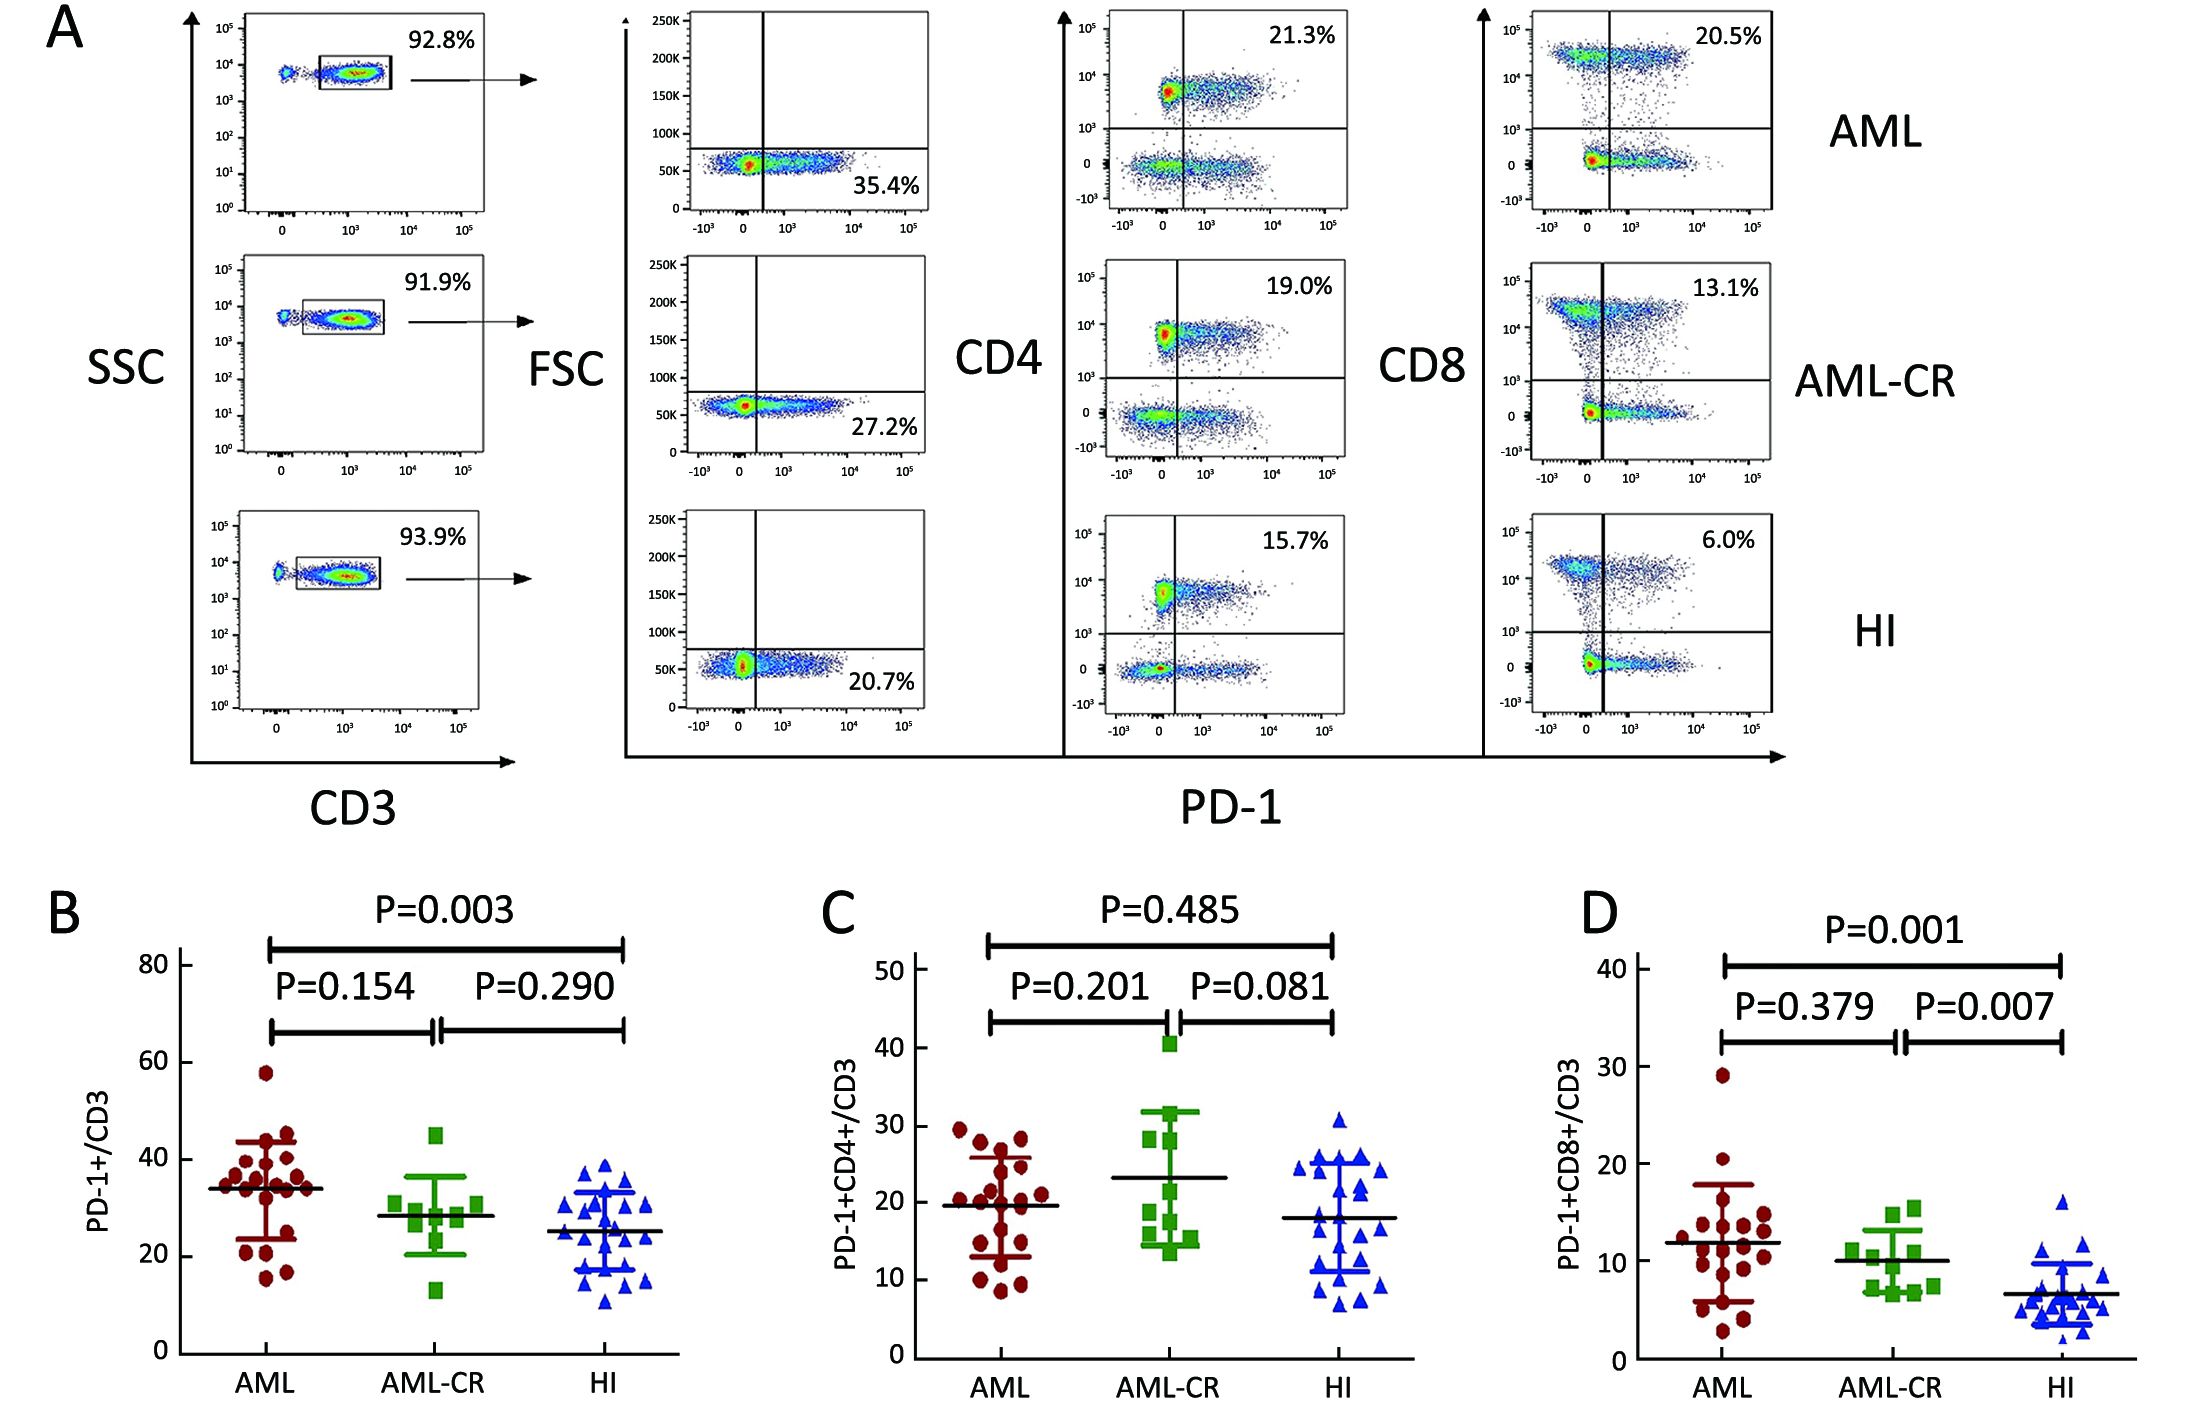
Increased PD-1+CD3+ and PD-1+CD8+ T cells in AML patients
We first detected the percentage of PD-1+ cells in the CD3+ T cell population, and a significantly higher PD-1+ cell percentage was found in peripheral blood from 20 patients with de novo AML (33.83%±10.30%) compared with 23 healthy individuals (25.16%±7.88%) (P=0.003). Therefore, we further analyzed the distribution of PD-1+ T cells in the CD4+ and CD8+ T cell subtypes, and an increased level of PD-1+CD8+ T cells in the CD3+ T cell population was found forde novo AML (11.81%±5.93%) and AML-CR (10.01%±3.14%) patients compared with healthy individuals (6.62%±3.10%) (P=0.001 and 0.007, respectively). For PD-1+CD4+ T cells, there was no significant difference betweende novo AML (19.48%±6.41%) and AML-CR samples (23.16%±8.76%) (P=0.201) or healthy controls (18.04%±6.92%) (P=0.485) (Figure 1). We also compared the PD-1 frequency on peripheral blood CD3+, CD4+ and CD8+ T cells between 8 cases with AML-M2 and 8 cases with AML-M3. The percentage of PD-1+CD3+, PD1+CD4+ and PD-1+CD8+ T cells in the M2 group (36.43%±7.65%, 21.53%±4.41%, and 12.46%±9.63%, respectively) appeared to be high compared with the M3 group (29.60%±9.56%, P=0.137; 16.21%±6.97%, P=0.090; and 9.63%±4.51%, P=0.215, respectively); however, the differences were not statistically significant.
We also analyzed the association between the PD-1+, CD57+ or CD244+ T cell numbers and the leukemia blast percentage in peripheral blood from AML patients, but the differences were not statistically significant (P=0.891, P=0.787 and P=0.121, respectively).
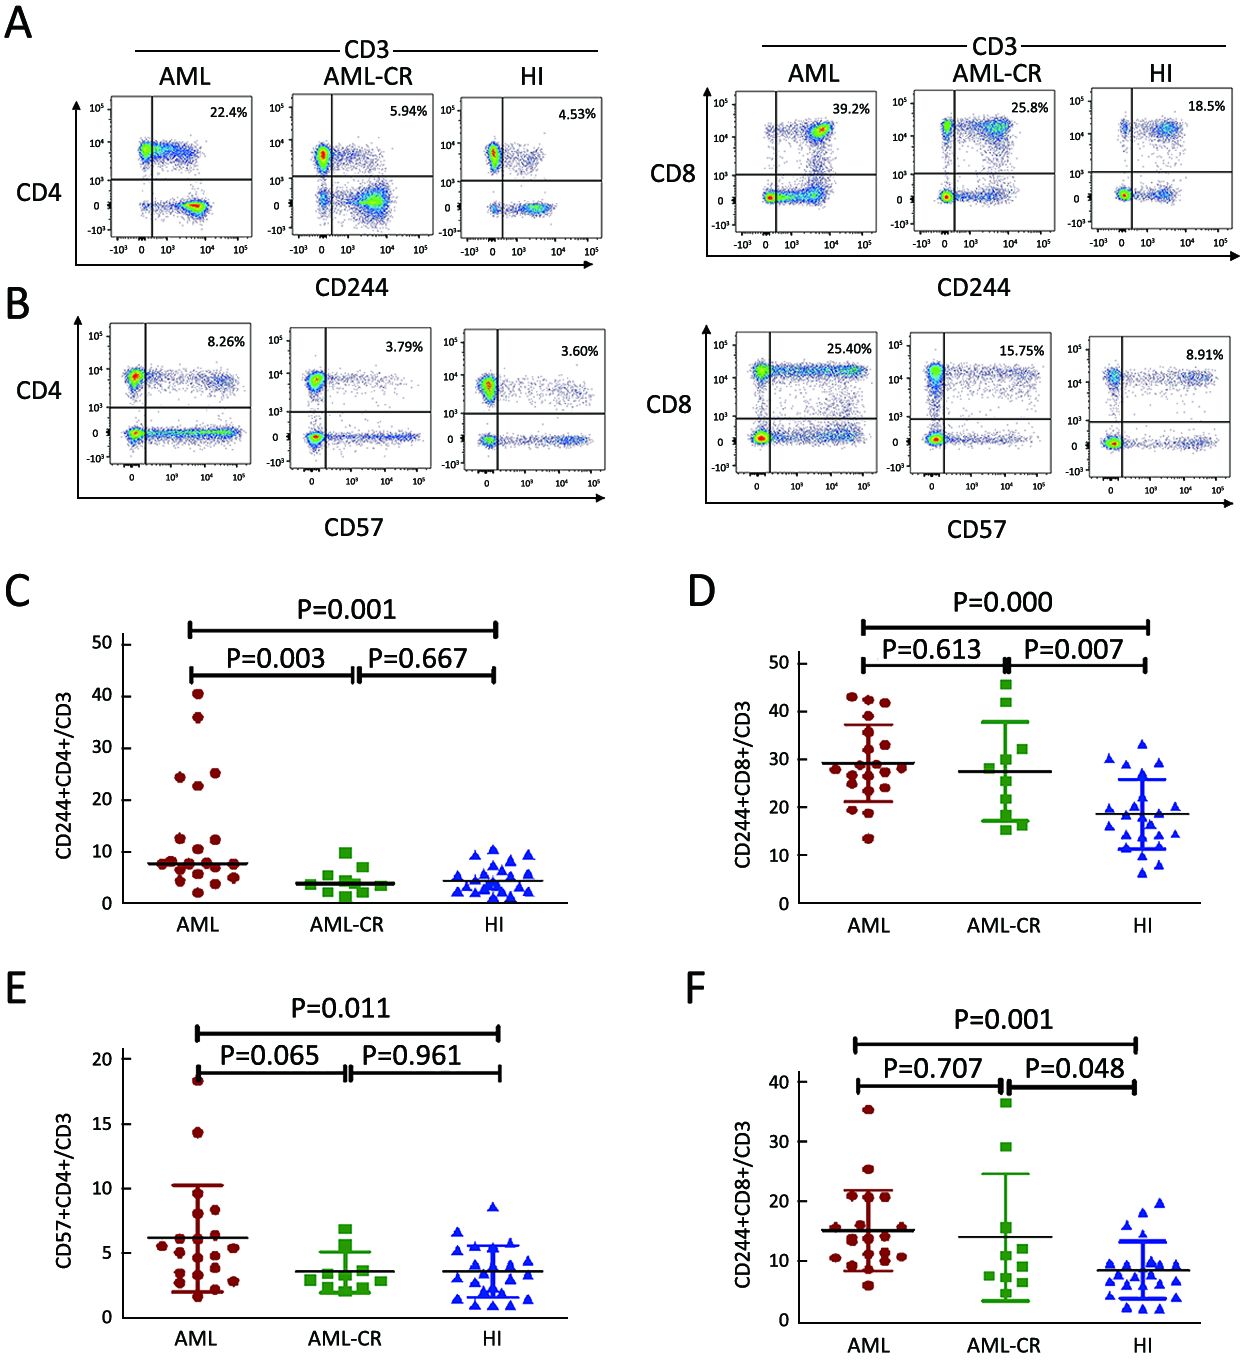
Frequency of CD244+ and CD57+ cells in CD3+, CD4+ and CD8+ T cell populations in AML
To evaluate the T cell status of patients with AML, we detected the exhaustion and immunosenescence markers CD244 and CD57 by flow cytometry analysis of T cells. A higher percentage of CD244+CD4+, CD244+CD8+, CD57+CD4+, and CD57+CD8+ T cells in the CD3+ T cell population was found for de novo AML samples compared with those from healthy individuals (median: CD244+CD4+ T cells: 7.70% vs. 4.31%, P=0.001; CD244+CD8+ T cells: 29.28%±8.03% vs. 18.52%±7.31%, P=0.000; CD57+CD4+ T cells: 6.15%±4.11%, P=0.011; CD57+CD8+ T cells: 15.3%±6.74% vs. 8.59%±4.76%, P=0.001). A higher percentage of CD244+CD4+ T cells was found for the de novo AML group compared with AML-CR group (median: 7.70% vs. 3.80%, P=0.003), and there was a similar trend demonstrating an increasing level of CD57+CD4+ T cells in the AML group compared with AML-CR group (6.15%±4.11% vs. 3.56%±1.58%, P=0.065); it is interesting that in CD4+ T cells, there was no significant difference in the CD244 and CD57 distribution between the AML-CR and healthy control groups, whereas in CD8+ T cells, an increasing level of CD244 and CD57 was found in AML-CR group compared with healthy control groups (Figure 2).
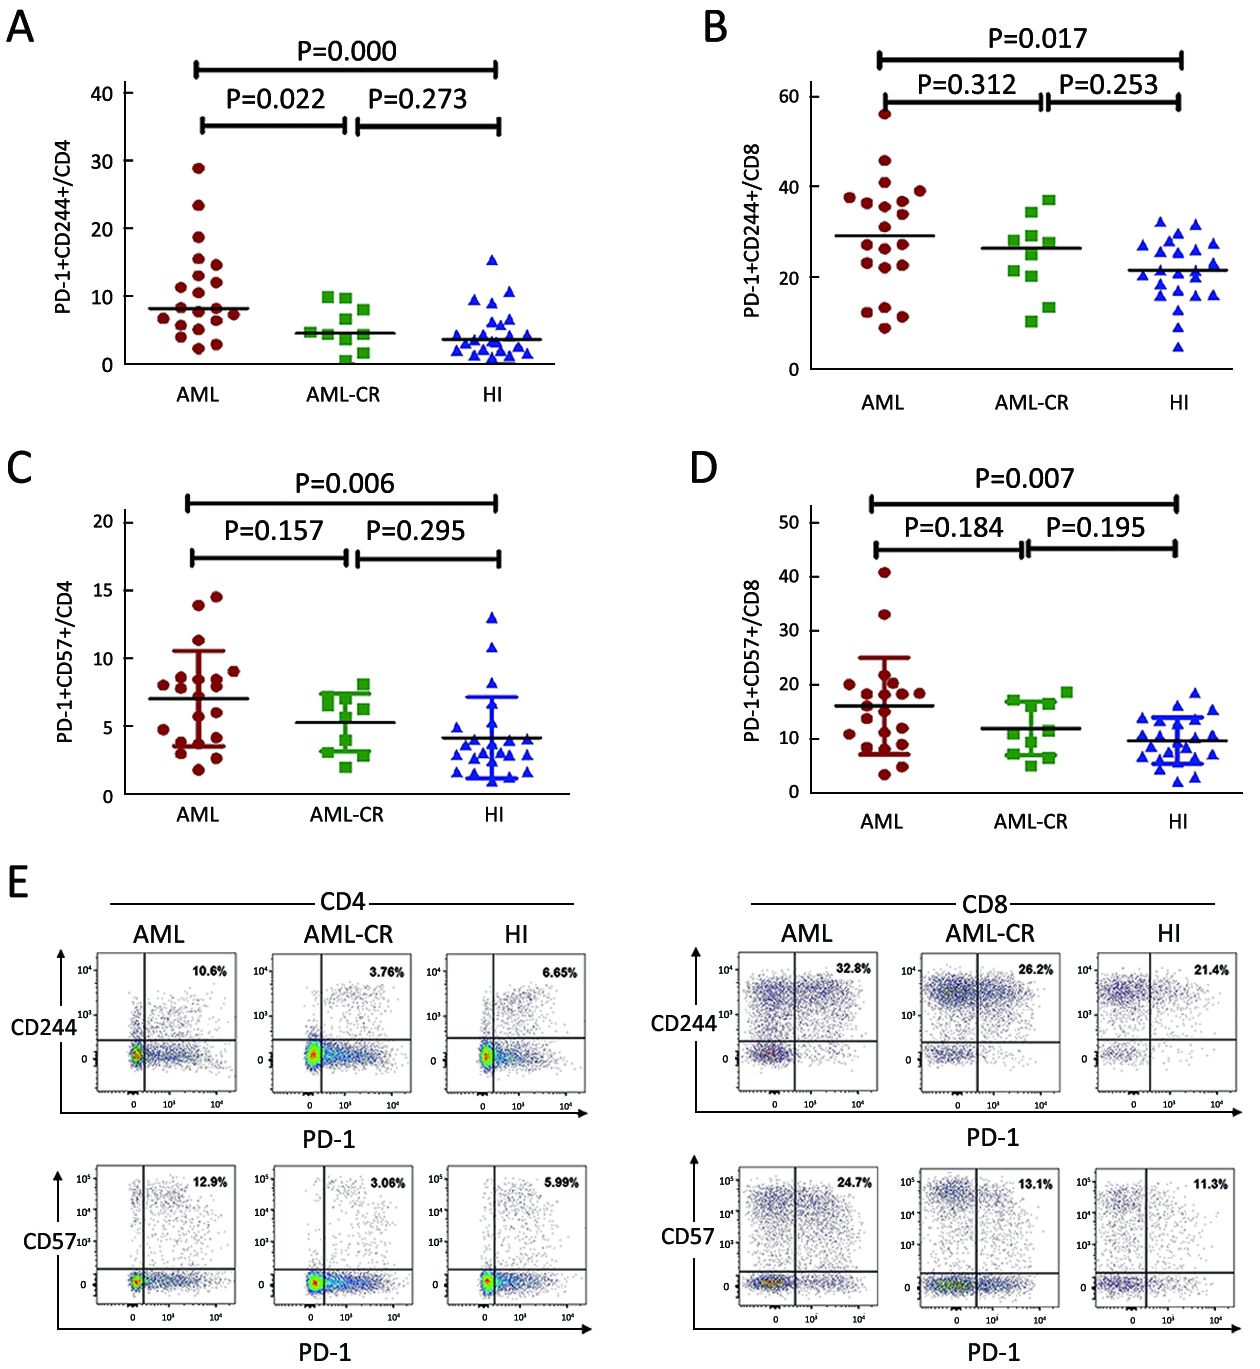
A higher percentage of PD-1+CD244+ and PD-1+CD57+ in CD4+ and CD8+ T cells in AML
To investigate the association between PD-1 and the T cell exhaustion status of T cells, we analyzed co-expression of PD-1 and CD244 or CD57 in CD4+ and CD8+ T cells. A strong upregulation of PD-1+CD244+ and PD-1+CD57+ cells was found for CD4+ and CD8+ T cells in the de novo AML group compared with the healthy control group (PD-1+CD244+/CD4: 8.25% vs. 3.62%, P=0.000; PD-1+CD57+/CD4: 7.02%±3.53% vs. 4.12%±3.01%, P=0.006; PD-1+CD244+/CD8: 29.30% vs. 21.60%, P=0.017; PD-1+CD57+/CD8: 16.21%±8.93% vs. 9.81%±4.30%, P=0.007). There was no significant difference between PD-1+CD244+ and PD-1+CD57+ cells in CD4+ and CD8+ cells in the AML-CR group compared with healthy individuals (5.35%±3.17% vs. 4.70%±3.56%, P=0.273; 5.25%±2.13% vs. 4.12%±3.01%, P=0.295; 24.82%±8.54% vs. 21.50%±7.07%, P=0.253; 12.06%±4.91% vs. 9.81%±4.30%, P=0.195). Interestingly, there was a significant difference between the PD-1+CD244+ populations for CD4+ cells fromde novo AML compared with AML-CR (10.63%±6.89% vs. 5.35%±3.17%, P=0.022), whereas for PD-1+CD244+/CD8, PD-1+CD57+ /CD4+ or PD-1+CD57+/CD8+ T cells, this was not observed (Figure 3).
Discussion
Increasing data have indicated that T cell immunosuppression in cancer patients is primarily mediated by T cell inhibitory receptors, a so-called immune checkpoint, which may be reversed by checkpoint inhibitors. Most of the immune checkpoint blockade studies have focused on solid tumors, and few clinical attempts have been reported for leukemia. Recently, PD-1/PDL-1 have been extensively investigated in leukemia, and clinical trials with PD-1 inhibitors for patients with hematological malignancies are ongoing with promising clinical responses (22), while the failure of PD-1 blockade in multiple myeloma (MM) was reported in a phase I study (23). Moreover, most studies have been performed using leukemia mouse models or in vitro analyses (24,25), and most have focused on lymphocytic malignancies such as CLL and diffuse large B-cell lymphoma (DLBCL) (26,27). Little is known about the characteristics of the PD-1 expression level and T cell exhaustion status of patients with de novo AML. In this study, we firstly analyzed the number of PD-1+ T cells in the CD3+, CD4+ and CD8+ T cell populations from patients with de novo AML. The most striking finding was an increased number of PD-1+ CD3 cells, and most of these PD-1+ cells were CD8+ cells, while the number of PD1+CD4+ cells was not increased in the AML group, which may be related to a dysfunction in the cytotoxicity of T cells in AML.
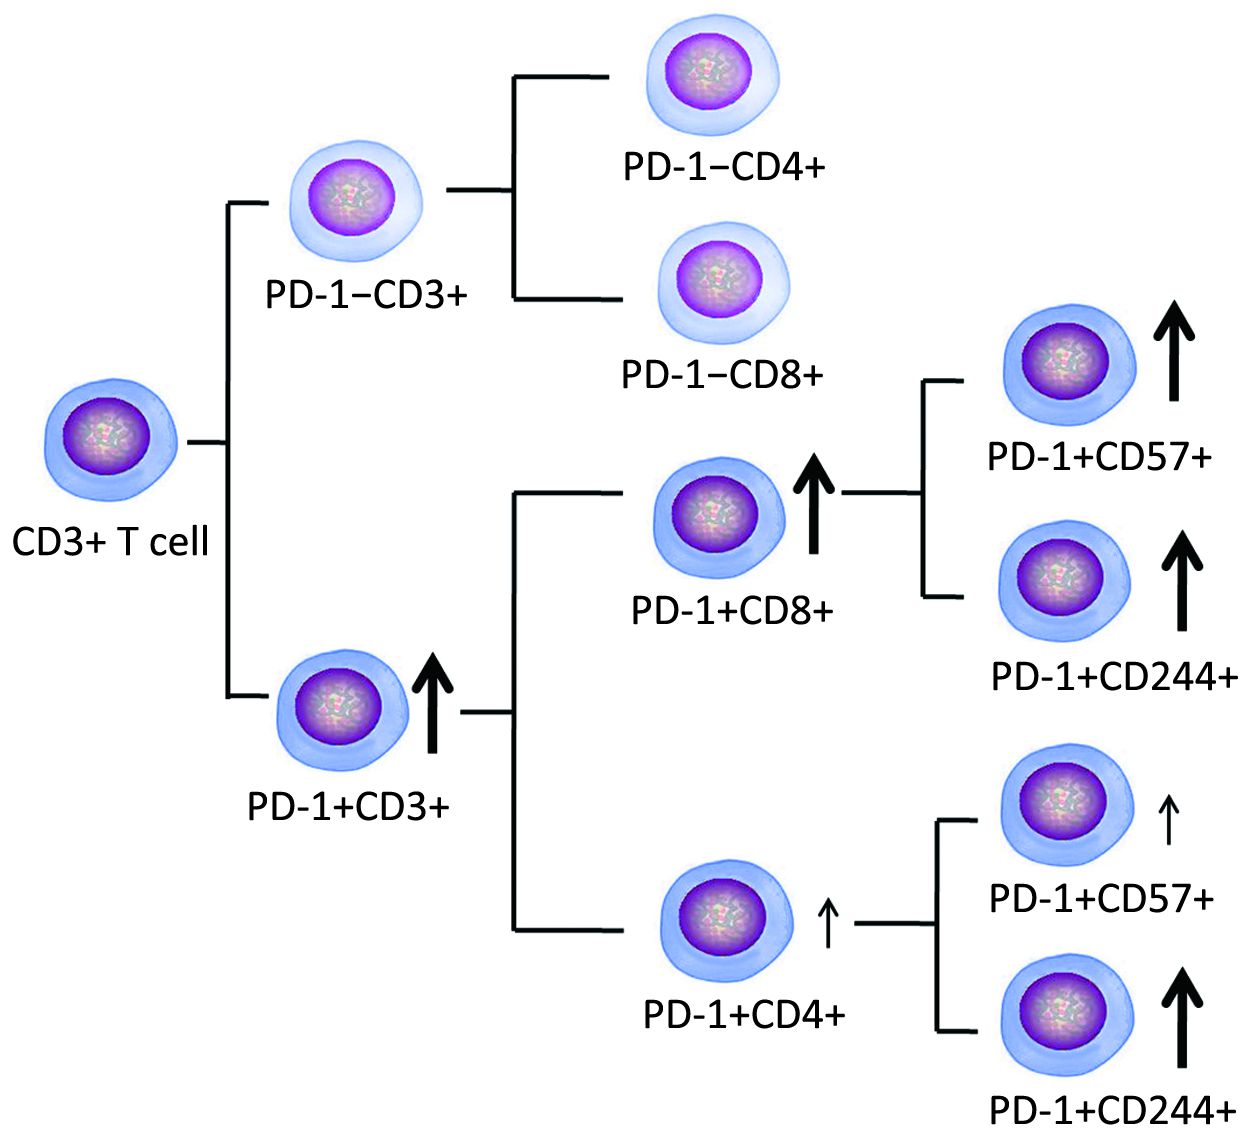
To evaluate whether these T cells displayed the exhausted phenotype, we examined the number of CD244+ and CD57+ T cells in patient blood. CD244 and CD57 are commonly used to evaluate T cell exhaustion and immunosenescence (28-31). The numbers of the CD244+CD4+, CD244+CD8, CD57+CD4+, and CD57+CD8+ T cells were significantly increased in the AML group. Therefore, we further analyzed co-expression of PD-1 and CD244 or CD57 on the CD4+ and CD8+ T cell subsets. There was a parallel increase in the number of all four T cell subsets. This result is different from an in vitro study that showed that T cells co-cultured with leukemia cells could generate only exhausted Th cells, which are defined by upregulation of the PD-1, cytotoxic T-lymphocyte antigen 4 (CTLA-4), lymphocyte activation gene 3 (LAG3) and Tim-3 inhibitory receptors (32). Overall, it may be summarized that exhausted T cells are increased in AML patients, and CD8+ T cells are mainly involved, while CD4+ T cells appear to have less impact (Figure 4). This result is consistent with the finding of CLL with increased T cell exhaustion (16,33), the finding further supports a study that reported that the exhausted T cell phenotype could be identified in AML mouse models (17). Moreover, we found that increased exhausted T cells, particularly CD8+ T cells, began at the time of diagnosis, and most of these cells could be decreased to a normal level at the time of AML in CR. No reports have demonstrated reversal of the exhausted T cell status in AML-CR. Recently, data from CML analysis have demonstrated that maximal restoration of immune responses by increased effector T cell cytolytic function and reduced PD-1+ T cells occur in CML with molecular remission, which is a similar observation as our results (34). Although there was no significant difference in the numbers of PD-1+CD244+, PD-1+CD57+ T cells between de novo AML and AML-CR groups in this study, the decreased tendency was observed in AML-CR group, further investigation will be performed in a large cohort samples to confirm the results. We found that the level of exhausted T cells at the time of diagnosis and in CR is relatively different for different patients with AML, which may be related to different statuses of T cell dysfunction, and whether it is associated with clinical outcome requires follow up. At a minimum, this phenotype may provide a biomarker for patients who are considering adding immune checkpoint blockade to achieve more effective therapy (21,35).
Conclusions
We characterized one of the major T cell defects, co-expression of PD-1, CD244, and CD57 exhausted T cells in patients with de novo AML, and found a particular influence of CD8+ T cells, suggesting that there may be a reason of poor anti-leukemia immune response in patients with AML. Moreover, heterogeneous alterations in the exhaustion status of different cases may provide information for selecting checkpoint blockade as a follow-up therapy in different cases. However, further investigation is needed to characterize alterations in multiple immune checkpoint proteins, such as CTLA-4, Tim-3, and LAG-3, to provide a global view of T cell immune suppression in different T cell subtypes in AML.
Acknowledgements
This study was supported by grants from the National Natural Science Foundation of China (No. 81570143 and 91642111), the Guangdong Provincial Basic Research Program (No. 2015B020227003), the Guangdong Provincial Applied Science and Technology Research & Development Program (No. 2016B020237006), the Guangzhou Science and Technology Project (No. 201510010211), the Fundamental Research Funds for the Central Universities (No. 21616108), and the Medical Scientific Research Foundation of Guangdong Province, China (No. A2016045).
Footnote
Conflicts of Interest: The authors have no conflicts of interest to declare.
References
- Chen S, Zha X, Shi L, et al. Upregulated TCRζ improves cytokine secretion in T cells from patients with AML. J Hematol Oncol 2015;8:72. [PubMed] DOI:10.1186/s13045-015-0170-0
- Greiner J, Bullinger L, Guinn BA, et al. Leukemia-associated antigens are critical for the proliferation of acute myeloid leukemia cells. Clin Cancer Res 2008;14:7161–6. [PubMed] DOI:10.1158/1078-0432.CCR-08-1102
- Müller-Schmah C, Solari L, Weis R, et al. Immune response as a possible mechanism of long-lasting disease control in spontaneous remission of MLL/AF9-positive acute myeloid leukemia. Ann Hematol 2012;91:27–32. [PubMed] DOI:10.1007/s00277-011-1332-y
- Isidori A, Salvestrini V, Ciciarello M, et al. The role of the immunosuppressive microenvironment in acute myeloid leukemia development and treatment. Expert Rev Hematol 2014;7:807–18. [PubMed] DOI:10.1586/17474086.2014.958464
- Li Y. Alterations in the expression pattern of TCR zeta chain in T cells from patients with hematological diseases. Hematology 2008;13:267–75. [PubMed] DOI:10.1179/102453308X343482
- Shi L, Chen S, Yang L, et al. The role of PD-1 and PD-L1 in T-cell immune suppression in patients with hematological malignancies. J Hematol Oncol 2013;6:74. [PubMed] DOI:10.1186/1756-8722-6-74
- Li Y. T-cell immune suppression in patients with hematologic malignancies: clinical implications. Int J Hematol Oncol 2014;3:289–97. DOI:10.2217/ijh.14.23>
- Sun YX, Kong HL, Liu CF, et al. The imbalanced profile and clinical significance of T helper associated cytokines in bone marrow microenvironment of the patients with acute myeloid leukemia. Hum Immunol 2014;75:113–8. [PubMed] DOI:10.1016/j.humimm.2013.11.014
- Xu L, Lu Y, Lai J, et al. Characteristics of the TCR Vβ repertoire in imatinib-resistant chronic myeloid leukemia patients with ABL mutations. Sci China Life Sci 2015;58:1276–81. [PubMed] DOI:10.1007/s11427-015-4930-4
- Jin Z, Luo Q, Lu S, et al. Oligoclonal expansion of TCR Vδ T cells may be a potential immune biomarker for clinical outcome of acute myeloid leukemia. J Hematol Oncol 2016;9:126. [PubMed] DOI:10.1186/s13045-016-0353-3
- Sasine JP, Schiller GJ. Emerging strategies for high-risk and relapsed/refractory acute myeloid leukemia: novel agents and approaches currently in clinical trials. Blood Rev 2015;29:1–9. [PubMed] DOI:10.1016/j.blre.2014.07.002
- McClanahan F, Riches JC, Miller S, et al. Mechanisms of PD-L1/PD-1-mediated CD8 T-cell dysfunction in the context of aging-related immune defects in the Eμ-TCL1 CLL mouse model. Blood 2015;126:212–21. [PubMed] DOI:10.1182/blood-2015-02-626754
- Köhnke T, Krupka C, Tischer J, et al. Increase of PD-L1 expressing B-precursor ALL cells in a patient resistant to the CD19/CD3-bispecific T cell engager antibody blinatumomab. J Hematol Oncol 2015;8:111. [PubMed] DOI:10.1186/s13045-015-0213-6
- Zheng Z, Bu Z, Liu X, et al. Level of circulating PD-L1 expression in patients with advanced gastric cancer and its clinical implications. Chin J Cancer Res 2014;26:104–11. [PubMed] DOI:10.3978/j.issn.1000-9604.2014.02.08
- Kong Y, Zhang J, Claxton DF, et al. PD-1(hi)TIM-3(+) T cells associate with and predict leukemia relapse in AML patients post allogeneic stem cell transplantation. Blood Cancer J 2015;5:e330. [PubMed] DOI:10.1038/bcj.2015.58
- Gassner FJ, Zaborsky N, Catakovic K, et al. Chronic lymphocytic leukaemia induces an exhausted T cell phenotype in the TCL1 transgenic mouse model. Br J Haematol 2015;170:515–22. [PubMed] DOI:10.1111/bjh.13467
- Zhou Q, Munger ME, Veenstra RG, et al. Coexpression of Tim-3 and PD-1 identifies a CD8(+) T-cell exhaustion phenotype in mice with disseminated acute myelogenous leukemia. Blood 2011;117:4501–10. [PubMed] DOI:10.1182/blood-2010-10-310425
- Schnorfeil FM, Lichtenegger FS, Emmerig K, et al. T cells are functionally not impaired in AML: increased PD-1 expression is only seen at time of relapse and correlates with a shift towards the memory T cell compartment. J Hematol Oncol 2015;8:93. [PubMed] DOI:10.1186/s13045-015-0189-2
- Schmohl JU, Nuebling T, Wild J, et al. Expression of RANK-L and in part of PD-1 on blasts in patients with acute myeloid leukemia correlates with prognosis. Eur J Haematol 2016;97:517–27. [PubMed] DOI:10.1111/ejh.12762
- Shi L, Chen S, Zha X, et al. Enhancement of the TCRζ expression, polyclonal expansion, and activation of T cells from patients with acute myeloid leukemia after IL-2, IL-7, and IL-12 induction. DNA Cell Biol 2015;34:481–8. [PubMed] DOI:10.1089/dna.2015.2810
- Yi Y, Han J, Zhao L, et al. Immune responses of dendritic cells combined with tumor-derived autophagosome vaccine on hepatocellular carcinoma. Chin J Cancer Res 2015;27:597–603. [PubMed] DOI:10.3978/j.issn.1000-9604.2015.12.07
- Sehgal A, Whiteside TL, Boyiadzis M. Programmed death-1 checkpoint blockade in acute myeloid leukemia. Expert Opin Biol Ther 2015;15:1191–203. [PubMed] DOI:10.1517/14712598.2015.1051028
- Suen H, Brown R, Yang S, et al. The failure of immune checkpoint blockade in multiple myeloma with PD-1 inhibitors in a phase 1 study. Leukemia 2015;29:1621–2. [PubMed] DOI:10.1038/leu.2015.104
- Krupka C, Kufer P, Kischel R, et al. Blockade of the PD-1/PD-L1 axis augments lysis of AML cells by the CD33/CD3 BiTE antibody construct AMG 330: reversing a T-cell-induced immune escape mechanism. Leukemia 2016;30:484–91. [PubMed] DOI:10.1038/leu.2015.214
- Qin L, Dominguez D, Chen S, et al. Exogenous IL-33 overcomes T cell tolerance in murine acute myeloid leukemia. Oncotarget 2016;7:61069–80. [PubMed] DOI:10.18632/oncotarget.11179
- Wu J, Xu X, Lee EJ, et al. Phenotypic alteration of CD8+ T cells in chronic lymphocytic leukemia is associated with epigenetic reprogramming. Oncotarget 2016;7:40558–70. [PubMed] DOI:10.18632/oncotarget.9941
- Dong L, Lv H, Li W, et al. Co-expression of PD-L1 and p-AKT is associated with poor prognosis in diffuse large B-cell lymphoma via PD-1/PD-L1 axis activating intracellular AKT/mTOR pathway in tumor cells. Oncotarget 2016;7:33350–62. [PubMed] DOI:10.18632/oncotarget.9061
- Yuan D. Comment on " Molecular basis of the dual functions of 2B4 (CD244)”. J Immunol 2008;181:5181. [PubMed]
- Van den Hove LE, Vandenberghe P, Van Gool SW, et al. Peripheral blood lymphocyte subset shifts in patients with untreated hematological tumors: evidence for systemic activation of the T cell compartment. Leuk Res 1998;22:175–84. [PubMed]
- Atayar C, Poppema S, Visser L, et al. Cytokine gene expression profile distinguishes CD4+/CD57+ T cells of the nodular lymphocyte predominance type of Hodgkin’s lymphoma from their tonsillar counterparts. J Pathol 2006;208:423–30. [PubMed] DOI:10.1002/path.1894
- Serrano D, Monteiro J, Allen SL, et al. Clonal expansion within the CD4+CD57+ and CD8+CD57+ T cell subsets in chronic lymphocytic leukemia. J Immunol 1997;158:1482–9. [PubMed]
- Ozkazanc D, Yoyen-Ermis D, Tavukcuoglu E, et al. Functional exhaustion of CD4+ T cells induced by co-stimulatory signals from myeloid leukemia cells. Immunology 2016;149:460–71. [PubMed] DOI:10.1111/imm.12665
- Novák M, Procházka V, Turcsányi P, et al. Numbers of CD8+PD-1+ and CD4+PD-1+ cells in peripheral blood of patients with chronic lymphocytic leukemia are independent of binet stage and are significantly higher compared to healthy volunteers. Acta Haematol 2015;134:208–14. [PubMed] DOI:10.1159/000381468
- Hughes A, Clarson J, Tang C, et al. CML patients with deep molecular responses to TKI have restored immune effectors, decreased PD-1 and immune suppressors. Blood 2017;129:1166–76. [PubMed] DOI:10.1182/blood-2016-10-745992
- Choi DC, Tremblay D, Iancu-Rubin C, et al. Programmed cell death-1 pathway inhibition in myeloid malignancies: implications for myeloproliferative neoplasms. Ann Hematol 2017;96:919–27. [PubMed] DOI:10.1007/s00277-016-2915-4