
Prognostic value of pre- and post-transplantation 18F-fluorodeoxyglucose positron emission tomography results in non-Hodgkin lymphoma patients receiving autologous stem cell transplantation
Introduction
Non-Hodgkin lymphoma (NHL) is a group of heterogeneous lymphoproliferative disorders originating in T or B lymphocytes or natural killer cells. With the introduction of rituximab, the outcome of B cell lymphomas has been improved significantly (1). However, about 40% of patients with diffuse large B cell lymphoma (DLBCL) relapse after or are refractory to first-line treatment (1,2). A large proportion of peripheral T-cell lymphoma (PTCL) and natural killer/T-cell lymphoma (NKTCL) patients have a poor prognosis with frequent relapse and unfavorable outcome (3,4). Numerous studies have demonstrated the role of high-dose chemotherapy (HDC) followed by autologous stem cell transplantation (ASCT) in the upfront or relapsed/refractory setting in NHL (5-9). 18F-fluorodeoxyglucose (FDG) positron emission tomography (PET)/computed tomography (CT) is a type of metabolic imaging, which has been widely used for staging, response evaluation, and prognosis prediction (10-16). However, the predictive value of 18F-FDG PET/CT in patients with NHL who are receiving HDC-ASCT remains a matter of debate. This retrospective study evaluated the role of 18F-FDG PET/CT in NHL patients before and after ASCT.
Materials and methods
Patient selection
The study was approved by the Institutional Review Board at Peking University Cancer Hospital, Beijing, China. Between March 2010 and July 2016, NHL patients who received HDC-ASCT at Peking University Cancer Hospital were eligible for analysis. In total, 135 NHL patients were treated with HDC-ASCT. Eighty-six patients who underwent PET imaging before or after ASCT were initially identified. Three patients with PET scan >3 months before or after ASCT were excluded. Four patients who underwent radiation therapy after ASCT were excluded. Therefore, data from 79 patients were retrospectively collected and analyzed.
Staging
Before frontline or salvage treatment, disease stage was established according to the Ann Arbor staging system by physical examination, CT or PET scan, and bone marrow biopsy (17). Eastern Cooperative Oncology Group performance status (ECOG PS) was assessed, and serum lactate dehydrogenase (LDH) level was also tested. Scores for secondary age-adjusted International Prognostic Indicator (sAA-IPI) were calculated (18,19). One point is given for each of the following high-risk factors: elevated LDH, Ann Arbor stage III/IV and ECOG PS ≥2. The presence of no risk factor was considered low risk; one factor intermediate risk, and two or three factors high risk. Bulky disease was defined as the presence of a mediastinal mass more than one-third of the transthoracic diameter or an extranodal mass ≥7.5 cm. PET scan was performed before or after HDC-ASCT.
PET scan and response evaluation and follow-up protocol
18F-FDG PET scan (Gemini TF 16 PET/CT, Philips, Netherlands) was performed according to standard procedures. PET acquisition was performed in 6-h fasting patients after intravenous injection of 0.1 mCi/kg 18F-FDG. Non-contrast-enhanced CT was performed using the following settings: modulated 100 mAs; 120 kV; slice thickness, 3 mm, and covered from the base of the skull to the upper thigh. PET data were reconstructed iteratively with attenuation correction based on CT data and reoriented in axial, sagittal and coronal slices.
Responses were assessed according to the Lugano criteria (20). Results of PET scanning were retrieved from medical records. Deauville criteria (5-point scale) were used to interpret PET scans. PET results with score 1, 2 or 3 were defined as negative. PET results with score 4 or 5 were defined as positive.
Patients were reassessed after ASCT at a minimum of every 3 months for 2 years, then every 6 months for 3 years, and then annually for at least 5 years.
Statistical analysis
Data were collected using IBM SPSS Statistics for Windows (Version 22.0; IBM Corp., New York, USA). Progression-free survival (PFS) was measured from the day of stem cell infusion until the time of disease relapse or progression, or disease-related death, with censoring at the time of death unrelated to lymphoma or at last follow-up. Overall survival (OS) was measured from day of stem cell infusion until the date of death, with censoring at the time of last follow-up. Univariate and multivariate survival analyses were performed using Cox regression with the backwards stepwise model. The predictive value of PET result was estimated by comparing the area under the receiver operating characteristic (ROC) curve. DeLong test was used to compare the area under curve (AUC) from each of the models, which were analyzed by MedCalc Statistical Software (version 11.4.2.0; MedCalc, Mariakerke, Belgium). All probability values were two-tailed. P<0.05 was considered statistically significant.
Results
Fifty-one male and 28 female patients with NHL who underwent 18F-FDG PET scan before and after HDC-ASCT were included. The mean age was 36 (range, 11–61) years. Forty-five patients received upfront ASCT and 20 received ASCT after salvage therapy in the alive group. Statistical difference was observed between alive and death groups (P=0.004). Similar result was noted between progression and non-progression groups (P<0.001). There were significantly more patients with stage I–II in the alive group than that in the death group (P=0.038). The difference between progression and non-progression groups was also significant (P=0.012). No differences were observed among the 4 groups (alive groupvs. death group, non-progression group vs. progression group) regarding other baseline factors. All patients were staged at diagnosis or before salvage therapy according to the Ann Arbor clinical stage. sAA-IPI was calculated. The patient characteristics are shown in Table 1.
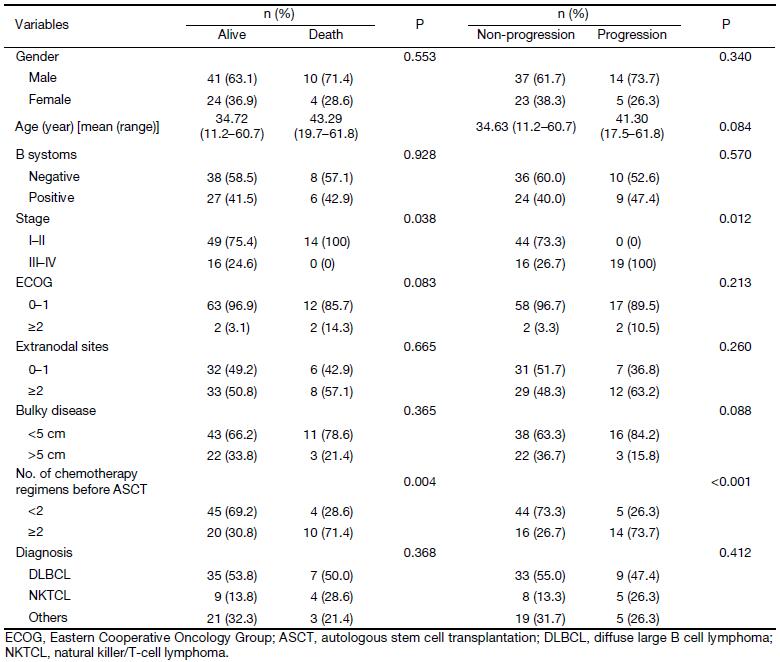
Full table
Univariate analysis of PFS and OS
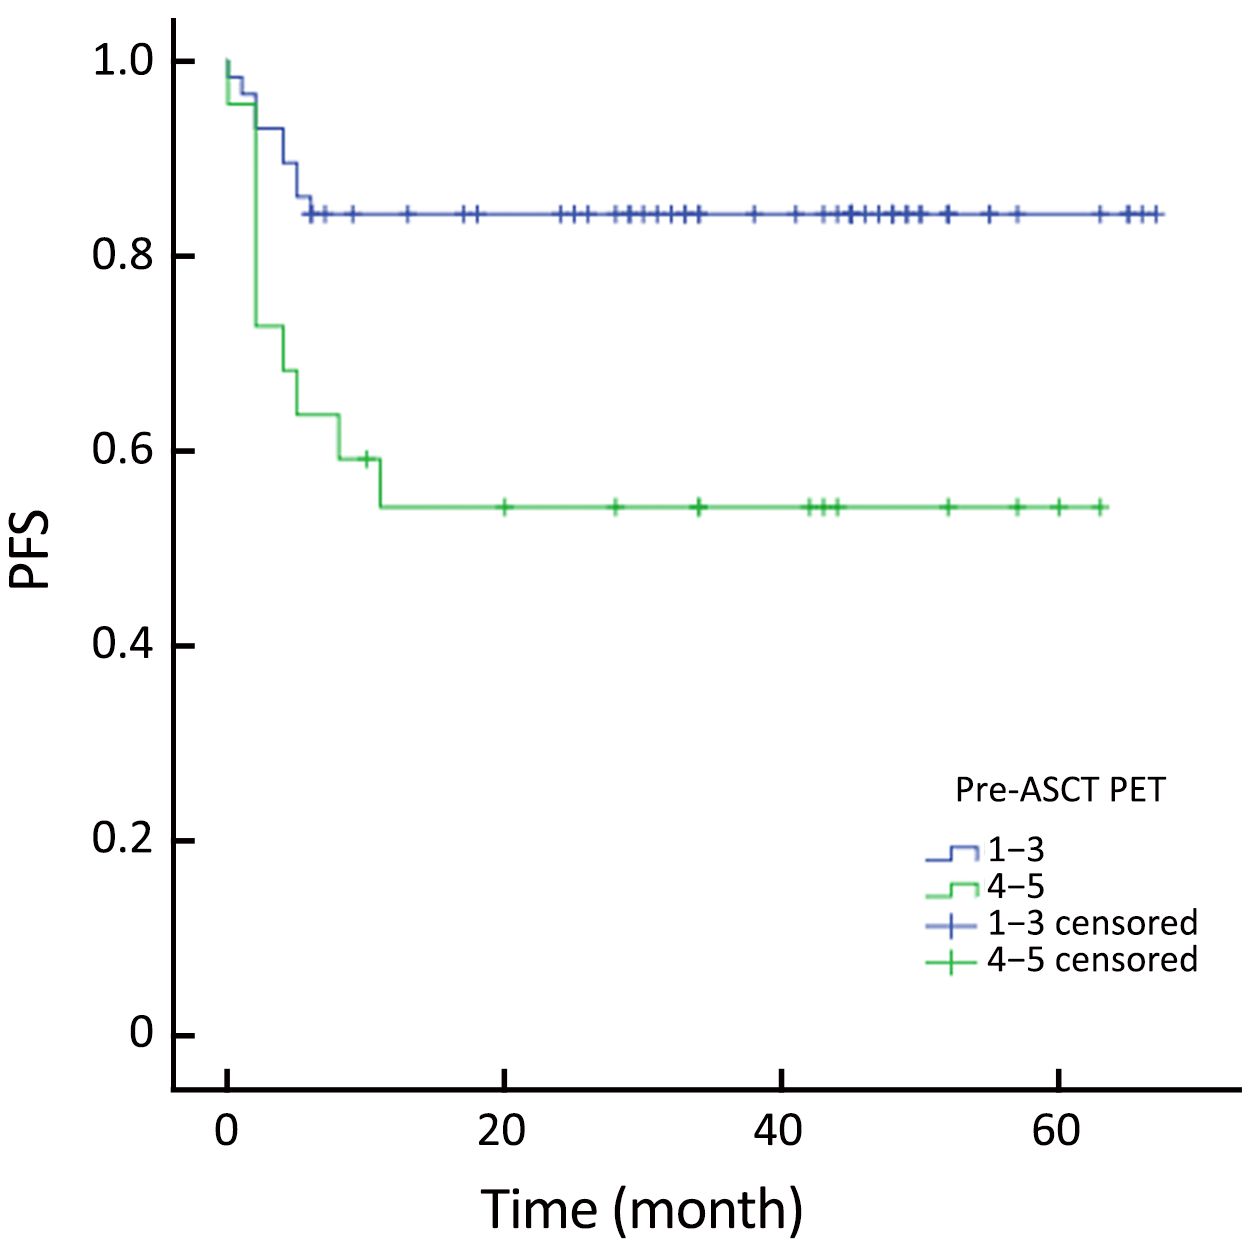
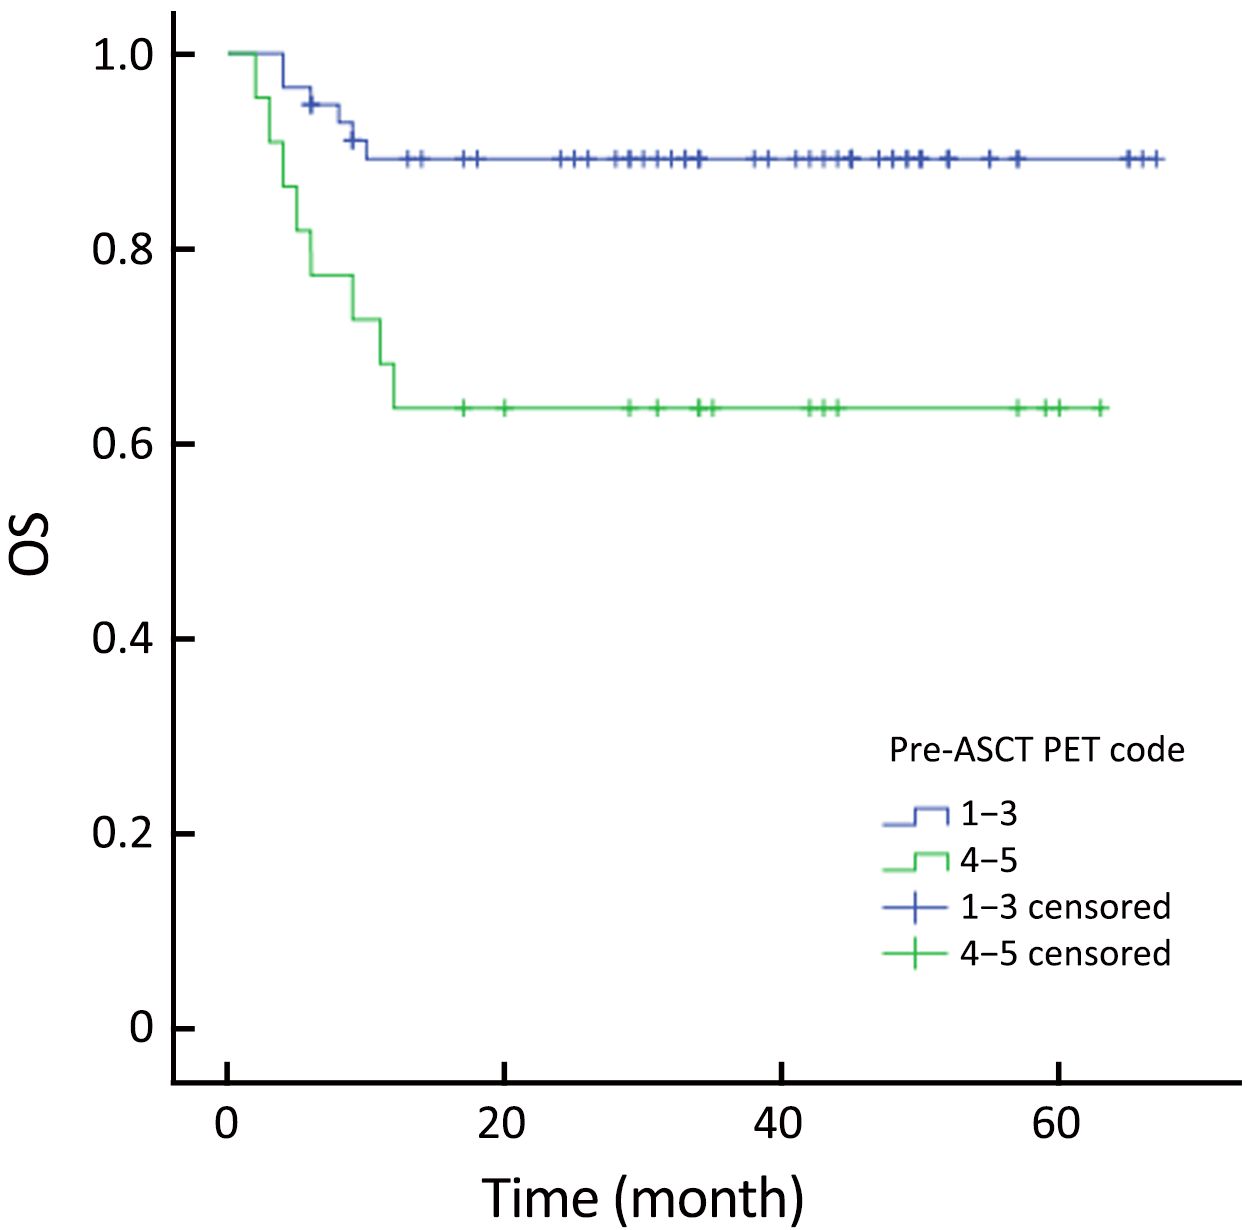
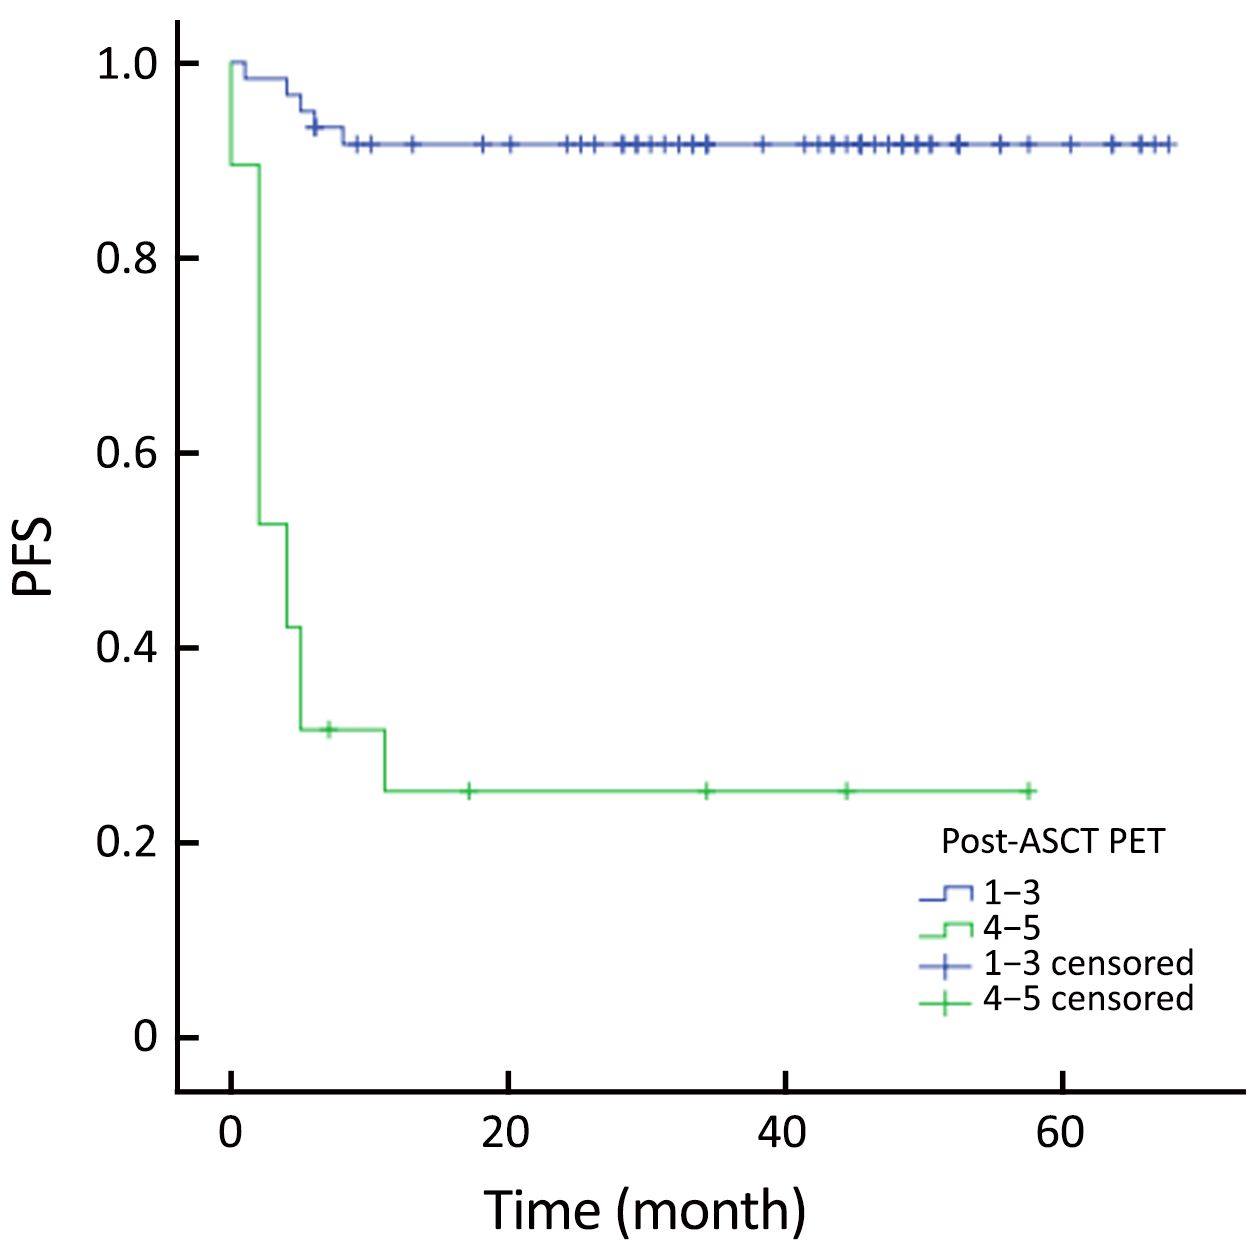
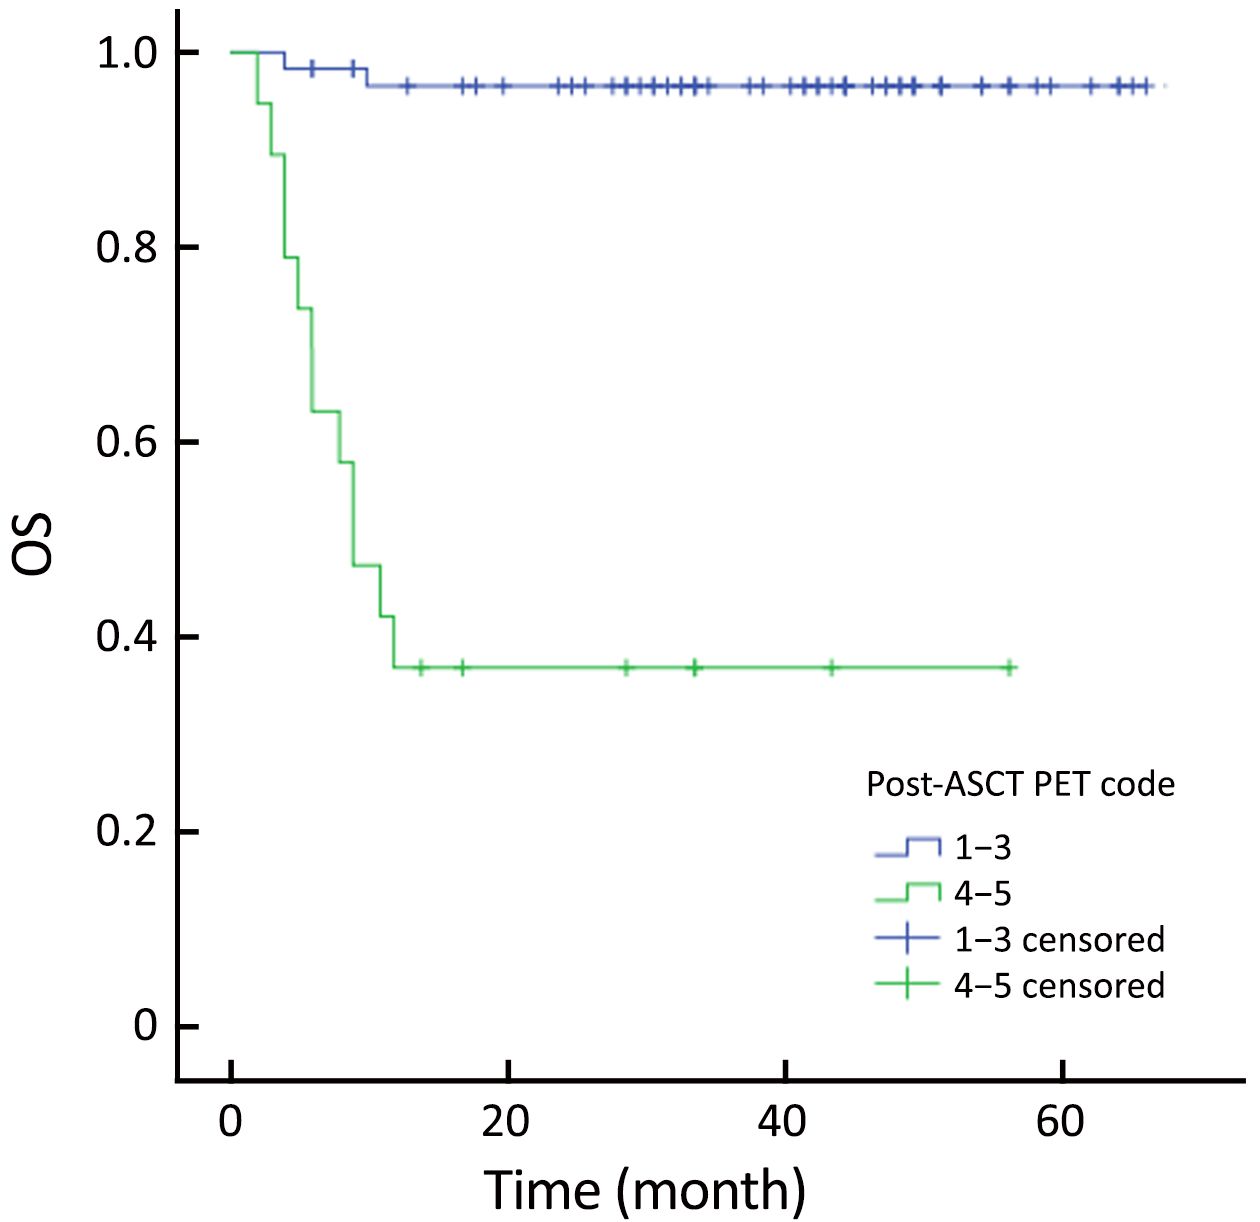
The actuarial 3-year PFS rate was 84.2% for pre-ASCT PET-negative patients compared with 54.2% for pre-ASCT PET-positive patients (P=0.005; log-rank test, 7.828) (Figure 1). The actuarial 3-year OS rates for pre-ASCT PET-negative and positive patients were 89.2% and 63.6%, respectively (P=0.006; log-rank test, 7.459) (Figure 2). Similarly, the actuarial 3-year PFS rate for post-ASCT PET-negative patients was superior to that of patients with positive post-ASCT PET result (91.6% vs. 25.3%, P<0.001; log-rank test, 44.314) (Figure 3). The actuarial 3-year OS rate for post-ASCT PET-negative patients was 96.5% vs. 36.8% for the PET-positive group (P=0.006; log-rank test, 41.879) (Figure 4).
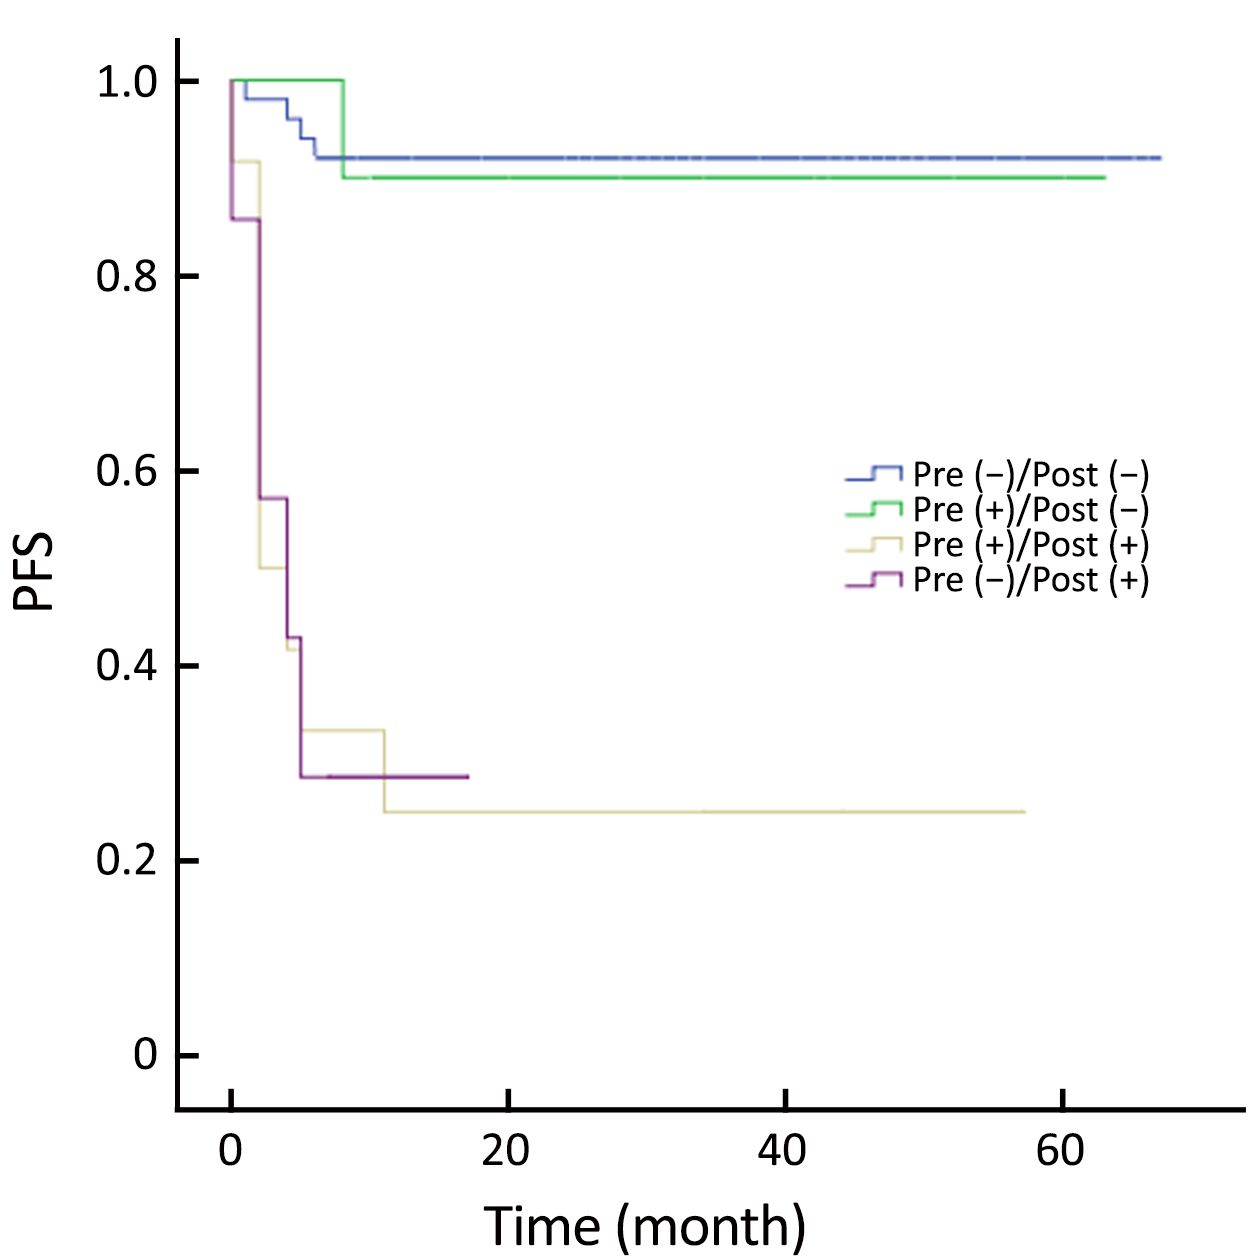
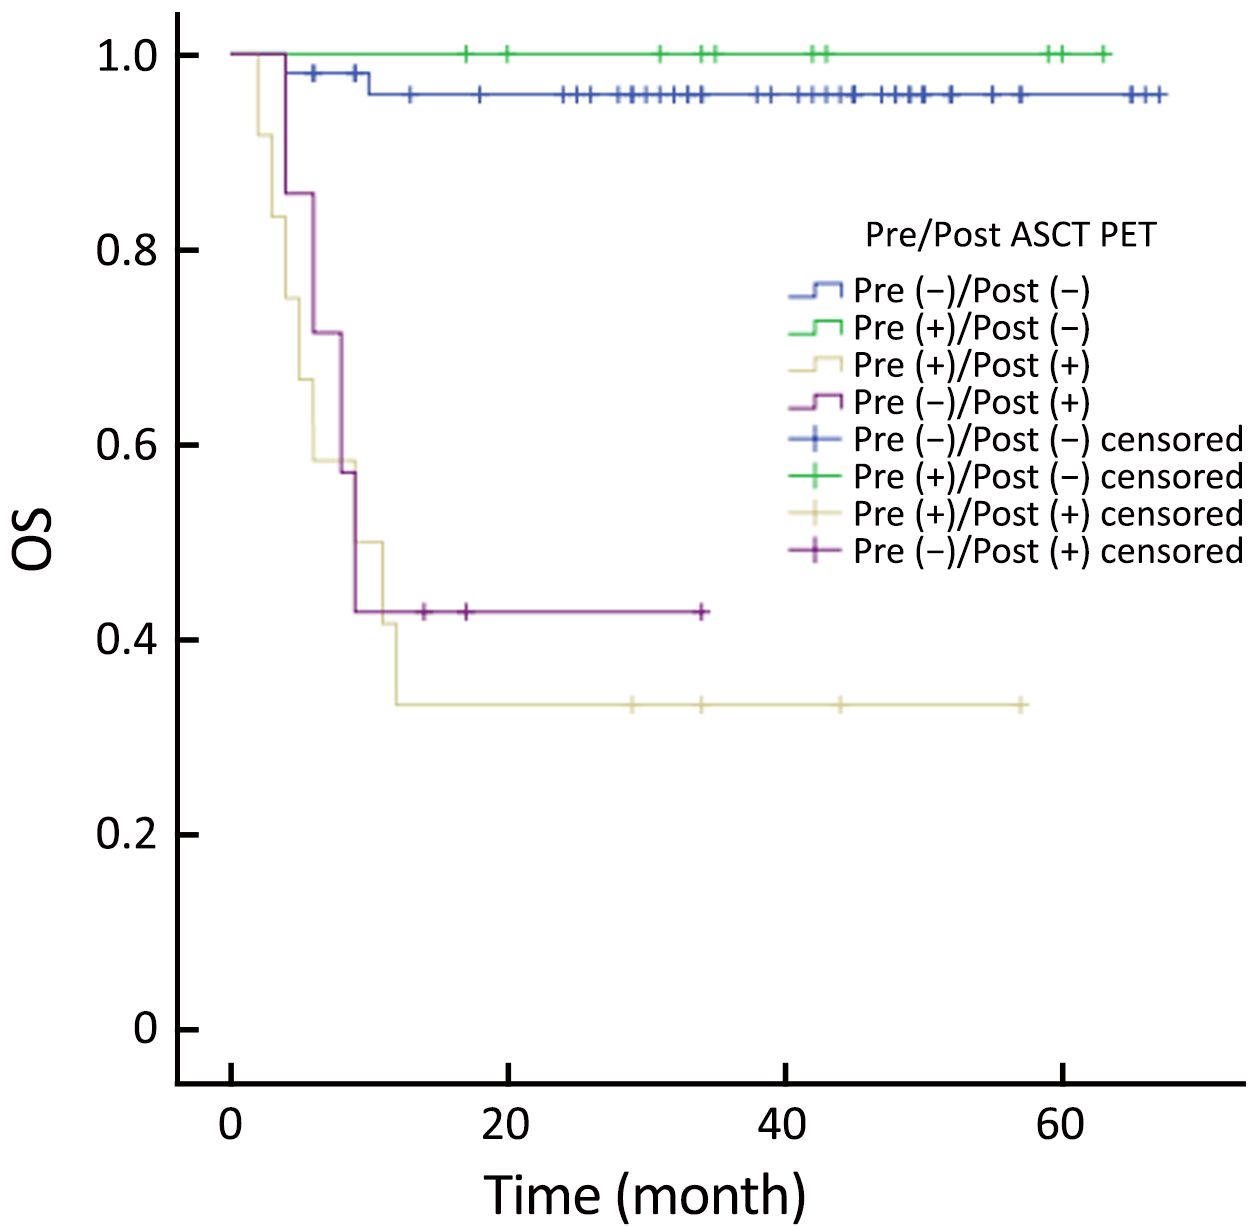
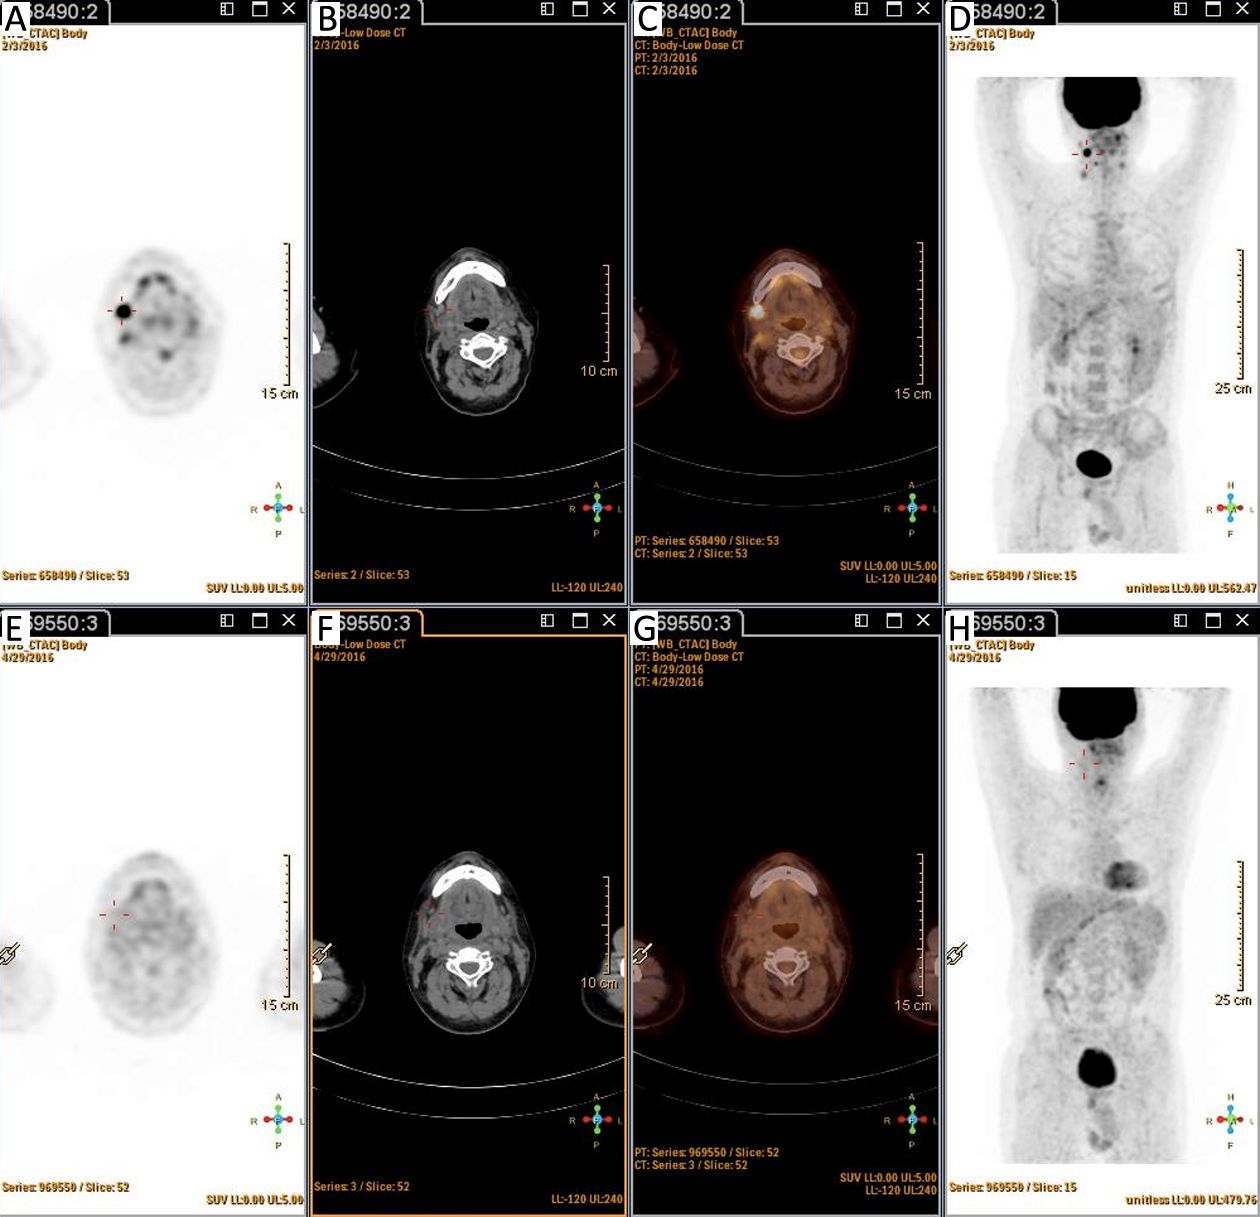
Patients were categorized into four groups according to the PET status before and after ASCT: those who were negative before and after (–/–; n=50); positive before and negative after (+/–; n=10); positive before and after (+/+; n=12); and negative before and positive after (–/+, n=7). Patients with PET (+/–) had similar outcomes to those with PET (–/–) (Figure 5, 6). PET imaging of one patient in the PET (+/–) group is shown in Figure 7.
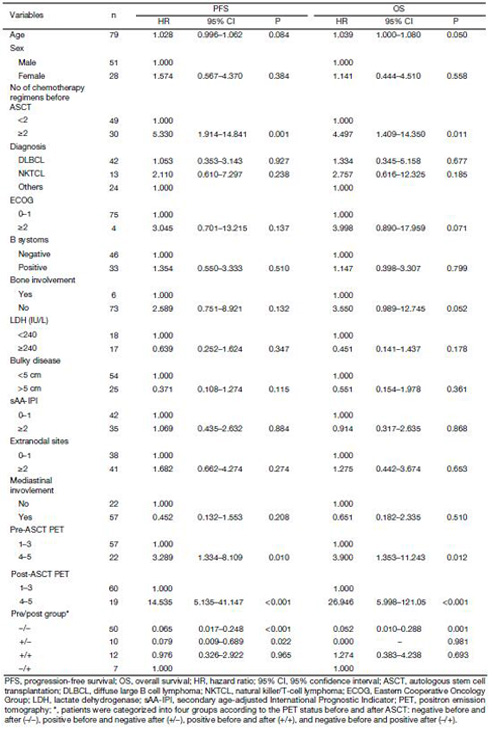
Number of chemotherapy regimens before ASCT was a significant prognostic factor for PFS and OS according to univariate analysis (Table 2). Patients receiving upfront ASCT had better outcomes than patients with relapsed/refractory diseases (PFS, P=0.001; OS, P=0.011).
Full table
Multivariate analysis of PFS and OS
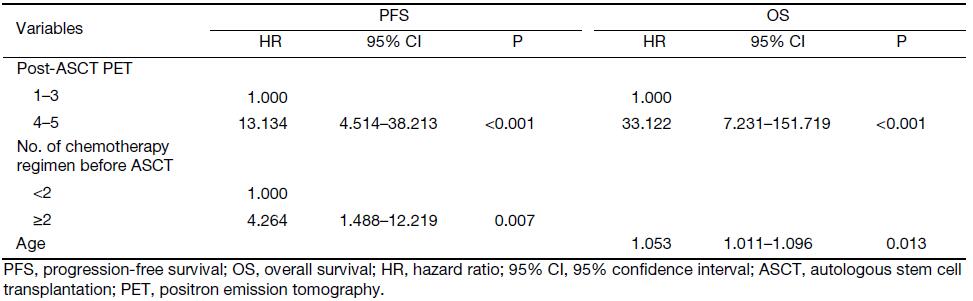
Multivariate analysis addressed the factors that were significantly related to PFS or OS in univariate analysis (Table 3). Pre-ASCT PET result was not analyzed in multivariate setting. There was a significant association of PFS [P<0.001; hazard ratio (HR), 13.134] and OS (P<0.001; HR, 33.122) with post-ASCT PET result. More importantly, patients with negative post-ASCT PET result had better PFS and OS rates compared with patients with positive post-ASCT PET result, regardless of the pre-ASCT PET status (Figure 5, 6). Number of chemotherapy regimens before ASCT was only a significant prognostic factor for PFS, and age was correlated with OS in the multivariate analysis.
Full table
ROC analysis of the predictive value of PET scan
Although pre- and post-ASCT PET results were risk factors for outcome prediction in the univariate analysis, pre-ASCT PET result did not provide independent prognostic information in the multivariate model. ROC analysis was done to assess the prognostic value of pre- and post-ASCT PET result.
In terms of PFS, pre-ASCT PET had an AUC of 0.710 [95% confidence interval (95% CI): 0.597–0.806] and post-ASCT PET an AUC of 0.785 (95% CI: 0.678–0.870). The best cut-off value for pre-ASCT PET was Deauville criteria score >2, with a sensitivity of 78.9% (95% CI: 29.8%–91.2%) and a specificity of 58.3% (95% CI: 48.3%–75.3%). The best cut-off value for post-ASCT PET was Deauville criteria score >3, with a sensitivity of 73.7% (95% CI: 41.8%–96.5%) and a specificity of 91.7% (95% CI: 77.2%–98.4%). We also calculated AUC of pre-ASCT PET and post-ASCT PET related to OS, which was 0.741 (95% CI: 0.630–0.833) and 0.869 (95% CI: 0.775–0.935), respectively. Once again, Deauville criteria score >2 was identified as the best cut-off value for pre-ASCT PET and that greater than 3 for post-ASCT PET. The sensitivity for pre- and post-ASCT PET was the same as 85.7% (95% CI: 42.1%–99.6%). The specificity was 56.9% (95% CI: 46.7%–76.4%) and 89.2% (95% CI: 74.6%–97.0%) for pre-ASCT PET and post-ASCT PET, respectively.
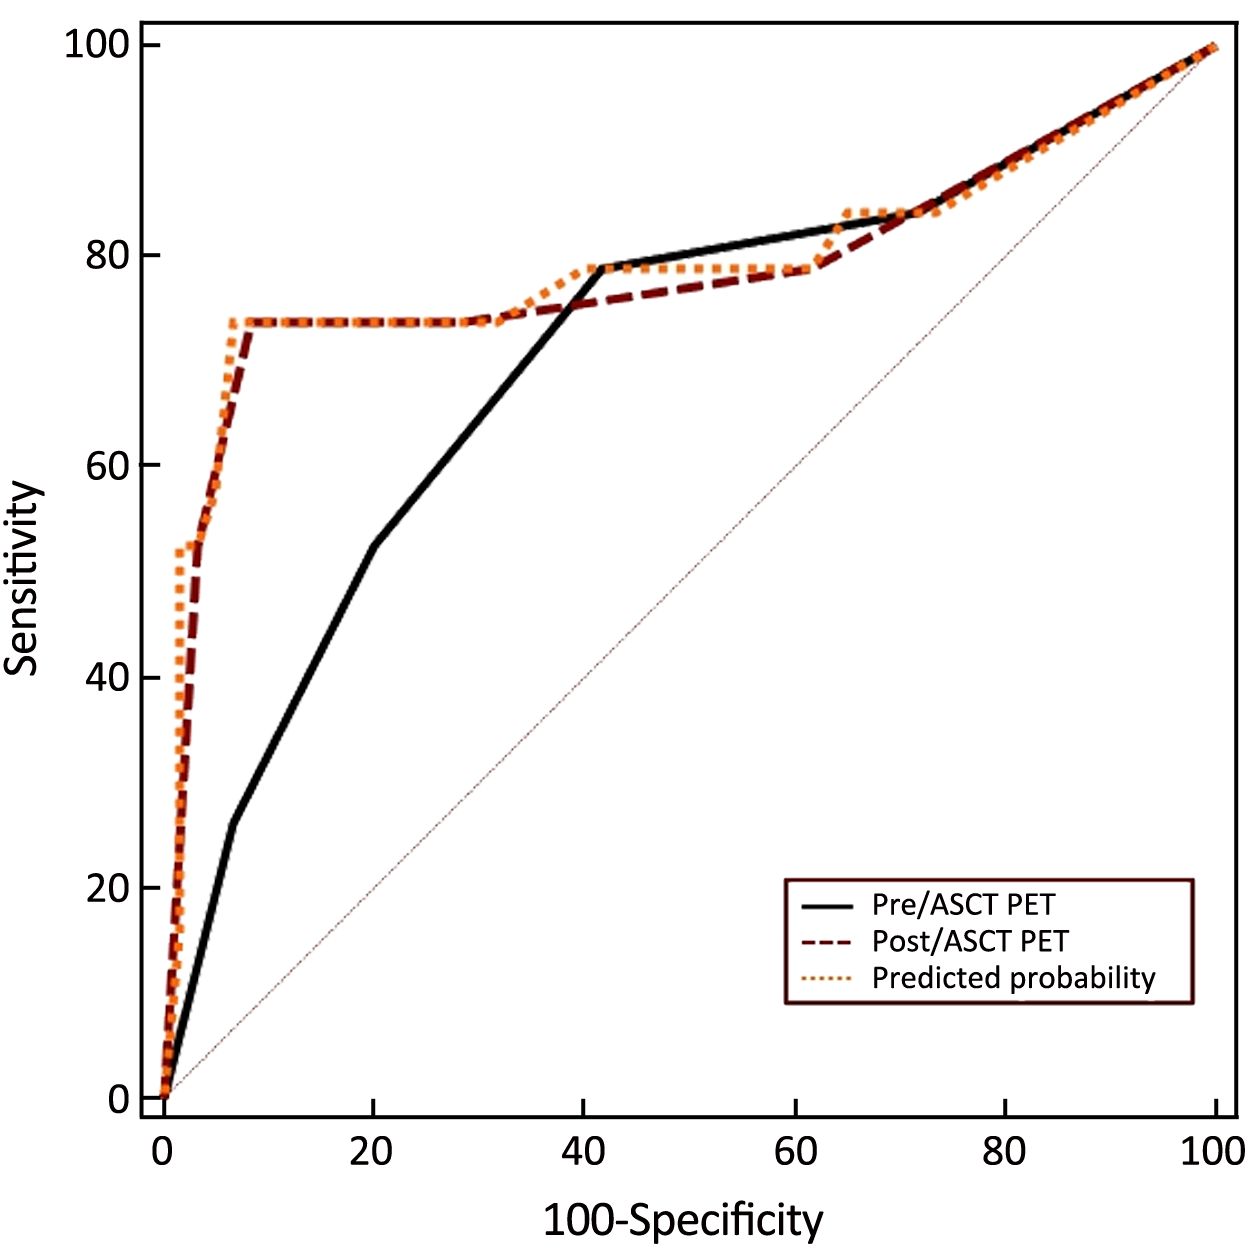
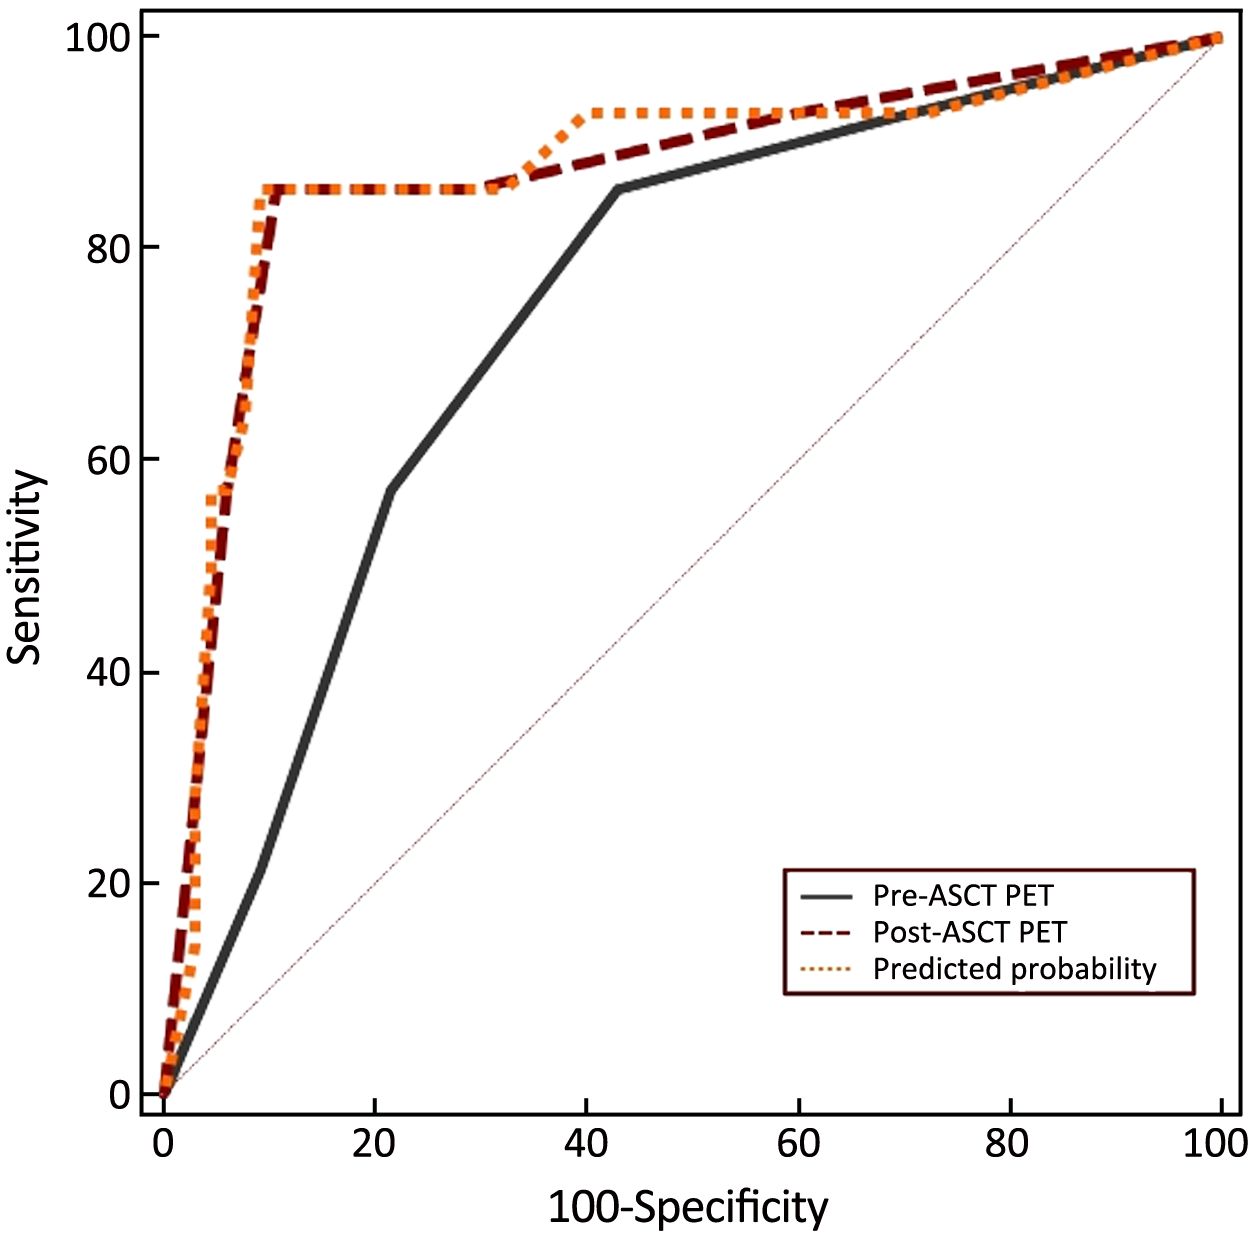
The combined value of pre- and post-ASCT PET result was assessed in the ROC curve analysis. For pre-ASCT PET alone, the AUC related to PFS was 0.710 (95% CI: 0.597–0.806). When post-ASCT PET was added to pre-ASCT PET, the AUC was 0.792 (95% CI: 0.686–0.875, P=0.147) (Figure 8). In terms of OS, the AUC of pre-ASCT PET was 0.741 (95% CI: 0.630–0.833). It was increased to 0.871 (95% CI: 0.777–0.936, P=0.011) when combining pre- with post-ASCT PET (Figure 9). These results revealed that the predictive value of adding post-ASCT PET to pre-ASCT PET was superior to that of pre-ASCT PET alone in predicting outcomes.
Discussion
In univariate analysis for PFS and OS, pre-ASCT PET result was identified as a significant prognostic factor, with PFS and OS rates of 84.2% and 89.2%, respectively, for PET-negative patients compared with 54.2% and 63.6%, respectively, for PET-positive patients. These results are in line with data from the literature. The prognostic value of pre-ASCT PET result has been addressed by a meta-analysis in which various types of lymphomas (Hodgkin’s lymphoma, B cell or T cell non-Hodgkin’s lymphoma) were included (21). A recent study by Sauter et al. assessed the predictive value of pre-ASCT PET result for DLBCL in a transplantation setting. In that analysis, 129 patients with relapsed/refractory DLBCL proceeding to ASCT were evaluated. At 3 years, patients achieving negative PET to salvage treatment experienced superior PFS and OS rates of 77% and 86%, respectively, compared with patients achieving positive PET (49% and 54%, respectively) (22). Among the other factors that we assessed, the number of previous chemotherapy regimens significantly affected the prognosis in univariate analysis. However, it was only correlated with PFS in the multivariate setting.
In our study, the prognostic value of post-ASCT PET result was also evaluated. Univariate analysis showed that post-ASCT PET-negative patients had significantly better PFS and OS rates than patients with positive PET result. Post-ASCT PET result was still a prognostic factor for PFS and OS rates in multivariate analysis. However, pre-ASCT PET result did not provide prognostic information in the multivariate setting. This finding was validated by categorizing patients into four groups according to pre- and post-ASCT results. Patients with negative post-ASCT PET result had better PFS and OS rates than patients with positive post-ASCT PET result, regardless of the pre-ASCT PET status. ROC curve analysis confirmed the finding. Combination of post- and pre-ASCT PET result had a better prognostic value than pre-ASCT alone.
The prognostic value of interim PET result for NHL in the frontline setting has been investigated (6,23-25). In a multicenter retrospective study, 88 DLBCL patients received 6–8 courses of R-CHOP (rituximab with cyclophosphamide, doxorubicin, vincristine and prednisolone). PET was performed after 2–4 courses (I-PET) and at the end of treatment (F-PET). This study found negative I-PET scan predicted a good outcome with 2-year PFS of 85%, whereas a positive I-PET scan failed to identify patients with a worse prognosis with a slightly inferior 2-year PFS of 72%. The results confirmed, as in other series, the strong predictive value of F-PET result on PFS (negative vs. positive, 83% vs. 64%) (15). The findings were validated in a prospective study of 138 evaluable DLBCL patients treated with R-CHOP. Deauville criteria were used to interpret PET scans. Two-year event-free survival (EFS) was significantly shorter for interim-PET-positive compared with negative patients (48% vs. 74%). However, 2-year OS was not significantly different, with 88% for PET-positive vs. 91% for PET-negative patients (25).
Therefore, the role of interim PET result in NHL remains a matter of debate. At this time, an interim PET/CT scan has limited prognostic value in patients with NHL. If we consider frontline treatment or salvage treatment followed by ASCT as a whole, pre-ASCT can be regarded as an interim scan. This could explain the unclear prognostic value of pre-ASCT PET result in the transplantation setting. However, the role of post-ASCT PET result as an end-of-treatment scan is more important, which was validated by our study.
The use of quantitation to improve the prognostic value of interim PET result has been explored. Change in the maximum standard uptake value (ΔSUVmax) in tumors between baseline and interim scans has been assessed as a measure of response. ROC curve analysis in 92 patients with DLBCL scanned after two cycles and 80 patients scanned after four cycles identified optimum thresholds for percentage ΔSUVmax for predicting EFS (14,26). A prospective study by Mamot et al. confirmed the findings (25). Compared with visual analysis, ΔSUVmax between baseline and interim PET scans was more significant in predicting 2-year OS in DLBCL. To date, various groups have reported ΔSUVmax with thresholds ranging from 66% to 91% (27-30). In our study, ΔSUVmax between baseline and pre-ASCT PET might have predicted the outcome of DLBCL patients. However, the role of ΔSUVmax was not evaluated in this scenario due to limited data.
With the introduction of Deauville criteria for the interpretation of PET scans, it is feasible to compare results among different studies. It has been validated for use at interim treatment and was adopted as the preferred reporting method (20,28-31). However, the data are limited regarding the use of Deauville criteria in the transplantation setting. In our study, the prognostic value of PET result was assessed with Deauville criteria as the interpretation method. Deauville criteria score >3 was identified as the best cutoff value for post-ASCT PET, which was adopted by most of the studies.
Conclusions
Numerous studies have reported the prognostic value of PET result before HDC-ASCT in NHL. However, in our study, post-ASCT PET result was more important than pre-ASCT PET result in terms of predicting outcomes. The prognostic significance can be improved when combining pre-ASCT PET result with post-ASCT PET result. The issue at this moment is how to identify those pre-ASCT PET-positive patients who can achieve a negative PET after ASCT. ΔSUVmax might be the future direction, but it needs more investigation.
Acknowledgements
The study is sponsored by Scientific Research Foundation for the Returned Overseas Chinese Scholars, Ministry of Human Resources and Social Security, and Beijing Municipal Administration of Hospitals Clinical Medicine Development of Special Funding Support (No. XMLX201502).
Footnote
Conflicts of Interest: The authors have no conflicts of interest to declare.
References
- Sehn LH, Berry B, Chhanabhai M, et al. The revised International Prognostic Index (R-IPI) is a better predictor of outcome than the standard IPI for patients with diffuse large B-cell lymphoma treated with R-CHOP. Blood 2007;109:1857–61.DOI:10.1182/blood-2006-08-038257
- Jia B, Shi Y, Kang S, et al. Addition of rituximab is not associated with survival benefit compared with CHOP alone for patients with stage I diffuse large B-cell lymphoma. Chin J Cancer Res 2015;27:516–23.DOI:10.3978/j.issn.1000-9604.2015.10.04
- International T-Cell Lymphoma Project. International peripheral T-cell and natural killer/T-cell lymphoma study: pathology findings and clinical outcomes. J Clin Oncol 2008;26:4124–30.DOI:10.1200/JCO.2008.16.4558
- Savage KJ, Chhanabhai M, Gascoyne RD, et al. Characterization of peripheral T-cell lymphomas in a single North American institution by the WHO classification. Ann Oncol 2004;15:1467–75.DOI:10.1093/annonc/mdh392
- d’Amore F, Relander T, Lauritzsen GF, et al. Up-front autologous stem-cell transplantation in peripheral T-cell lymphoma: NLG-T-01. J Clin Oncol 2012;30:3093–9.DOI:10.1200/JCO.2011.40.2719
- Chen AI, McMillan A, Negrin RS, et al. Long-term results of autologous hematopoietic cell transplantation for peripheral T cell lymphoma: the Stanford experience. Biol Blood Marrow Transplant 2008;14:741–7.DOI:10.1016/j.bbmt.2008.04.004
- Stiff PJ, Unger JM, Cook JR, et al. Autologous transplantation as consolidation for aggressive non-Hodgkin’s lymphoma. N Engl J Med 2013;369:1681–90.DOI:10.1056/NEJMoa1301077
- Gisselbrecht C, Glass B, Mounier N, et al. Salvage regimens with autologous transplantation for relapsed large B-cell lymphoma in the rituximab era. J Clin Oncol 2010;28:4184–90.DOI:10.1200/JCO.2010.28.1618
- Shi Y, Zhou S, He X, et al. Autologous hematopoietic stem cell transplantation in chemotherapy-sensitive lymphoblastic lymphoma: treatment outcome and prognostic factor analysis. Chin J Cancer Res 2015;27:66–73.DOI:10.3978/j.issn.1000-9604.2015.02.04
- Cahu X, Bodet-Milin C, Brissot E, et al. 18F-fluorodeoxyglucose-positron emission tomography before, during and after treatment in mature T/NK lymphomas: a study from the GOELAMS group. Ann Oncol 2011;22:705–11.DOI:10.1093/annonc/mdq415
- Casulo C, Schöder H, Feeney J, et al. 18F-fluorodeoxyglucose positron emission tomography in the staging and prognosis of T cell lymphoma. Leuk Lymphoma 2013;54:2163–7.DOI:10.3109/10428194.2013.767901
- Kim SJ, Choi JY, Hyun SH, et al. Risk stratification on the basis of Deauville score on PET-CT and the presence of Epstein-Barr virus DNA after completion of primary treatment for extranodal natural killer/T-cell lymphoma, nasal type: a multicentre, retrospective analysis. Lancet Haematol 2015;2:e66–74.DOI:10.1016/S2352-3026(15)00002-2
- Moon SH, Lee AY, Kim WS, et al. Value of interim FDG PET/CT for predicting outcome of patients with angioimmunoblastic T-cell lymphoma. Leuk Lymphoma 2017;58:1341–8.DOI:10.1080/10428194.2016.1236380
- Lin C, Itti E, Haioun C, et al. Early 18F-FDG PET for prediction of prognosis in patients with diffuse large B-cell lymphoma: SUV-based assessment versus visual analysis. J Nucl Med 2007;48:1626–32.DOI:10.2967/jnumed.107.042093
- Pregno P, Chiappella A, Bellò M, et al. Interim 18-FDG-PET/CT failed to predict the outcome in diffuse large B-cell lymphoma patients treated at the diagnosis with rituximab-CHOP. Blood 2012;119:2066–73.DOI:10.1182/blood-2011-06-359943
- Trotman J, Fournier M, Lamy T, et al. Positron emission tomography-computed tomography (PET-CT) after induction therapy is highly predictive of patient outcome in follicular lymphoma: analysis of PET-CT in a subset of PRIMA trial participants. J Clin Oncol 2011;29:3194–200.DOI:10.1200/JCO.2011.35.0736
- Carbone PP, Kaplan HS, Musshoff K, et al. Report of the committee on Hodgkin’s disease staging classification. Cancer Res 1971;31:1860–1.
- Hamlin PA, Zelenetz AD, Kewalramani T, et al. Age-adjusted international prognostic index predicts autologous stem cell transplantation outcome for patients with relapsed or primary refractory diffuse large B-cell lymphoma. Blood 2003;102:1989–96.DOI:10.1182/blood-2002-12-3837
- Schot BW, Zijlstra JM, Sluiter WJ, et al. Early FDG-PET assessment in combination with clinical risk scores determines prognosis in recurring lymphoma. Blood 2007;109:486–91.DOI:10.1182/blood-2005-11-006957
- Cheson BD, Fisher RI, Barrington SF, et al. Recommendations for initial evaluation, staging, and response assessment of Hodgkin and non-Hodgkin lymphoma: the Lugano classification. J Clin Oncol 2014;32:3059–68.DOI:10.1200/JCO.2013.54.8800
- Poulou LS, Thanos L, Ziakas PD. Unifying the predictive value of pretransplant FDG PET in patients with lymphoma: a review and meta-analysis of published trials. Eur J Nucl Med Mol Imaging 2010;37:156–62.DOI:10.1007/s00259-009-1258-y
- Sauter CS, Matasar MJ, Meikle J, et al. Prognostic value of FDG-PET prior to autologous stem cell transplantation for relapsed and refractory diffuse large B-cell lymphoma. Blood 2015;125:2579–81.DOI:10.1182/blood-2014-10-606939
- Haioun C, Itti E, Rahmouni A, et al. [18F]fluoro-2-deoxy-D-glucose positron emission tomography (FDG-PET) in aggressive lymphoma: an early prognostic tool for predicting patient outcome. Blood 2005;106:1376–81.DOI:10.1182/blood-2005-01-0272
- Dupuis J, Itti E, Rahmouni A, et al. Response assessment after an inductive CHOP or CHOP-like regimen with or without rituximab in 103 patients with diffuse large B-cell lymphoma: integrating 18fluorodeoxyglucose positron emission tomography to the International Workshop Criteria. Ann Oncol 2009;20:503–7.DOI:10.1093/annonc/mdn671
- Mamot C, Klingbiel D, Hitz F, et al. Final results of a prospective evaluation of the predictive value of interim positron emission tomography in patients with diffuse large B-Cell lymphoma treated with R-CHOP-14 (SAKK 38/07). J Clin Oncol 2015;33:2523–9.DOI:10.1200/JCO.2014.58.9846
- Itti E, Lin C, Dupuis J, et al. Prognostic value of interim 18F-FDG PET in patients with diffuse large B-cell lymphoma: SUV-based assessment at 4 cycles of chemotherapy. J Nucl Med 2009;50:527–33.DOI:10.2967/jnumed.108.057703
- Casasnovas RO, Meignan M, Berriolo-Riedinger A, et al. SUVmax reduction improves early prognosis value of interim positron emission tomography scans in diffuse large B-cell lymphoma. Blood 2011;118:37–43.DOI:10.1182/blood-2010-12-327767
- Nols N, Mounier N, Bouazza S, et al. Quantitative and qualitative analysis of metabolic response at interim positron emission tomography scan combined with International Prognostic Index is highly predictive of outcome in diffuse large B-cell lymphoma. Leuk Lymphoma 2014;55:773–80.DOI:10.3109/10428194.2013.831848
- Fuertes S, Setoain X, Lopez-Guillermo A, et al. Interim FDG PET/CT as a prognostic factor in diffuse large B-cell lymphoma. Eur J Nucl Med Mol Imaging 2013;40:496–504.DOI:10.1007/s00259-012-2320-8
- Yang DH, Ahn JS, Byun BH, et al. Interim PET/CT-based prognostic model for the treatment of diffuse large B cell lymphoma in the post-rituximab era. Ann Hematol 2013;92:471–9.DOI:10.1007/s00277-012-1640-x
- Itti E, Meignan M, Berriolo-Riedinger A, et al. An international confirmatory study of the prognostic value of early PET/CT in diffuse large B-cell lymphoma: comparison between Deauville criteria and ΔSUVmax. Eur J Nucl Med Mol Imaging 2013;40:1312–20.DOI:10.1007/s00259-013-2435-6