
Dynamic contrast-enhanced MRI versus 18F-FDG PET/CT: Which is better in differentiation between malignant and benign solitary pulmonary nodules?
Introduction
A solitary pulmonary nodule (SPN) is defined as a rounded lesion less than 3 cm in diameter that is completely surrounded by pulmonary parenchyma and without other pulmonary abnormalities (1). Ideally, the aims of diagnosis and management are to promptly perform surgery in all patients with operable malignant nodules and to avoid unnecessary treatment in those patients with benign lesions. For this reason, the accurate diagnosis of SPNs is very important. However, the differentiation of malignant from benign lung nodules is difficult in routine clinical practice. Initially, conventional computed tomography (CT) was used to obtain diagnostic information based on morphological images. As functional imaging has developed, some new methods, such as dynamic contrast-enhanced (DCE)-CT (2) and 18F-fluorodeoxyglucose (18F-FDG) positron emission tomography/computed tomography (PET/CT), have been introduced to quantitatively evaluate pulmonary nodules (3,4). DCE-CT, 18F-FDG PET and integrated 18F-FDG PET/CT provide excellent diagnostic accuracies (2-4). However, these modalities subject patients to both ionizing radiation and its associated risks. Another disadvantage of an 18F-FDG PET/CT exam is its high price.
Magnetic resonance imaging (MRI) does not subject a patient to any ionizing radiation. While T1- and T2-weighted imaging, including in- and out-of-phase gradient echo T1-weighted images, can aid in distinguishing pulmonary hamartomas via macroscopic and microscopic fat from certain granulomas and pulmonary malignancy, DCE-MRI has been shown to add further diagnostic specificity (5). Several studies used DCE-MRI with semi-quantitative parameters for differentiating malignant nodules from benign nodules in both small and large patient populations, yielding a broad range of sensitivities (52%–100%), specificities (from 17%–100%), and accuracies (from 58%–96%) (6,7). Thus, the semi-quantitative assessments of DCE-MRI could help diagnose SPNs to a certain extent, though not reliably. More quantitative assessments can be made with the pharmacokinetic parameters of DCE-MRI, such as the trans-endothelial transfer constant (Ktrans), the redistribution rate constant (Kep), and the fractional volume (Ve) of the extravascular extracellular space (EES) (8). Several studies reported that quantitative DCE-MRI was able to differentiate malignant from benign brain, breast, and prostatic lesions with both high sensitivity and specificity (9-11). However, few studies have been performed using DCE-MRI for lung imaging because of the technical difficulties related to cardiorespiratory motion and its associated artifacts, which heavily influence the accuracy of the parameters (12,13). As registration methods have developed, so have non-rigid image registration procedures that are used to correct for motion artifacts during the dynamic data acquisition of MRI (14). This method is based on the restoration of the deconvolved joint statistics, which are forced to register between the images to estimate an initial spatial transformation (15). It can register not only the positional movement of organs but also their transformation. In Molinari et al.’s study of DCE-MRI of lungs, they used non-rigid registration to reduce motion artifacts, which effectively improved image quality (16). Therefore, the purpose of our study was to prospectively compare the capability of DCE-MRI using non-rigid registration with that of 18F-FDG PET/CT to distinguish malignant from benign SPNs.
Materials and methods
Patients
This prospective study was approved by the institutional review board of Nantong Tumor Hospital. The methods used in this study were carried out in accordance with the Declaration of Helsinki. Written informed consent was obtained from each subject prior the initiation of the study. From October 2013 to October 2016, a total of 54 consecutive patients, with newly detected SPNs via chest radiography or CT, needed further evaluation. The patients were enrolled in this study according to the following criteria: 1) the absence of calcification or definite fat attenuation of the nodule observed by CT; 2) a nodule diameter between 8–30 mm. Lesion size was calculated by using the maximum long-axis diameter of the lung window settings in the transverse plane; 3) the absence of recent history (within the prior month) of pneumonia or immunodeficiency; and 4) the ability to participate cooperatively in the procedures. Five of the 54 patients were excluded, 3 of whom had detected calcifications in the nodules and 2 of whom were uncooperative during the procedures. According to the inclusive and exclusive criteria, a total of 49 consecutive patients with SPNs were included (29 males; 20 females), with a mean age of 61.8 (range, 44–78) years.
MRI protocol
MR imaging was performed using a 1.5T system (Espree; Siemens Medical Solutions, Erlangen, Germany) with a 16-channel phased-array torso XL coil for signal reception. First, fat saturated T2-weighted fast spin-echo sagittal images were obtained with the following parameters: time of repetition/time of echo (TR/TE), 6,680 ms/109 ms; flip angle, 70°; image matrix, 256×186; field of view (FOV), 380 mm × 380 mm; thickness, 4.0 mm; and overlap, 0 mm. Both sequences encompassed the whole thorax. In reference to de Langen et al.’s method (17), all the DCE-MR images were acquired in transverse planes by using a breath-holding technique. For the DCE-MRI acquisition, first, volumetric interpolated breath-hold examination (VIBE) T1-weighted non-enhanced sequences with four different flip angles (3°, 6°, 9° and 12° respectively) were used to obtain a T1 map of the tissue (18). Then, we started the dynamic acquisition using a VIBE T1-weighted sequence (TR 5.57 ms, TE 2.38 ms, number of averages 1, FOV 380 mm × 380 mm, matrix 256×256, flip angle 12°, 20 slices, and slice thickness 4.2 mm). After three non-contrast acquisition phases were obtained as the baseline images, a volume (based on each individual’s body weight, 0.2 mmol/kg) of gadolinium (Omniscan, GE healthcare Ireland, Carrigtohill, Ireland) was injected intravenously at a rate of 3 mL/s by a power injector. To minimize any artifacts caused by respiratory movement, a breath-hold scan was required during two phases (approximately 13 s) repeatedly throughout the acquisition. Finally, 40 phases were acquired, 3 of which were non-contrast phases (total data-acquisition time 5 min 27 s, with a temporal resolution of 6.4 s/phase).
18F-FDG PET/CT examinations
All the 18F-FDG PET/CT examinations were performed on a PET/CT scanner (Gemini TF, Philips Healthcare, Best, the Netherlands). The axes of the multidetector CT and PET systems were mechanically aligned so that one could move the patient from the multidetector CT scanner gantry to the PET scanner gantry by simply changing the position of the examination table. Seven to eight frames (3 min/frame) of emission PET data were acquired in the three-dimensional mode after obtaining a non-contrast CT scan from the base of the skull to the upper thigh (120 kV; 150 mA; section width, 3.75 mm). The emission 18F-FDG PET images were reconstructed using an iterative method (ordered-subsets expectation maximization with 2 iterations and 20 subsets, field of view, 600 mm, slice thickness, 3 mm) and were corrected by reference to the non-contrast CT image attenuation. All the patients were required to fast for at least 6 h before the PET/CT examination. Blood glucose measurements were obtained from all the patients before the administration of the 18F-FDG scanning, and glucose levels were required to be less than 140 mg/dL at the time of injection. Then, 18F-FDG was intravenously administered at a rate of 3.3 MBq per kilogram of body weight, and 18F-FDG PET/CT images were obtained from the skull to the middle region of the thigh 60 min after the completion of the injection.
MR image and data analysis
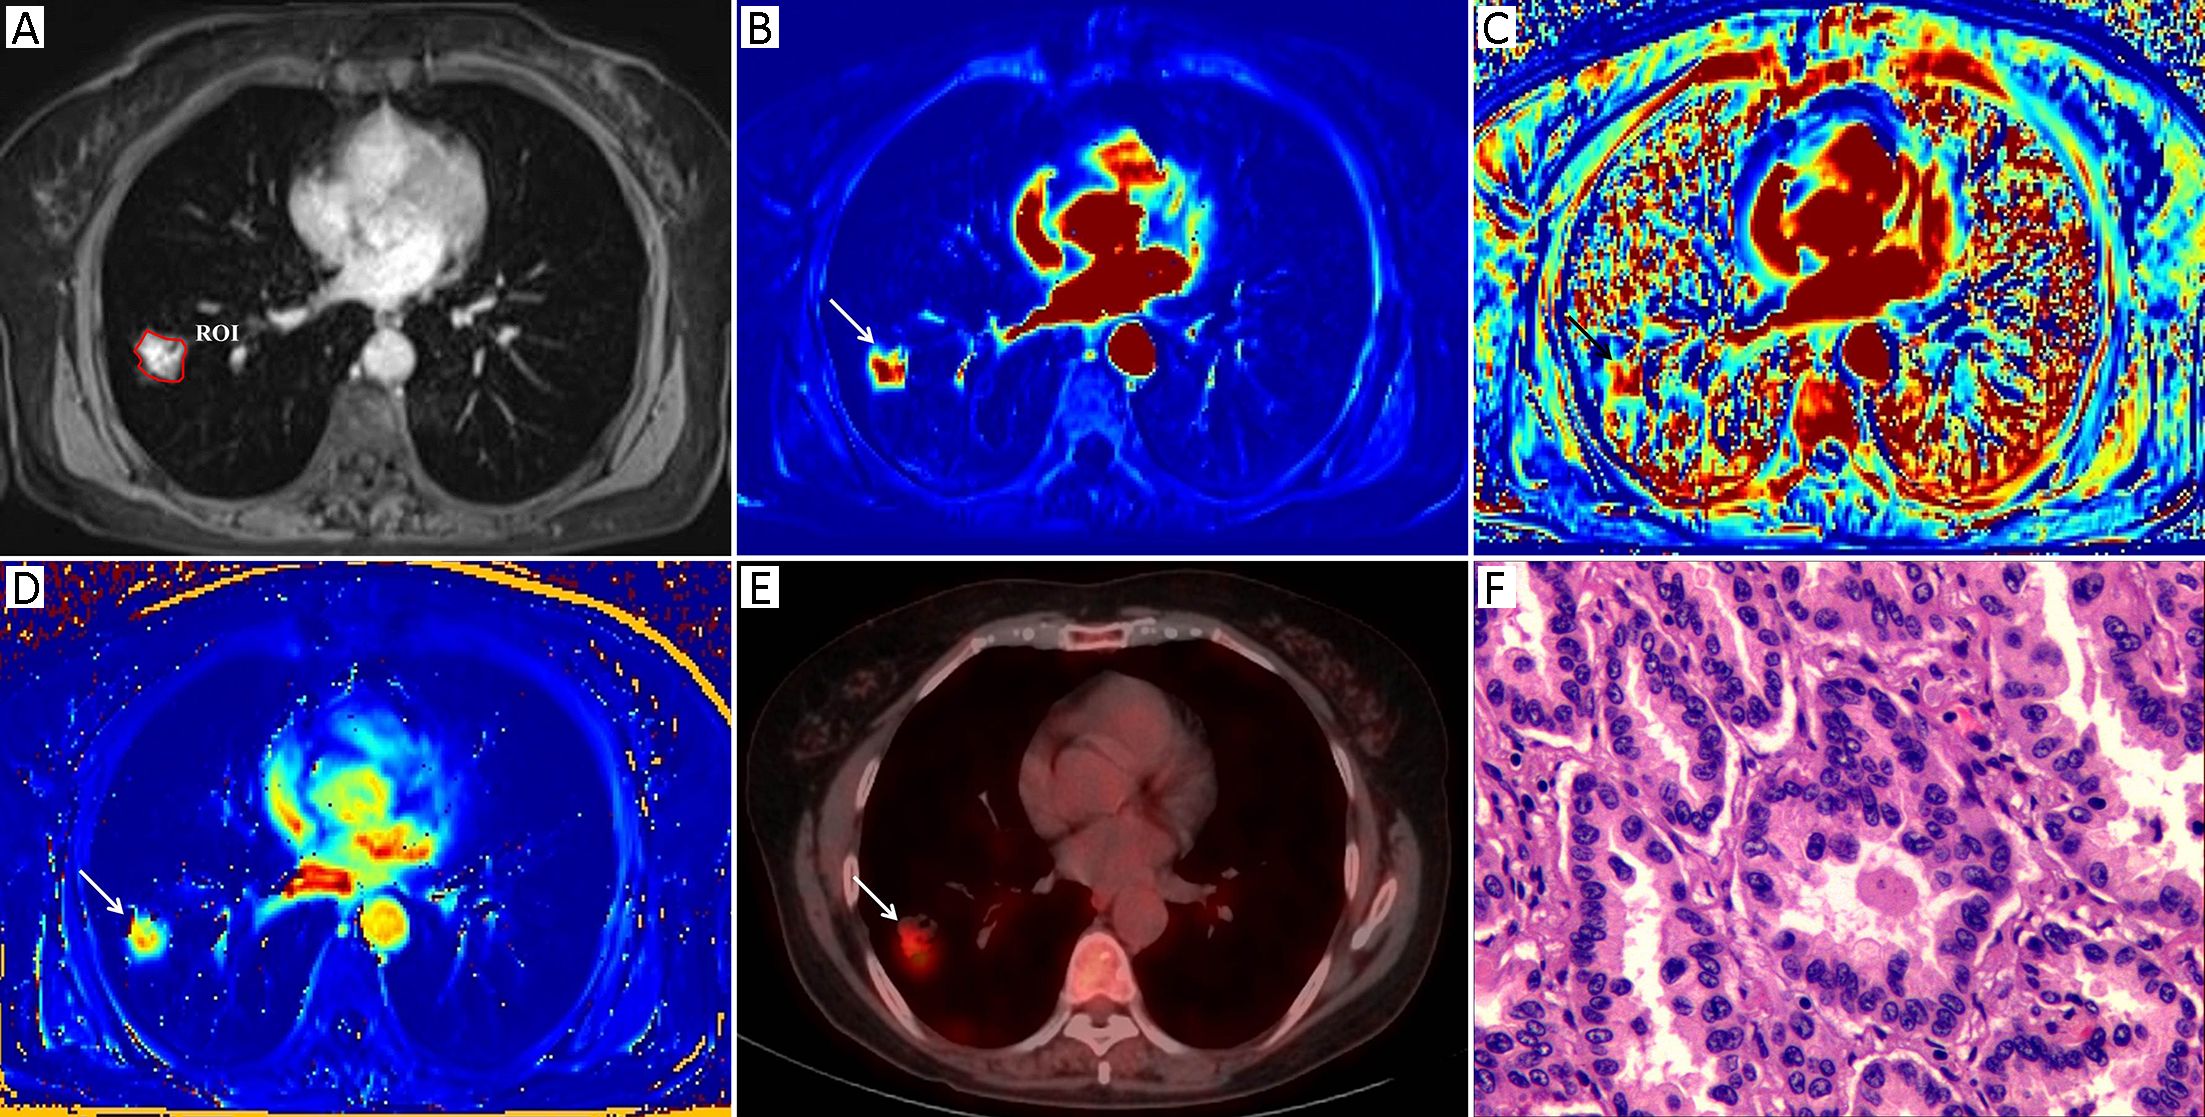
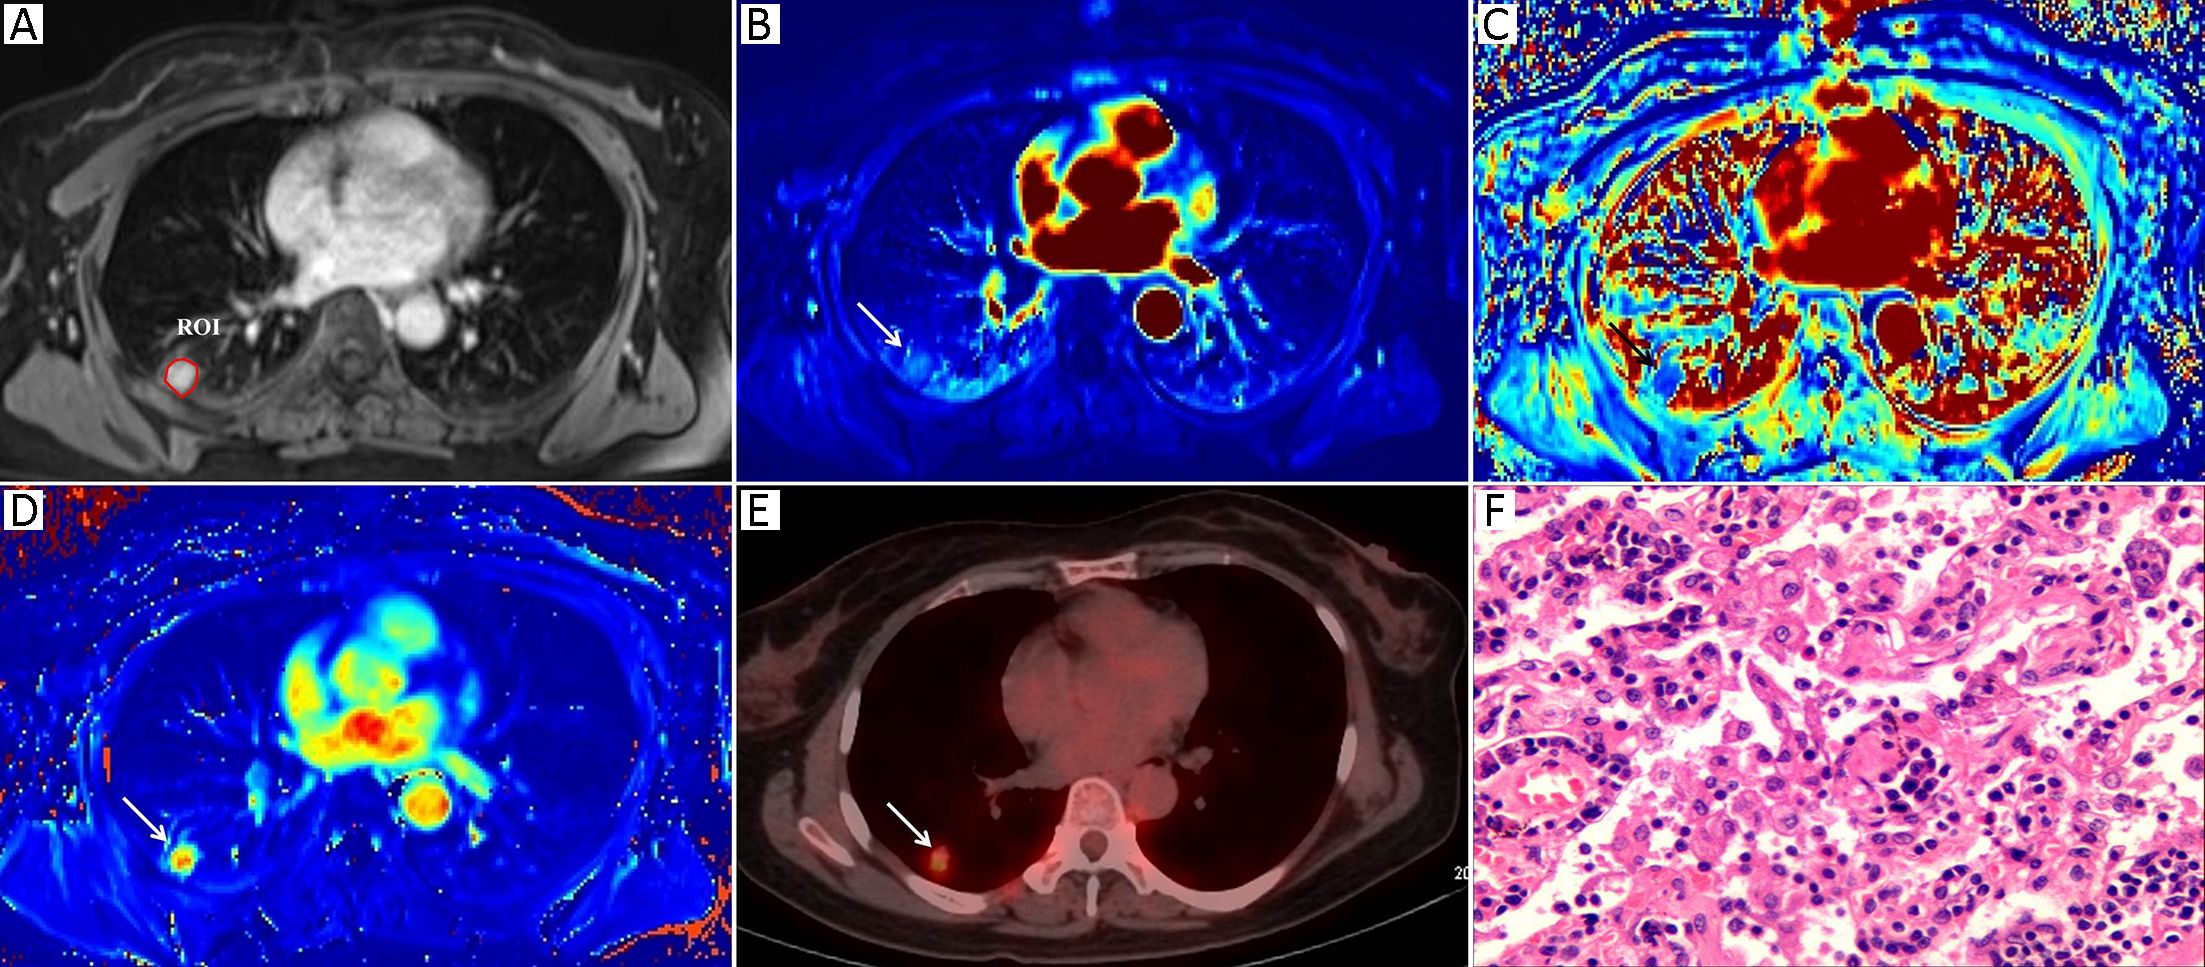
Morphologic evaluations and quantitative analysis of DCE images were performed by two radiologists with 7 and 10 years of experience in lung imaging and diagnosis, respectively. Both of them were blinded to the final diagnosis. The SPNs were analyzed concerning their size and margin (e.g., smooth, non-smooth). The MR images were reviewed independently by two observers who reached a decision by consensus. All of the DCE-MRI data were transferred into non-commercial software (OmniKinetics, GE Healthcare China, Beijing, China). A major problem in DCE-MRI of lungs is motion artifacts due to respiration; thus, motion correction is needed to improve the quantitative accuracy. Non-rigid registration with the OmniKinetics software uses free-form deformation and mutual information methods (18). The method adapts to not only the movements of rotation or translation but also local (elastic) deformations, such as in the lungs, liver or heart; the performance of this image processing step is necessary as it reduces the motion artifacts before the measurements of pharmacokinetic parameters (19). These transformations are capable of locally warping the last phase DCE-MR image to align with the first phase reference image (18). Thereafter, robust data were guaranteed. In our study, non-rigid registration was done before the measurements of the DCE-MRI parameters. The artery input function (AIF) was obtained by manually drawing a small, circular region of interest (ROI) in the thoracic aorta in the same plane as the maximal transverse diameter of the SPN. The enhancement kinetics from each pixel was measured throughout all the dynamic phases and was fitted by using a two-compartment extended Tofts model. The pharmacokinetic parameters Ktrans, Kep and Ve were derived, and a color map of each parameter was generated. A single slice of the axial DCE-MRI scans of the maximal area of each lesion was analyzed in order to assess pairs of the DCE-MRI images from almost identical parts of each nodule. A ROI was drawn manually to contour the border of each SPN at the level of the longest transverse diameter of the lesion based on post-contrast T1-weighted images (Figure 1A, 2A). Any visually identified vessels or necrotic areas were excluded.
Measurement of 18F-FDG PET/CT parameters
The 18F-FDG PET/CT images were visually evaluated on a dedicated workstation (Philips Advantage Workstation) by two nuclear medicine specialists with 5 years and 6 years of PET/CT experience. Both of them were blinded to the final diagnosis. The metabolic parameter, the maximum standardized uptake value (SUVmax), was obtained using the Volume Viewer software (Shanghai Xingxiang Co. Ltd., China). ROI placement was performed using the same rules as those for DCE-MR image ROI placement and was also drawn manually to contour the border of each SPN at the level of the longest transverse diameter of the lesion on the fusion 18F-FDG PET/CT images. Adjacent 18F-FDG-avid structures and areas exhibiting physiological uptake were avoided. The SUVmax was calculated using the following formula: maximum pixel value multiplied by the decay-corrected ROI activity (MBq/mL)/[injected dose (MBq)/body weight (g)].
Statistical analysis
The numerical data are reported as x±s of all three sets of measurements. The χ2 test, Fisher’s exact test and the Mann-Whitney U test were used to compare the clinical and MRI morphologic variables between the two groups. The intra-class correlation coefficient (ICC) and the coefficient of variation (CV) were calculated to evaluate both the intra- and inter-observer variability. A correlation coefficient of 0–0.5 was considered a poor correlation, 0.5–0.8 a moderate correlation and >0.8 a high correlation. The mean values of the three sets of data were used for the correlation analyses. Spearman’s rank correlation coefficients were calculated to measure the association between the 18F-FDG PET/CT and DCE-MRI parameters of the SPNs. The metabolic and perfusion parameters of benign and malignant lesions were compared using the Mann-Whitney U test. The sensitivity, specificity and accuracy for differentiating malignant from benign lung lesions were calculated for 18FDG-PET/CT and MRI parameters. A receiver operating characteristic (ROC) curve was used to find the optimal cut-off. In reference to DeLong et al.’s method (20), the area under the curve (AUC) of the DCE-MRI indexes and that of the SUVmax were compared for distinguishing malignant from benign SPNs. All analyses were performed using SPSS 16.0 software (SPSS Inc., Chicago; IL, USA). For all tests, two-tailed P<0.05 was considered statistically significant.
Results
Final diagnosis
Of the 49 patients, 33 underwent surgical resection, 14 underwent CT-guided needle biopsy, and two patients underwent a 6-month follow-up CT scan with lesion disappearance after initiation of antibacterial therapy; these latter two lesions were therefore considered clinically benign, solitary nodules. All nodules were classified into two groups on the basis of their final diagnosis. One group was composed of 32 patients with malignant nodules, of whom 23 had adenocarcinomas, 4 had squamous cell carcinomas, 1 had an adenosquamous carcinoma, 1 had a pleomorphic carcinoma, 1 had a lymphoepithelioma-like carcinoma, 1 had a small cell carcinoma, and 1 had a metastatic lung tumor from breast cancer. The other group was composed of 17 patients with benign nodules (of whom 11 had organized pneumonia lesions, 3 had tubercular granulomas, 1 had a hamartoma, and 2 had follow-up diagnoses of benign nodules).
Clinical and imaging data
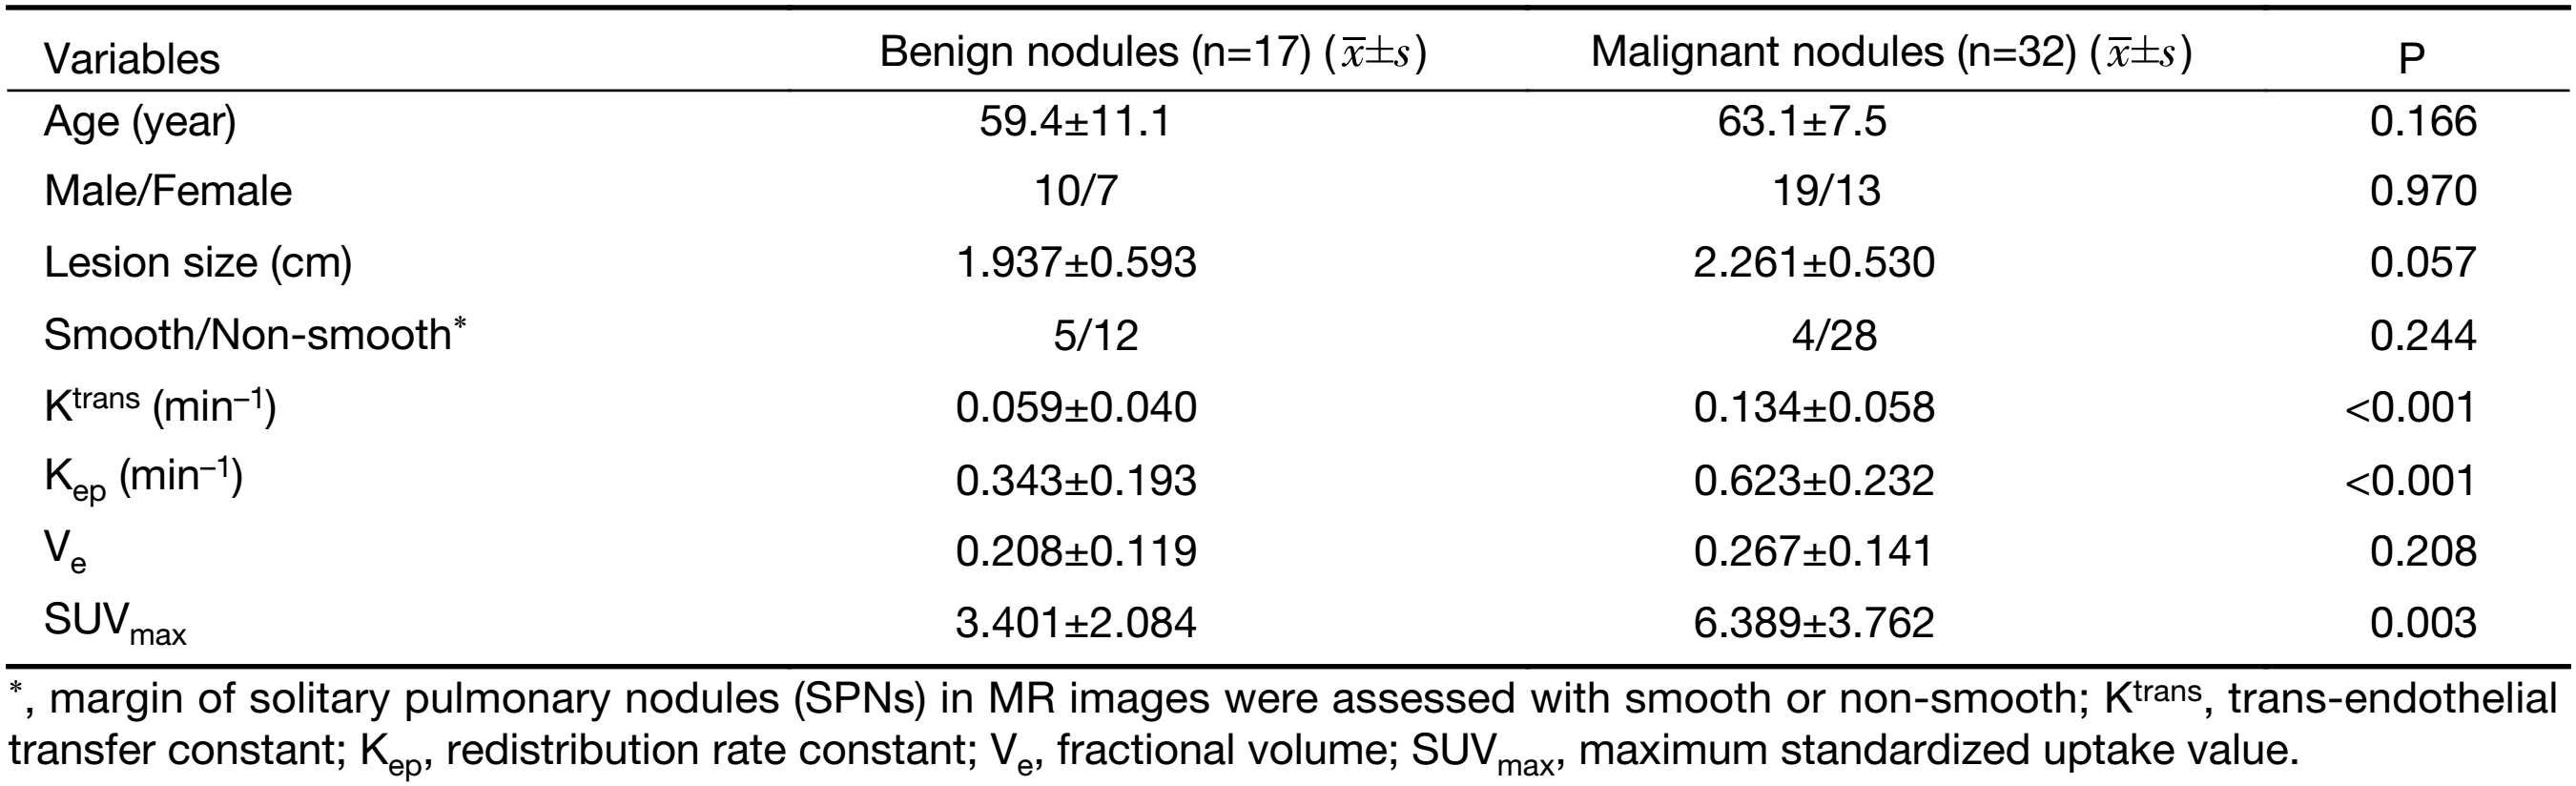
Table 1 summarizes both the clinical and imaging data. No significant differences were found in terms of age, sex, lesion size or margin of the SPNs between the two groups (P>0.05). Representative examples of the DCE-MRI and18F-FDG PET/CT images are shown in Figures 1 and 2, illustrating the typical color changes in the respective parameter maps.
Full table
Intra- and inter-observer reproducibility agreement
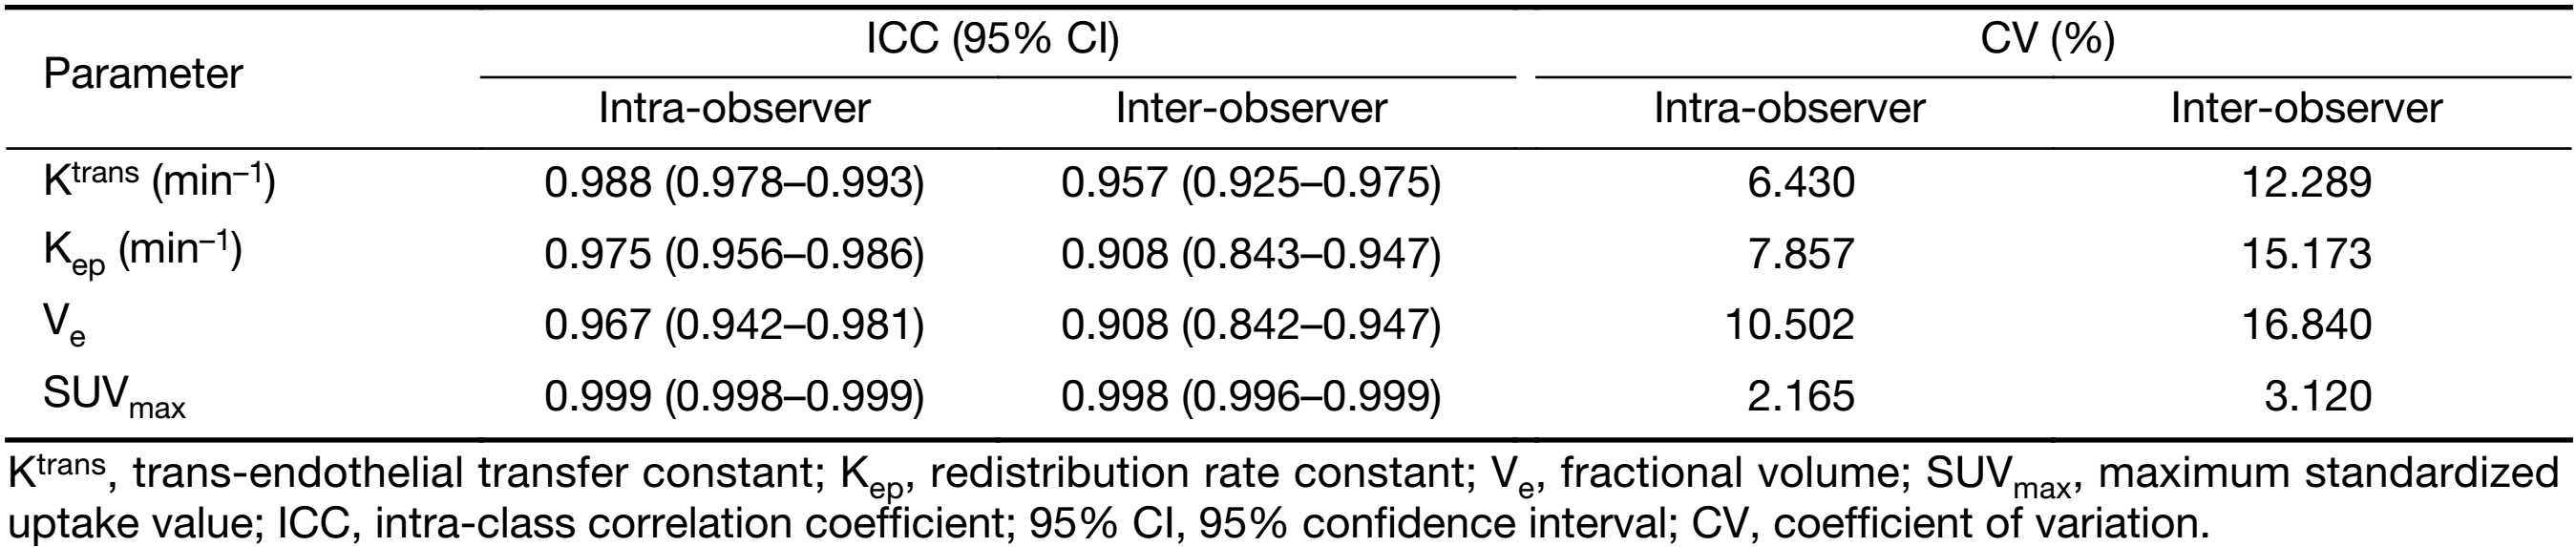
The intra- and inter-observer reproducibility for the measurement of the DCE-MRI (Ktrans, Kep and Ve) and 18F-FDG PET/CT parameters (SUVmax) are presented in Table 2. Good intra- and inter-observer reproducibility were obtained for all DCE-MRI (Ktrans, Kep and Ve) and 18F-FDG PET/CT (SUVmax) parameters, with ICC values ranging from 0.942 to 0.999 and from 0.842 to 0.999, respectively. The intra-observer CV ranged from 2.165% to 10.502%, and the inter-observer CV ranged from 3.120% to 16.840%.
Full table
Correlation analysis between 18F-FDG PET/CT and DCE-MRI parameters
A correlation analyses of all perfusion parameters and SUVmax revealed the following: Ktrans had a positive correlation with SUVmax (P=0.006), Kep had a positive correlation with SUVmax (P=0.030), and Ve did not correlate with SUVmax (P=0.661).
Comparison of 18F-FDG PET/CT and DCE-MRI parameters
The comparisons of 18F-FDG PET/CT and DCE-MRI parameters are shown in Table 1. The mean Ktrans, Kep, Ve and SUVmax of malignant nodules were 0.134±0.058 min–1, 0.623±0.232 min–1, 0.267±0.141, and 6.389±3.762, respectively; the mean Ktrans, Kep, Ve and SUVmax of benign nodules were 0.059±0.040 min–1, 0.343±0.193 min–1, 0.208±0.119, and 3.401±2.084, respectively. There were significant differences between malignant and benign nodules in Ktrans (P<0.001) and Kep (P<0.001). There was a significant difference between malignant and benign nodules in terms of SUVmax (P=0.003). There was no significant difference between malignant and benign nodules in terms of Ve (P=0.208).
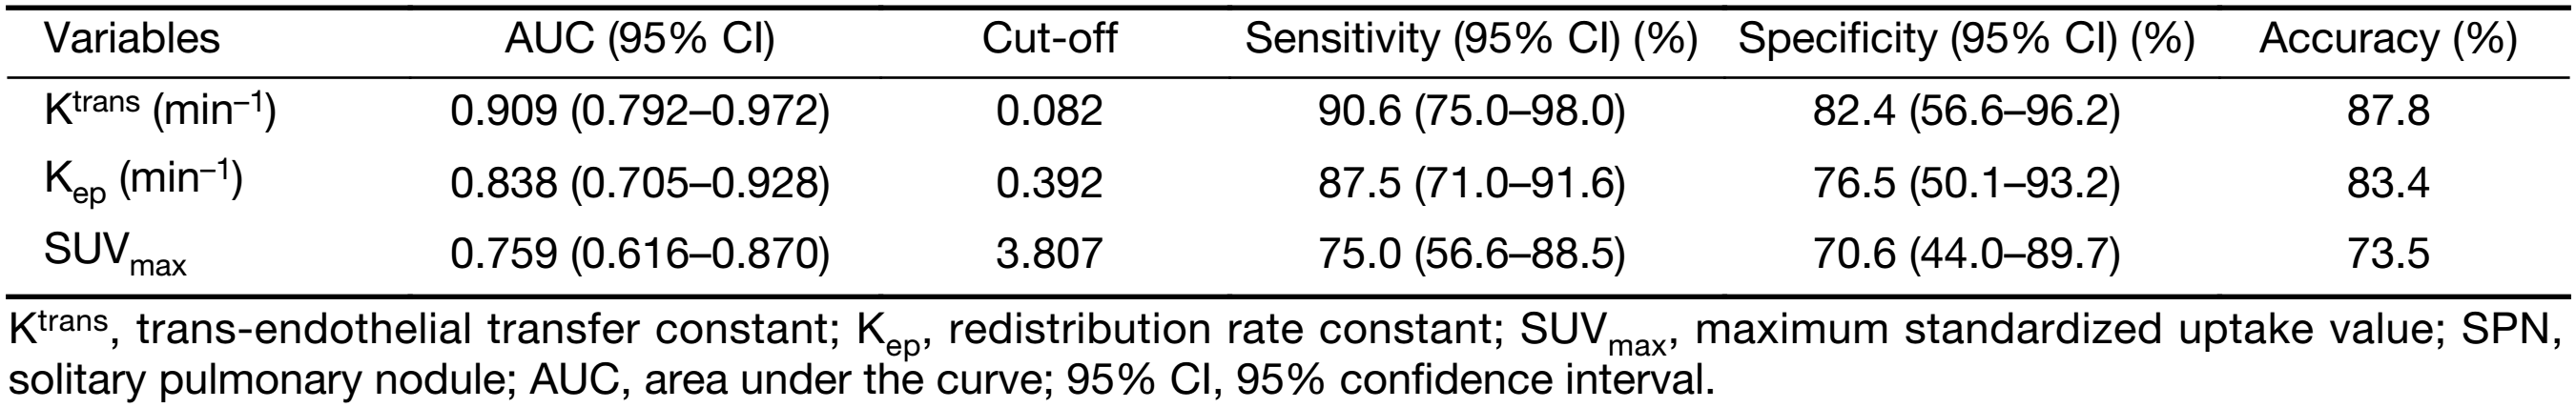
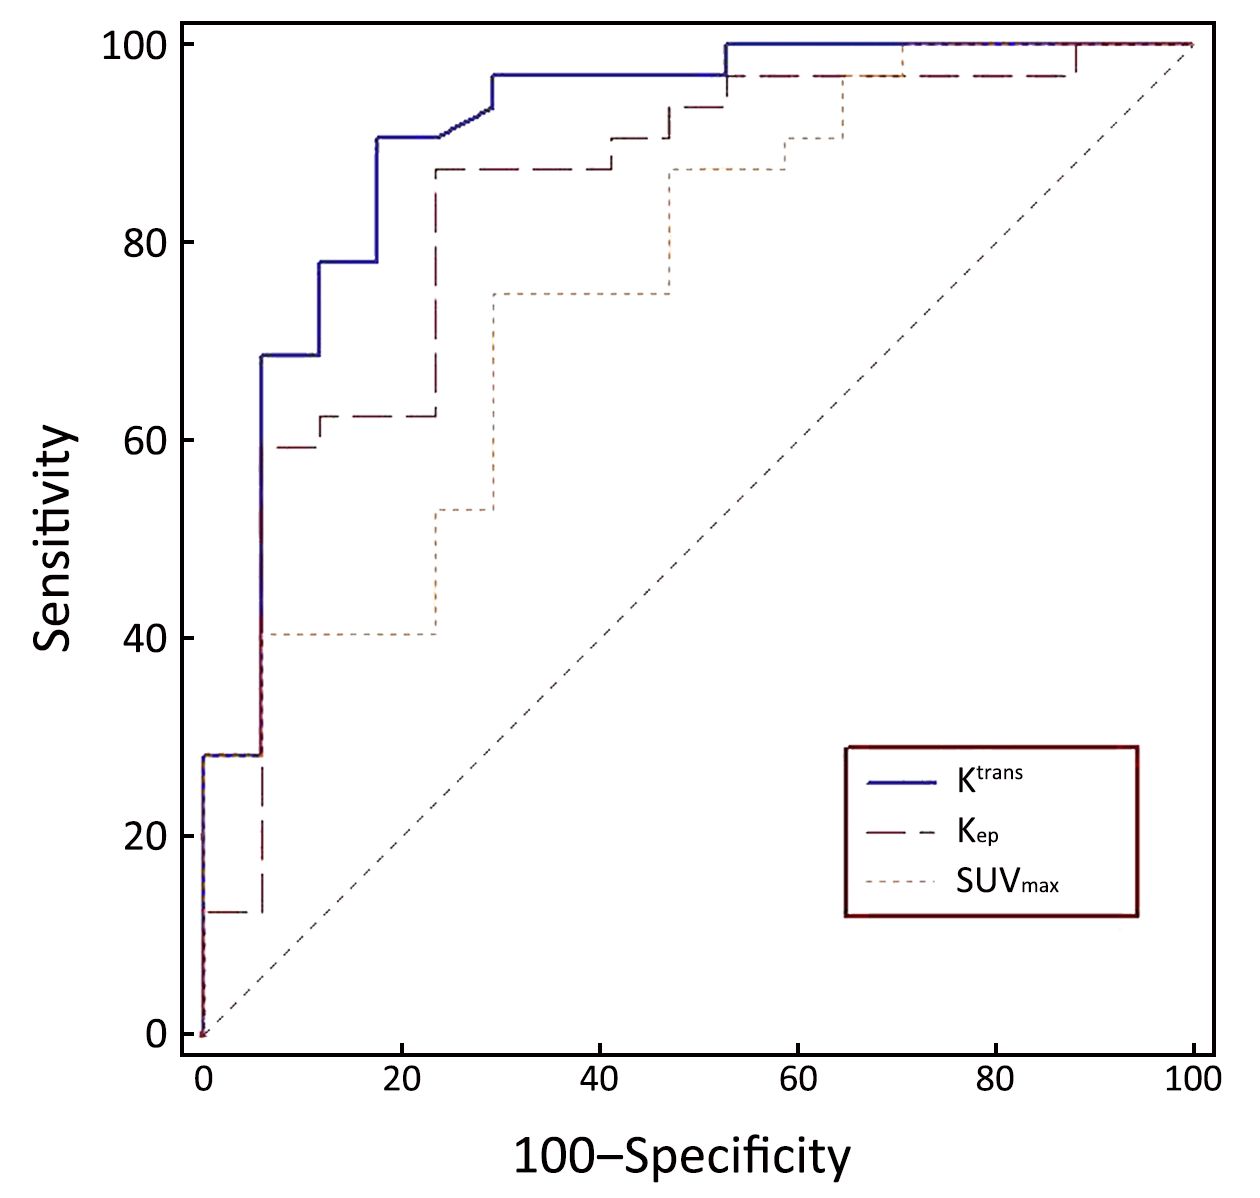
The diagnostic capabilities of the DCE-MRI indexes and of SUVmax are shown in Table 3. The AUC of Ktrans, Kep, and SUVmax between malignant and benign nodules were 0.909, 0.838, and 0.759, respectively. The sensitivity and specificity in differentiating malignant from benign SPNs were 90.6% and 82.4%, respectively, for Ktrans; 87.5% and 76.5%, respectively, for Kep; and 75.0% and 70.6% for SUVmax, respectively (Figure 3). There was no significant difference in the AUC between Ktrans and SUVmax (P=0.080) or between Kep and SUVmax (P=0.343) in the diagnosis of SPNs.
Full table
Discussion
DCE-MRI is a promising technique that can be used to evaluate vascular permeability, which typically increases significantly in tumors secondary to tumor angiogenesis. Our study results show significant correlations between SUVmax and Ktrans and between SUVmax and Kep for all SPNs. In addition, the DCE-MRI parameters Ktrans and Kep have the capability to distinguish between benign and malignant SPNs and can offer the advantages of no ionizing radiation and high cost-effectiveness when compared with 18F-FDG PET/CT.
The evaluation of the reproducibility of the various 18F-FDG PET/CT and DCE-MRI parameters indicated that there was good to excellent concordance of each parameter in terms of the intra-observer and inter-observer measurements. Moreover, the reproducibility of all of the parameters evaluated in our study was consistent with those of indexes that were used in previously published studies (21,22). Regarding the reproducibility of DCE-MRI parameter measurements, Wang et al. recently reported good reproducibility (ICC>0.8) when measuring the perfusion parameters Ktrans, Kep, Ve in lung cancer patients (21). In a recent study, Ohno et al. also reported excellent reproducibility of SUVmax as determined by 18F-FDG PET/CT in SPNs (22).
Positive correlations were observed between Ktrans and SUVmax as well as between Kep and SUVmax. 18F-FDG PET/CT and DCE-MRI reflect different aspects of physiological features and pathological changes of pulmonary nodules. A high SUVmax is mainly associated with high cellular density, blood flow, hypoxia and tumor aggressiveness, while higher Ktrans and Kep are related to increased microvessel density and permeability (23,24). Therefore, it is not surprising that the higher metabolic activity is associated with increased perfusion and permeability. Our results are consistent with previous studies that reported good or excellent correlations among the perfusion parameters and SUVmax of SPNs (19). Therefore, our results suggest that perfusion indexes of DCE-MRI can replace SUVmax for functional assessment of pulmonary nodules to a certain extent.
Among the various parameters studied, our results demonstrate that the DCE-MRI parameters Ktrans and Kep were both significantly different for benign and malignant nodules. Nonspecific small molecular contrast media, as an in vivo tracing marker, can transfer in and out of microvessels and reach a steady state to maintain their intravascular and EES distribution. Ktrans is defined as the trans-endothelial transfer constant of the contrast media that reflects the perfusion and permeability status of the tissue microvasculature. Previous studies have demonstrated that a higher Ktrans is associated with more permeable vessels, which can result from tumor angiogenesis (12,13). Kep is defined as reflux from the EES to the plasma. As the EES pressure increases, the contrast media passes back into the vessel rapidly. Normally, a higher Kep indicates a higher cell density and vascular permeability of malignant tissue (25). The malignant SPN tissue has a higher microvascular density due to tumor angiogenesis and results in much more permeable capillaries (17,26). The amount of contrast media accumulates in the EES; that is why Ktrans and Kep are markedly increased in malignant nodules compared with benign nodules. Consistent with our findings, Yuan et al. demonstrated higher Ktrans and Kep values in lung cancer than in benign lesions (13).
18F-FDG PET/CT reflects the glucose metabolism of various tissues. Malignant nodules consist of metabolically active cells that have higher levels of glucose uptake due to overexpression of glucose transporter proteins (27,28). 18F-FDG becomes trapped and accumulates within these cells, as the radiolabeled glucose analogue is phosphorylated once but not metabolized further. 18F-FDG PET is reported to be an accurate non-invasive imaging test, with a meta-analysis reporting a pooled sensitivity of 96.8% and a specificity of 77.8% for malignant nodules (29).
In our study, the sensitivity and specificity of Ktrans and Kep in terms of their diagnostic performance in the differentiation of malignant from benign nodules were higher than those of SUVmax. There was no significant difference between Ktrans and SUVmax or between Kep and SUVmax. Therefore, DCE-MRI can be considered at least as effective as 18F-FDG PET/CT. MRI has the following advantages over 18F-FDG PET/CT: 1) there is no radiation exposure; 2) less time is required for the examination (30 min in DCE-MRI versus 90 min in 18F-FDG PET/CT); and 3) the price of an 18F-FDG PET/CT exam is around 1,000 US dollars in China (official price in 2015), while the price of DCE-MRI per patient is around 200 US dollars in China (official price in 2015). Clearly, the cost of DCE-MRI is dramatically reduced. However, attention should be paid to gadolinium-induced nephropathy, which is still an issue even if it does not occur frequently (<2%) in patients without risk factors, such as impaired renal function, advanced age, and heart insufficiency (30).
There were several limitations of our study. First, this study was performed at a single center and the total number of patients was relatively small. The distribution of benign and malignant tumors, as well as the histopathologic subtypes, was not well-balanced. This has relevant implications for diagnostic specificity. Second, the study design did not aim to validate any acknowledged thresholds or to develop a classification model based on multivariate statistics or machine learning methods. These methods require large databases, which have not been established as of yet. Finally, the consistency and reproducibility of the DCE-MRI parameters in our study were good. However, our study was only performed on a Siemens MR Scanner and analyzed using non-commercial software from GE healthcare. As Heye et al. reported, there is substantial variability (>20% CV) in the calculated pharmacokinetic DCE-MRI parameters (Ktrans, Kep, Ve) across various commercially available DCE-MRI perfusion analysis solutions, severely limiting the comparability of our data (31). The consistency and reproducibility of pharmacokinetic parameter outputs across vendor platforms still need to be established.
Conclusions
We conclude that pharmacokinetic analysis by DCE-MRI can obtain an equivalent distinction of benign SPNs from malignant SPNs compared to 18F-FDG PET/CT and that DCE-MRI has the advantages of being ionizing radiation free and cost-effective.
Acknowledgements
This work was supported by the Jiangsu Province Natural Science Foundation (No. BK20161291), the Nantong Science Foundation of China (No. MS2201507) and the Nantong Municipal Commission of Health and Family Planning Young Fund (No. WQ2014047).
Footnote
Conflicts of Interest: The authors have no conflicts of interest to declare.
References
- Hansell DM, Bankier AA, MacMahon H, et al. Fleischner Hansell DM, Bankier AA, MacMahon H, et al. Fleischner Society: glossary of terms for thoracic imaging. Radiology 2008;246:697–722. [PubMed] DOI:10.1148/radiol.2462070712
- Ohno Y, Koyama H, Matsumoto K, et al. Differentiation of malignant and benign pulmonary nodules with quantitative first-pass 320-detector row perfusion CT versus FDG PET/CT. Radiology 2011;258:599–609. [PubMed] DOI:10.1148/radiol.10100245
- Ruilong Z, Daohai X, Li G, et al. Diagnostic value of 18F-FDG-PET/CT for the evaluation of solitary pulmonary nodules: a systematic review and meta-analysis. Nucl Med Commun 2017;38:67–75. [PubMed] DOI:10.1097/MNM.0000000000000605
- Kono R, Fujimoto K, Terasaki H, et al. Dynamic MRI of solitary pulmonary nodules: comparison of enhancement patterns of malignant and benign small peripheral lung lesions. AJR Am J Roentgenol 2007;188:26–36. [PubMed] DOI:10.2214/AJR.05.1446
- Biederer J, Hintze C, Fabel M. MRI of pulmonary nodules: technique and diagnostic value. Cancer Imaging 2008;8:125–30. [PubMed] DOI:10.1102/1470-7330.2008.0018
- Cronin P, Dwamena BA, Kelly AM, et al. Solitary pulmonary nodules: meta-analytic comparison of cross-sectional imaging modalities for diagnosis of malignancy. Radiology 2008;246:772–82. [PubMed] DOI:10.1148/radiol.2463062148
- Ohno Y, Nishio M, Koyama H, et al. Dynamic contrast-enhanced CT and MRI for pulmonary nodule assessment. AJR Am J Roentgenol 2014;202:515–29. [PubMed] DOI:10.2214/AJR.13.11888
- Ng CS, Wei W, Bankson JA, et al. Dependence of DCE-MRI biomarker values on analysis algorithm. PLoS One 2015;10:e130168. [PubMed] DOI:10.1371/journal.pone.0130168
- Thomas AA, Arevalo-Perez J, Kaley T, et al. Dynamic contrast enhanced T1 MRI perfusion differentiates pseudoprogression from recurrent glioblastoma. J Neurooncol 2015;125:183–90. [PubMed] DOI:10.1007/s11060-015-1893-z
- Jena A, Mehta SB, Taneja S. Optimizing MRI scan time in the computation of pharmacokinetic parameters (Ktrans) in breast cancer diagnosis. J Magn Reson Imaging 2013;38:573–9. [PubMed] DOI:10.1002/jmri.24008
- Othman AE, Falkner F, Martirosian P, et al. Optimized fast dynamic contrast-enhanced magnetic resonance imaging of the prostate: effect of sampling duration on pharmacokinetic parameters. Invest Radiol 2016;51:106–12. [PubMed] DOI:10.1097/RLI.0000000000000213
- Zhang J, Chen L, Chen Y, et al. Tumor vascularity and glucose metabolism correlated in adenocarcinoma, but not in squamous cell carcinoma of the lung. PLoS One 2014;9:e91649. [PubMed] DOI:10.1371/journal.pone.0091649
- Yuan M, Zhang YD, Zhu C, et al. Comparison of intravoxel incoherent motion diffusion-weighted MR imaging with dynamic contrast-enhanced MRI for differentiating lung cancer from benign solitary pulmonary lesions. J Magn Reson Imaging 2016;43:669–79. [PubMed] DOI:10.1002/jmri.25018
- Melbourne A, Hipwell J, Modat M, et al. The effect of motion correction on pharmacokinetic parameter estimation in dynamic-contrast-enhanced MRI. Phys Med Biol 2011;56:7693–708. [PubMed] DOI:10.1088/0031-9155/56/24/001
- Mihai G, Ding Y, Xue H, et al. Non-rigid registration and KLT filter to improve SNR and CNR in GRE-EPI myocardial perfusion imaging. J Biomed Sci Eng 2012;5:871–7. [PubMed] DOI:10.4236/jbise.2012.512A110
- Molinari F, Bauman G, Paolantonio G, et al. Improvement of multislice oxygen-enhanced MRI of the lung by fully automatic non-rigid image registration. Eur J Radiol 2012;81:2900–6. [PubMed] DOI:10.1016/j.ejrad.2011.11.002
- de Langen AJ, van den Boogaart V, Lubberink M, et al. Monitoring response to antiangiogenic therapy in non-small cell lung cancer using imaging markers derived from PET and dynamic contrast-enhanced MRI. J Nucl Med 2011;52:48–55. [PubMed] DOI:10.2967/jnumed.110.078261
- Hao L, Huang Y, Gao Y, et al. Nonrigid registration of prostate diffusion-weighted MRI. J Healthc Eng 2017;2017:9296354. [PubMed] DOI:10.1155/2017/9296354
- Yang X, Ghafourian P, Sharma P, et al. Nonrigid registration and classification of the kidneys in 3D dynamic contrast enhanced (DCE) MR images. Proc SPIE Int Soc Opt Eng 2012;8314:83140B. [PubMed] DOI:10.1117/12.912190
- DeLong ER, DeLong DM, Clarke-Pearson DL. Comparing the areas under two or more correlated receiver operating characteristic curves: a non-parametric approach. Biometrics 1988;44:837–45. [PubMed] DOI:10.2307/2531595
- Wang LL, Lin J, Liu K, et al. Intravoxel incoherent motion diffusion-weighted MR imaging in differentiation of lung cancer from obstructive lung consolidation: comparison and correlation with pharmacokinetic analysis from dynamic contrast-enhanced MR imaging. Eur Radiol 2014;24:1914–22. [PubMed] DOI:10.1007/s00330-014-3176-z
- Ohno Y, Nishio M, Koyama H, et al. Solitary pulmonary nodules: Comparison of dynamic first-pass contrast-enhanced perfusion area-detector CT, dynamic first-pass contrast-enhanced MR imaging, and FDG PET/CT. Radiology 2015;274:563–75. [PubMed] DOI:10.1148/radiol.14132289
- Zhang CY, Yu HL, Li X, et al. Diagnostic value of computed tomography scanning in differentiating malignant from benign solitary pulmonary nodules: a meta-analysis. Tumour Biol 2014;35:8551–8. [PubMed] DOI:10.1007/s13277-014-2113-8
- Jiang B, Liu H, Zhou D. Diagnostic and clinical utility of dynamic contrast-enhanced MR imaging in indeterminate pulmonary nodules: a metaanalysis. Clin Imaging 2016;40:1219–25. [PubMed] DOI:10.1016/j.clinimag.2016.08.017
- Mamata H, Tokuda J, Gill RR, et al. Clinical application of pharmacokinetic analysis as a biomarker of solitary pulmonary nodules: dynamic contrast-enhanced MR imaging. Magn Reson Med 2012;68:1614–22. [PubMed] DOI:10.1002/mrm.24150
- Cappabianca S, Porto A, Petrillo M, et al. Preliminary study on the correlation between grading and histology of solitary pulmonary nodules and contrast enhancement and [18F]fluorodeoxyglucose standardised uptake value after evaluation by dynamic multiphase CT and PET/CT. J Clin Pathol 2011;64:114–9. [PubMed] DOI:10.1136/jcp.2010.076562
- Wong CY, Al-faham Z, Jolepalem P, et al. Time sensitivity-corrected retention index: an enhanced metabolic index from 18F-FDG PET to differentiate between benign and malignant pulmonary nodules. Nucl Med Commun 2014;35:1220–3. [PubMed] DOI:10.1097/MNM.0000000000000190
- Turan O, Ozdogan O, Gurel D, et al. Growth of a solitary pulmonary nodule after 6 years diagnosed as oncocytic carcinoid tumour with a high 18-fluorodeoxyglucose (18F-FDG) uptake in positron emission tomography-computed tomography (PET/CT). Clin Respir J 2013;7:e1–5. [PubMed] DOI:10.1111/j.1752-699X.2011.00274.x
- Gould MK, Maclean CC, Kuschner WG, et al. Accuracy of positron emission tomography for diagnosis of pulmonary nodules and mass lesions: a meta-analysis. JAMA 2001;285:914–24. [PubMed] DOI:10.1001/jama.285.7.914
- Bernhardt P, Rodewald C, Seeger J, et al. Non-contrast-enhanced magnetic resonance angiography is equal to contrast-enhanced multislice computed tomography for correct aortic sizing before trans-catheter aortic valve implantation. Clin Res Cardiol 2016;105:273–8. [PubMed] DOI:10.1007/s00392-015-0920-6
- Heye T, Davenport MS, Horvath JJ, et al. Reproducibility of dynamic contrast-enhanced MR imaging. Part I. Perfusion characteristics in the female pelvis by using multiple computer-aided diagnosis perfusion analysis solutions. Radiology 2013;266:801–11. [PubMed] DOI:10.1148/radiol.12120278