
Utility of CT in differentiating liver metastases of well-differentiated gastroenteropancreatic neuroendocrine neoplasms from poorly-differentiated neuroendocrine neoplasms
Introduction
Neuroendocrine neoplasms (NENs) are a heterogeneous group of tumors most commonly found in the gastroenteropancreatic (GEP) system. Due to their rarity, tumor heterogeneity, nonspecific clinical symptoms and indolent behavior, GEP-NENs commonly present with metastases at initial diagnosis with the liver being the most common site (1-3). For GEP-NEN patients with liver metastases (LMs), the difference in pathologic grade results in a different prognosis and a different therapeutic strategy (4,5). To stratify patients into risk categories for appropriate therapy, the World Health Organization (WHO) revised the classification in 2010 (6), and GEP-NENs are classified into well-differentiated tumors (Grade 1 and Grade 2) and poorly-differentiated tumors (Grade 3). In patients with well-differentiated GEP-NENs, surgical treatment represents the first choice for resectable LMs, while other therapies, such as local and regional techniques, percutaneous angiographic techniques, somatostatin receptor mediated therapy and peptide receptor radionuclide therapy, may represent an alternative in patients with unresectable tumors. For patients with LMs of poorly-differentiated GEP-NENs, systemic chemotherapy is commonly used as the first-line therapy (4,5,7,8). Therefore, it is clinically useful to distinguish between well-differentiated and poorly-differentiated GEP-NENs with LMs.
Conventionally, the role of computed tomography (CT) in the evaluation of GEP-NENs is to help determine the primary site and metastases (8-10). Due to the excellent spatial and time resolution of multi-detector CT (MDCT), it is possible to obtain information on tumor characteristics related to pathologic grades. Recent studies have reported that specific CT features can help to differentiate poorly-differentiated gastric NENs from well-differentiated NENs, and are useful in the pathological classification of pancreatic NENs (11-14). However, to the best of our knowledge, no published studies have yet focused on comparing the CT features of the LMs of well- and poorly-differentiated GEP-NENs.
In this study, we retrospectively analyzed and compared CT features of LMs between well- and poorly-differentiated GEP-NENs, with the aim of determining the capability of dynamic enhanced CT for differentiating LMs of well-differentiated from poorly-differentiated GEP-NENs.
Materials and methods
Study design
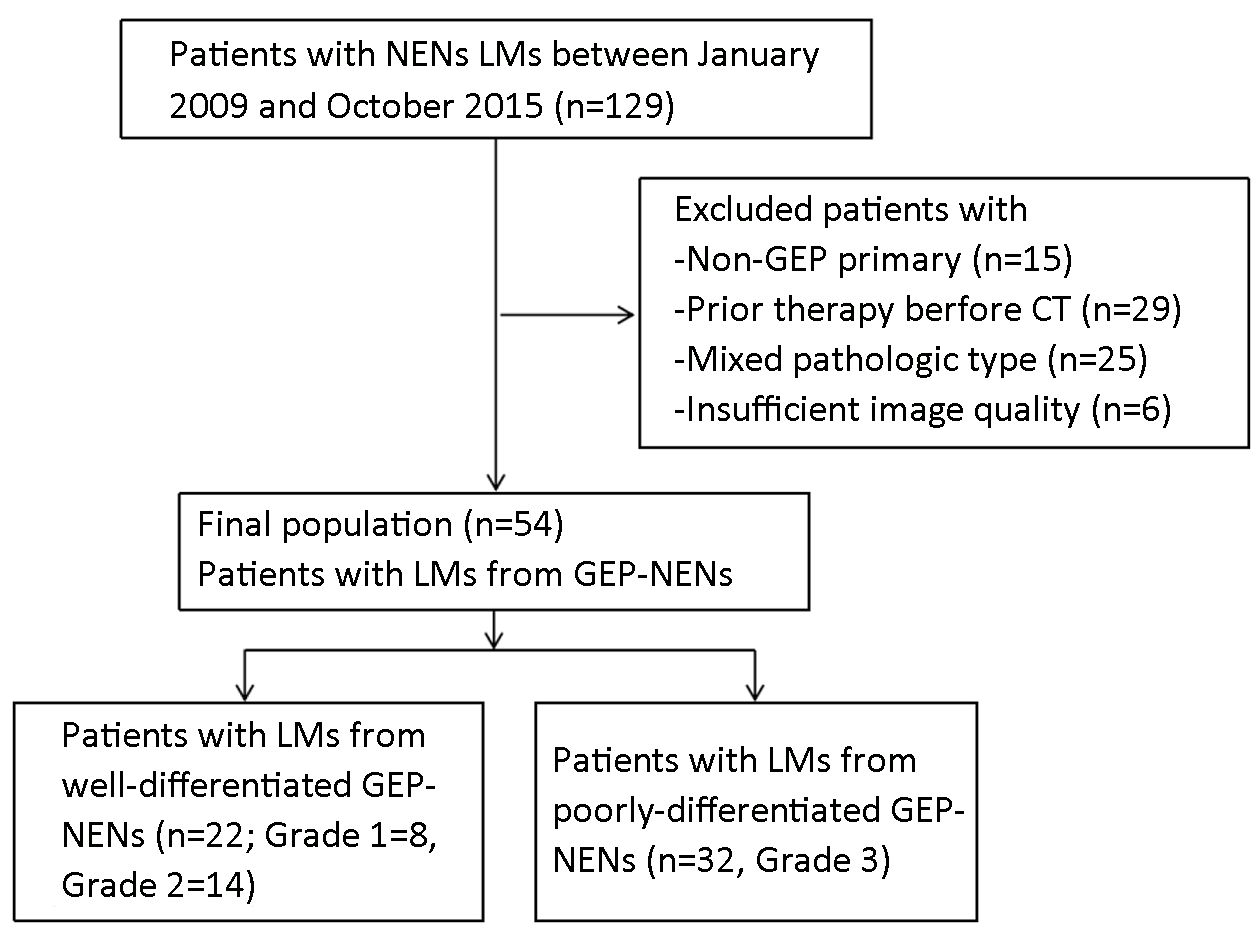
This retrospective study was approved by the Institutional Review Board of Peking University Cancer Hospital, and patient informed consent was waived due to its retrospective design. Between January 2009 and October 2015, patients with pathologically proven LMs of NENs who underwent CT examination were reviewed in Peking University Cancer Hospital. We included patients who satisfied the following inclusion criteria: 1) pathologic diagnosis of NENs either by surgery or biopsy; 2) LMs were confirmed pathologically or clinically [by a multi-modality approach such as magnetic resonance imaging (MRI), somatostatin receptor scintigraphy (SSRS) or Gallium-68 (68Ga) positron emission tomography (PET)/CT, or by a combination of CT findings and consecutive study results determined by the consensus of two radiologists (SY Gao and Y Cui, both with 15 years of experience in abdominal CT)]; and 3) available unenhanced and contrast-enhanced CT images (both in the hepatic arterial phase and portal venous phase) in the immediate prepathologic period (within 4 weeks of surgery or biopsy). We excluded patients whose primary tumor was not a GEP tumor, those who had undergone previous treatment, insufficient image quality and those with tumors composed of more than one pathological cell type such as mixed adenoneuroendocrine carcinoma. Image quality was analyzed by two radiologists (SY Gao and Y Cui, both with 15 years of experience in abdominal CT). The evaluation was performed using a five-point scale, where a standard hepatic arterial phase image should have obvious enhancement of hepatic arteries, mild enhancement of portal veins and no enhancement of hepatic veins and slight enhancement of liver parenchyma. Images meeting all of these criteria were rated 5 points, those meeting 3 criteria were rated 4 points, and those meeting less than 2 criteria were rated less than 4 points. We excluded cases rated less than 4 points to reduce the phase disagreement among cases.
CT techniques
CT images were obtained using a 64-MDCT scanner (Lightspeed VCT or Discovery 750HD, GE Healthcare, Milwaukee, USA) or a 256-MDCT (Brilliance iCT, Philips Healthcare, Cleveland, USA). Scanning parameters were as follows: slice thickness of 5 mm, slice interval of 5 mm, tube voltage of 120 kVp, automatic tube current modulation, and a tube rotation time of 0.50–0.75 s. The scanning range was from the diaphragmatic dome to the iliac crest. The patients fasted for at least 6 h before the examination. After the initial non-enhanced scan, nonionic iodinated contrast medium (Iopromide, Ultravist 300, Schering, Berlin, Germany; or Iohexol, Omnipaque 300, Nycomed, Princeton, USA) was administered intravenously via an 18-gauge angiographic catheter into the antecubital vein at a rate of 600 mg iodine/kg body weight using an automatic power injector (3 mL/s). Contrast-enhanced CT scans were performed in the hepatic arterial phase (25–30 s), portal venous phase (70–80 s) and the equilibrium phase (150 s) after intravenous injection of contrast agent.
CT image and pathological analysis
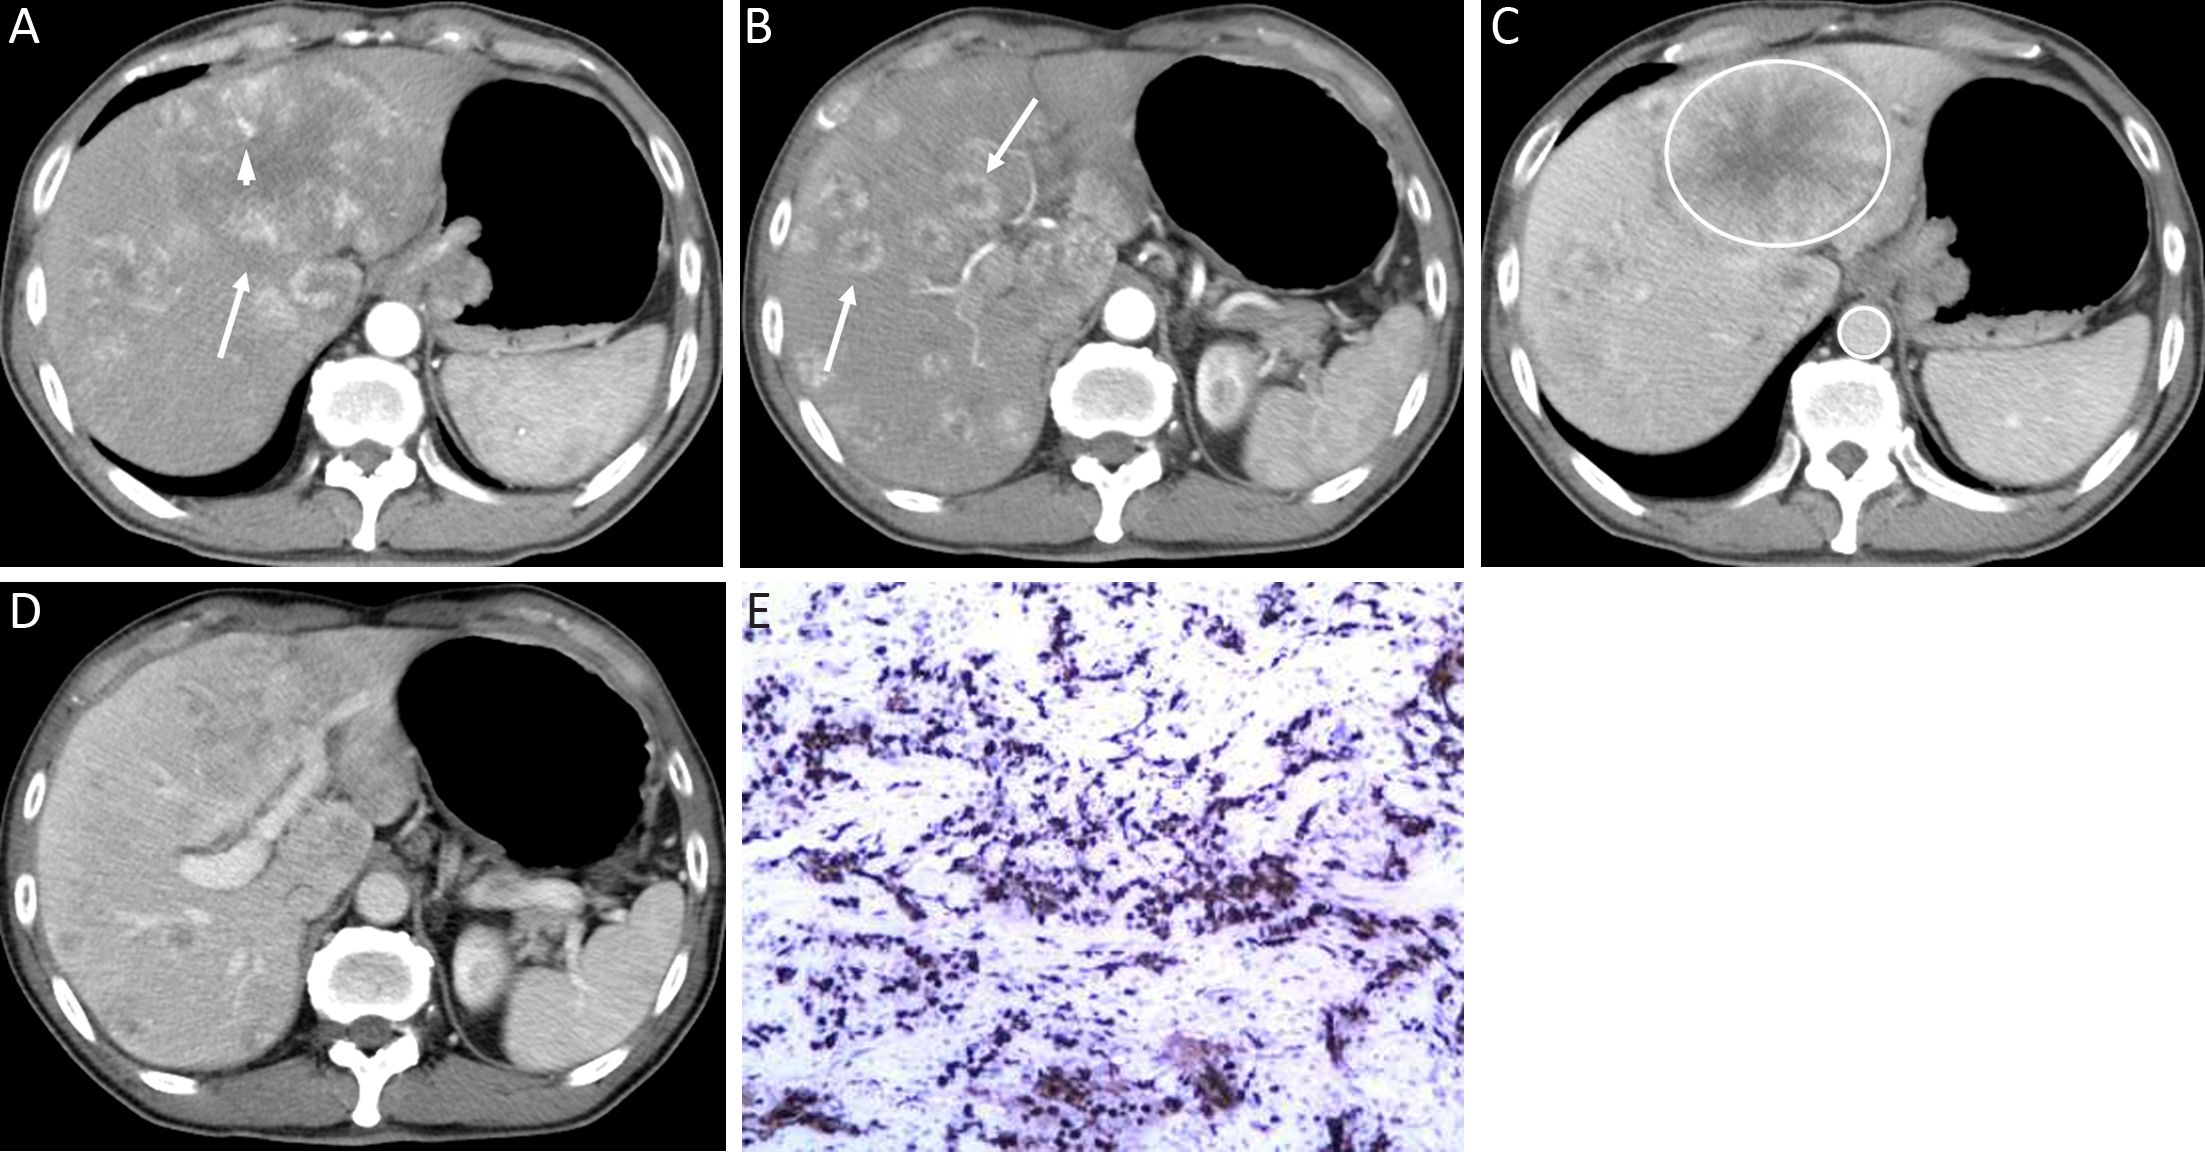
All qualitative imaging analyses were performed by two radiologists (SY Gao and Y Cui, both with 15 years of experience in abdominal CT). The reviewers knew that all images were from GEP-NENs patients, but had no knowledge of pathological grade in each case as the images were presented anonymously. First, the two radiologists reviewed all CT images in consensus to identify tumors and imaging features. Discrepancies between the readers were resolved by consensus after joint reevaluation of the images. The imaging features were analyzed as follows: distribution of tumor location (focal, confined to one liver lobe or two adjacent segments; diffuse, multifocal LMs); tumor shape (round-oval or irregular); presence/absence of feeding arteries (dilated, irregular arteries supplying the tumor) and intratumoral neovascularity (presence of irregular arteries in the tumor); enhancement area in the hepatic arterial phase (peripheral enhancement, the periphery of the mass enhanced to a greater degree than normal liver; diffuse enhancement, both the center and periphery of the mass enhanced to a greater degree than normal liver); dynamic enhancement (plateau, progressive enhancement or washout pattern); and presence/absence of lymphadenopathy (short-axis dimension of lymph node greater than 10 mm) was also evaluated.
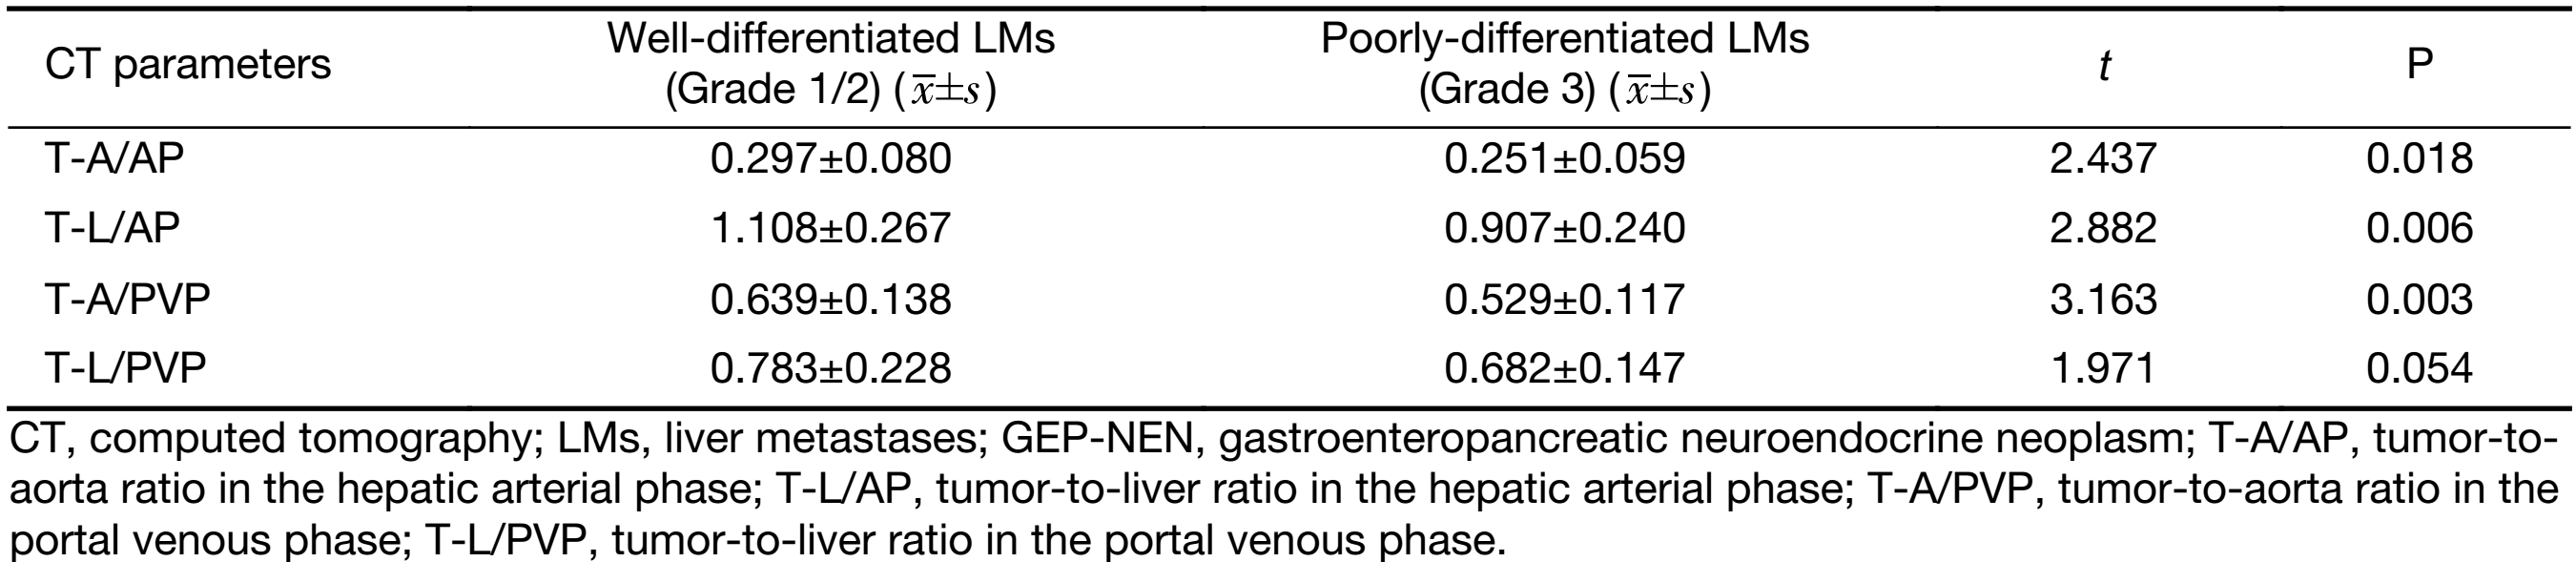
Then, one of the radiologists (Y Cui, with 15 years of experience in abdominal CT) processed quantitative analysis by using workstation software (Advantage Windows 4.0; GE Medical System, Milwaukee, USA). The tumor size (the maximum diameter of the largest LMs in each patient) and tumor number (counted if less than 20, or defined as uncountable) in all patients on CT were measured. The CT values of the tumors, liver parenchyma, and aorta were measured using a circular region of interest (ROI), including the maximal possible tumor activity in the slice with maximum tumor level, and excluding blood vessels and necrotic tissue. The same-sized ROIs were placed on all the scanning phases by copying the ROI from one image to another. The following parameters were calculated to reflect the blood supply of LMs: tumor-to-aorta ratio [T-A=(Tumor-Aorta)/Aorta], and tumor-to-liver ratio [T-L=(Tumor-Liver)/Liver] in the hepatic arterial phase (T-A/AP, T-L/AP) and portal venous phase (T-A/PVP, T-L/PVP).
The pathological diagnosis was re-reviewed by a pathologist (ZW Li) with 10 years of experience in gastrointestinal pathology. The NENs in this study were sub-categorized into three main categories based on the WHO classification system of 2010 (6).
Statistical analysis
Continuous variables were compared between groups with the independent t-test or non-parametric test (abnormal distribution), and categorical variables were compared with the χ2 test or Fisher’s exact test. Independent factors for discrimination were evaluated using the multivariate logistic regression model. The multivariate model was internally validated using bootstrapping (300 replications). The discriminatory performance of the constructed multivariate model was obtained using receiver operating characteristic curve (ROC), and the area under ROC (AUC) was calculated. The optimal cutoff values were chosen according to the maximum Youden’s index. Inter-observer agreement was analyzed using the Kappa coefficient (κ). A Kappa coefficient of 0.81–1.00, 0.61–0.80, 0.41–0.60, 0.21–0.40 and 0.00–0.20 indicated almost perfect agreement, substantial, moderate, fair, and poor or no agreement, respectively (15). A two-tailed P value of 0.05 or less was considered statistically significant in all analyses. All statistical analyses were performed using IBM SPSS Statistics (Version 22.0; IBM Corp., New York, USA).
Results
Clinical characteristics
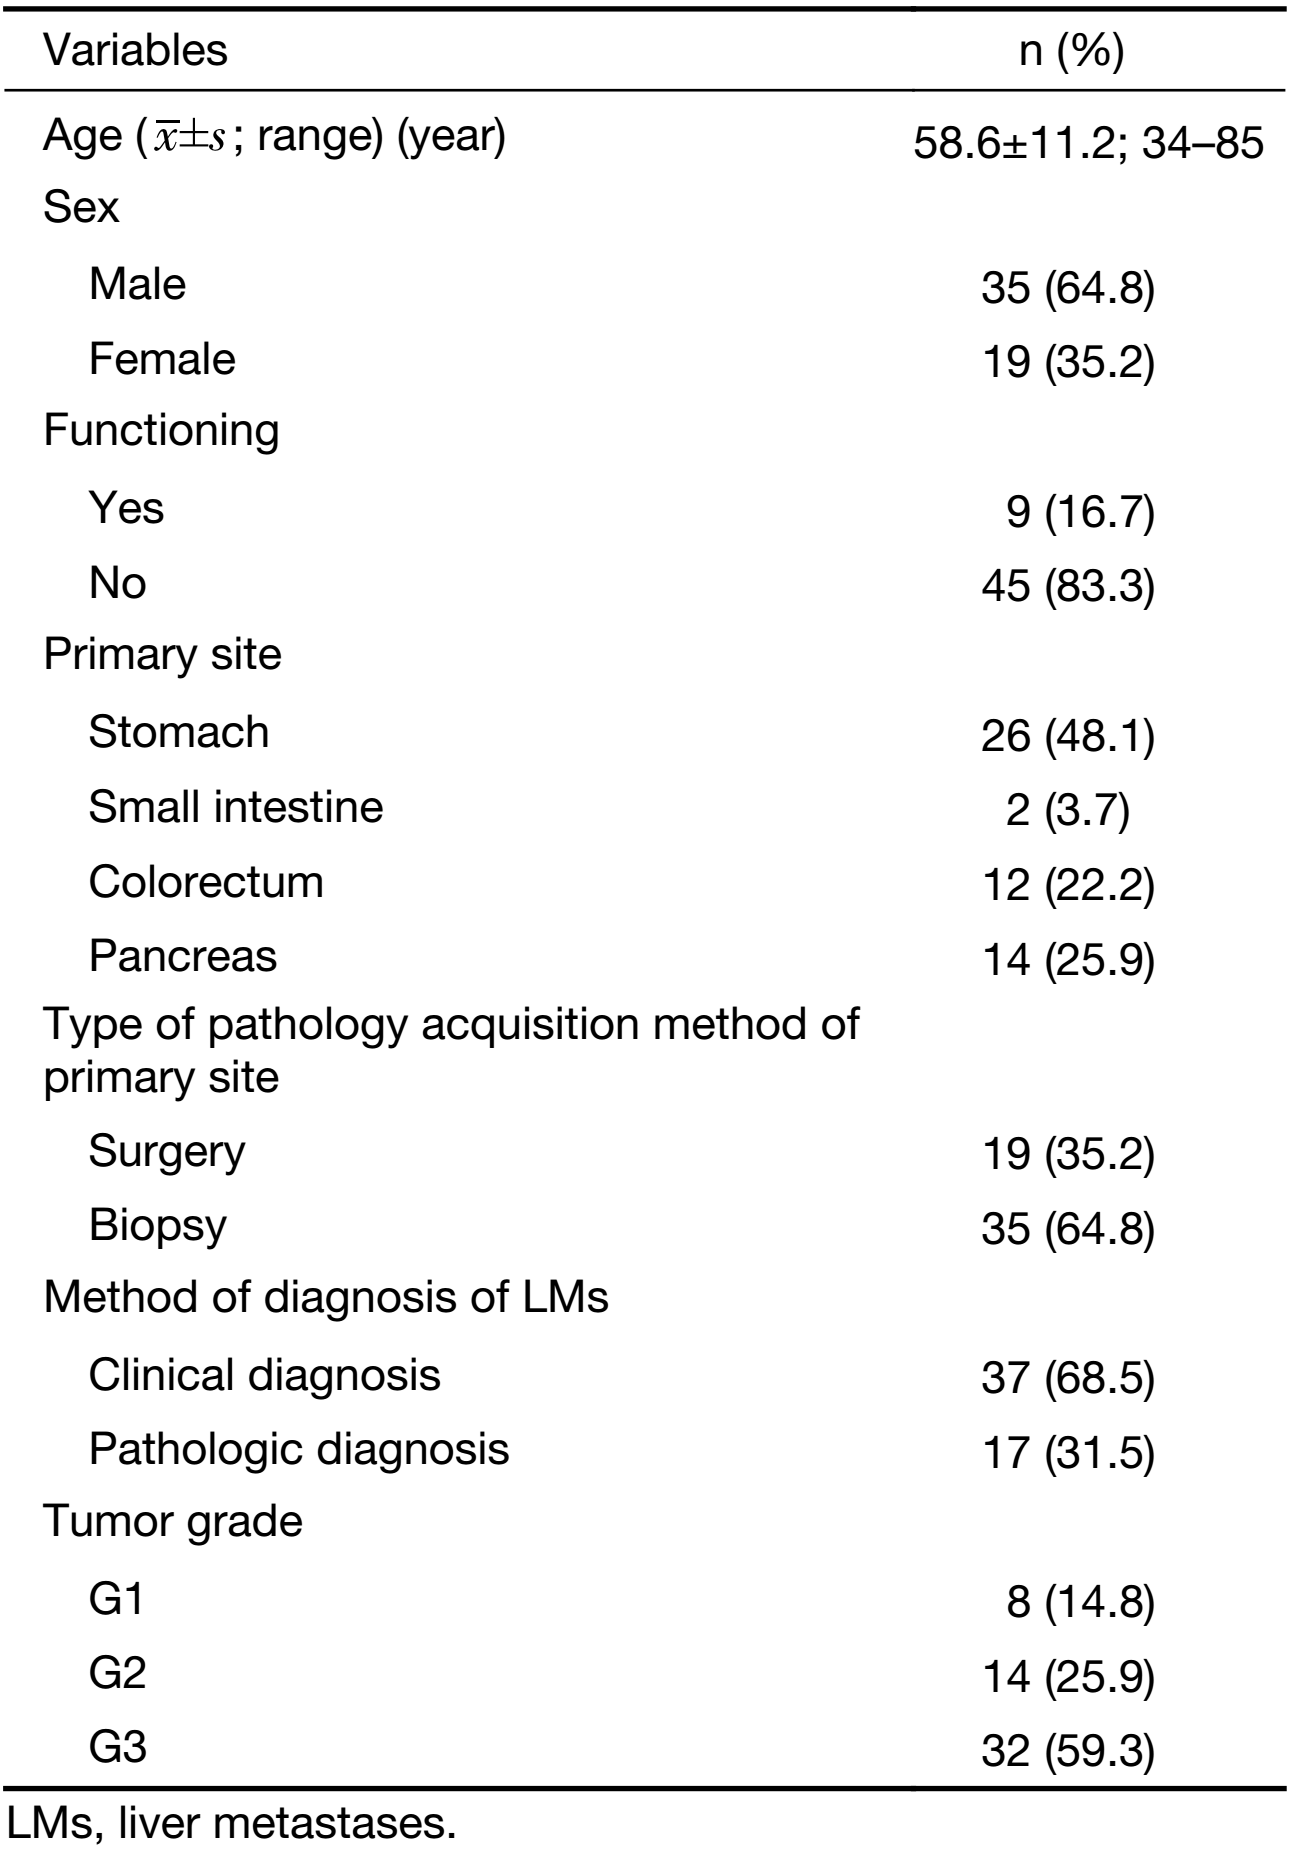
A total of 129 patients with pathologically proven NEN LMs who had undergone CT examination were identified in Peking University Cancer Hospital during the study period. Of these patients, 54 fulfilled the inclusion criteria and were enrolled in the study (Figure 1). The clinical characteristics of the patients are listed in Table 1.
Full table
Difference of CT features between LMs of well-differentiated and poorly-differentiated GEP-NENs
The mean tumor size of LMs of poorly-differentiated GEP-NENs (55.97±39.46 mm) was similar to that of the LMs of well-differentiated GEP-NENs (45.32±42.19 mm), without statistical significance (t=–0.948, P=0.348). There was no significant difference in tumor number between the two groups (LMs of well-differentiated GEP-NENs: 13.55±9.78; LMs of poorly-differentiated GEP-NENs: 14.69±9.91, Z=–0.429, P=0.668).
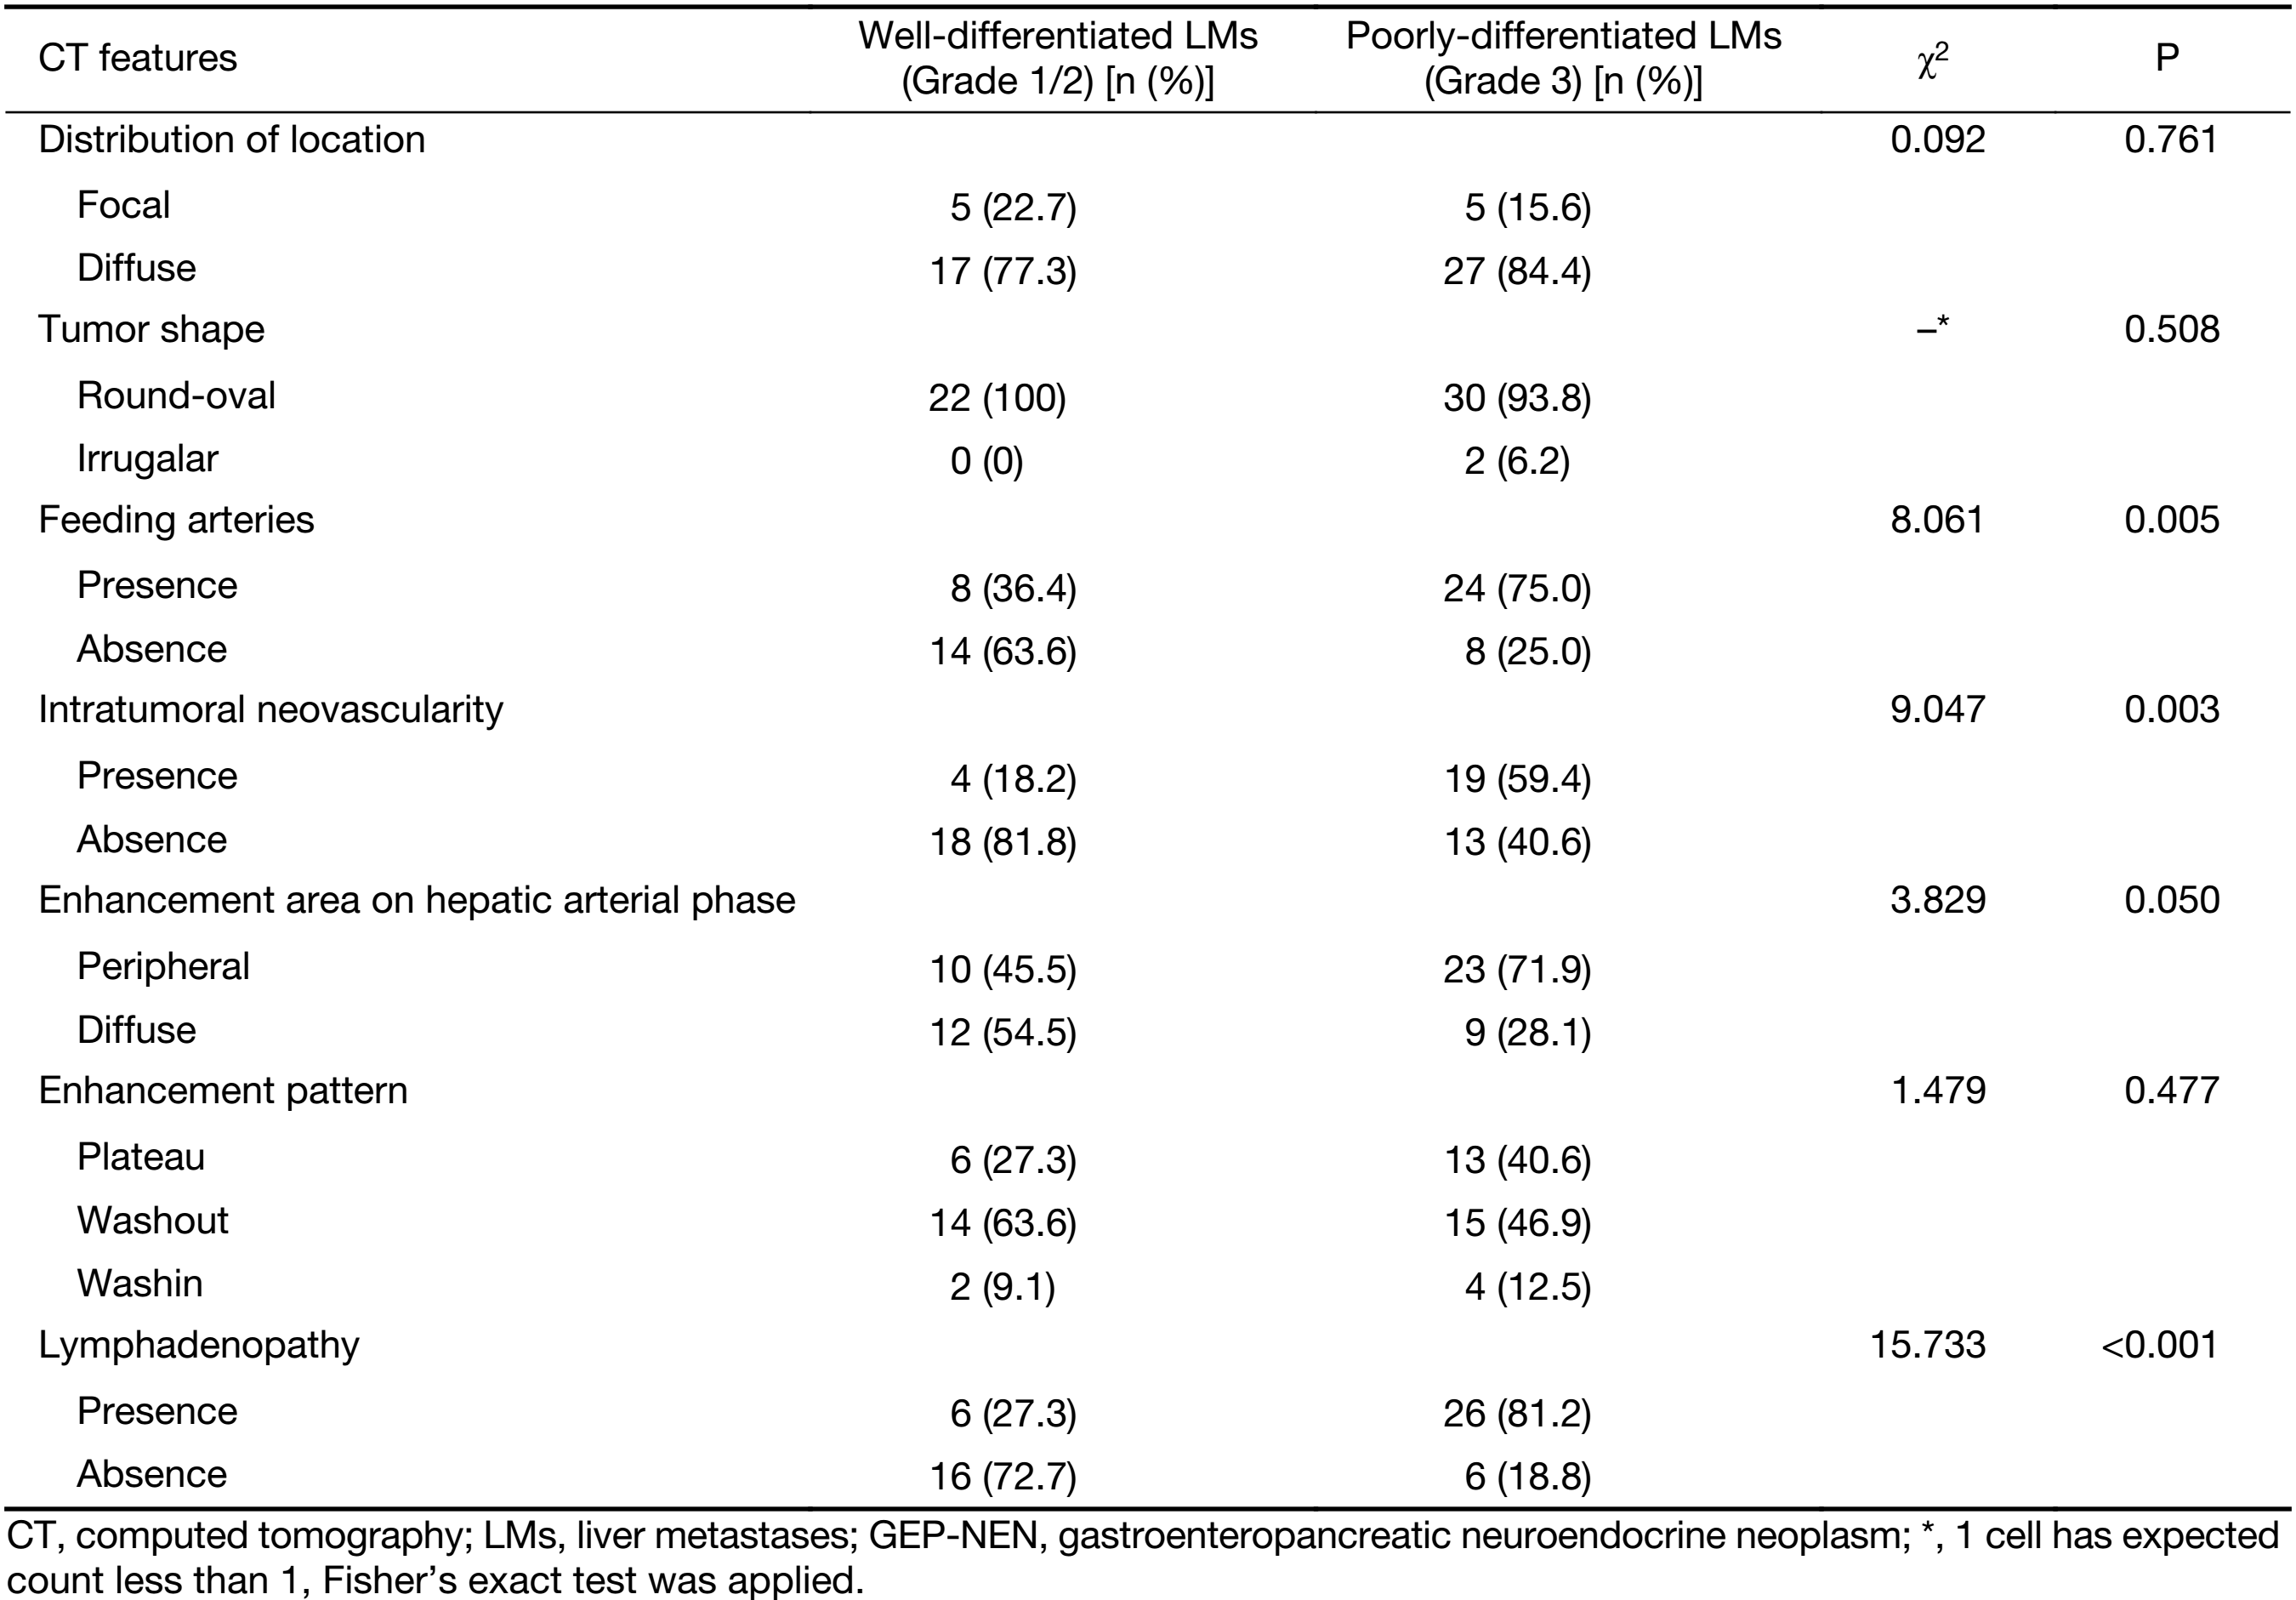
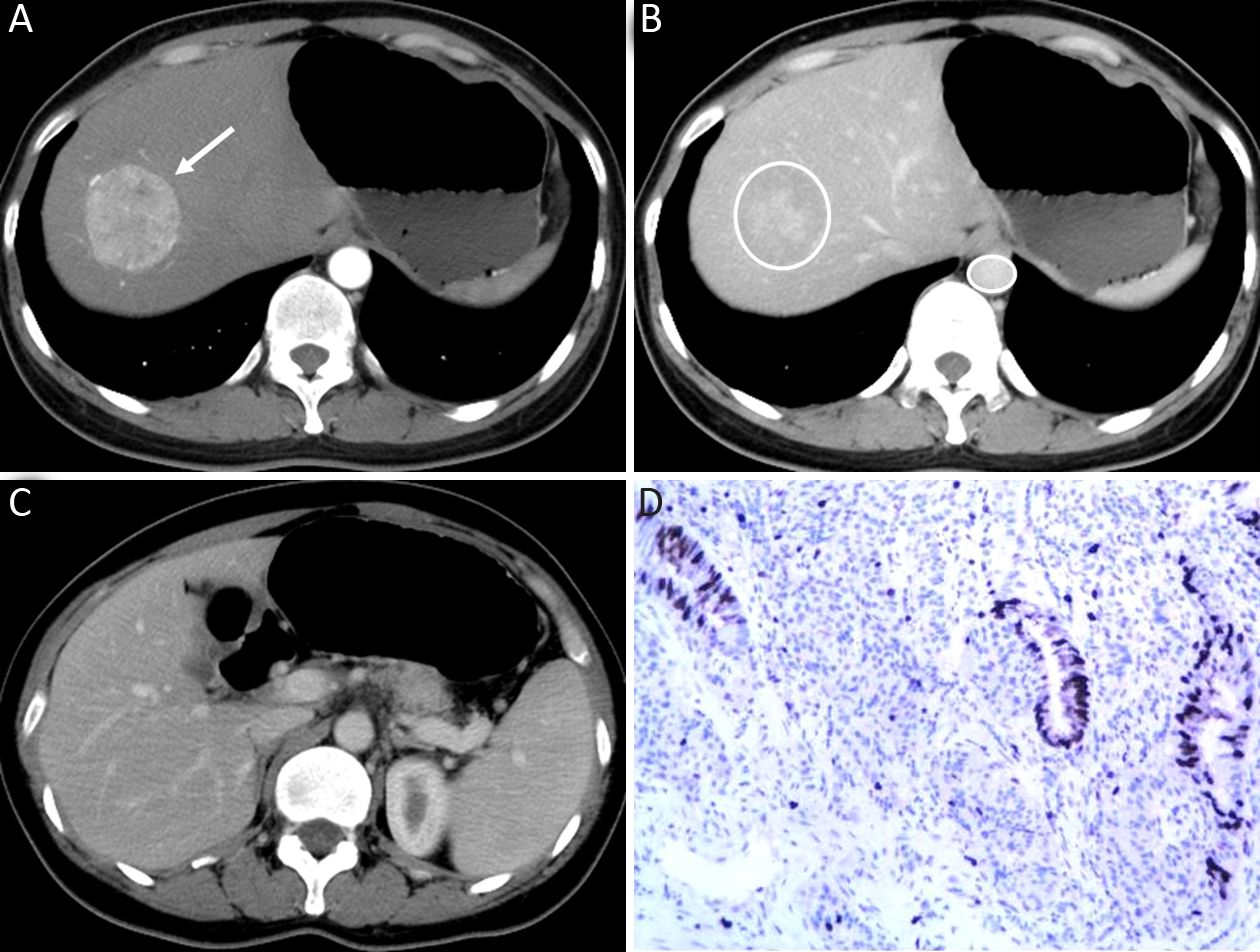
The qualitative image analyses of LMs of well- and poorly-differentiated GEP-NENs are summarized in Table 2. The distribution and shape of tumors were not significantly different between the two groups (P=0.761 and 0.508). All the LMs of GEP-NENs were mainly diffused with a round-oval shape. More feeding arteries and intratumoral neovascularity were found in LMs of poorly-differentiated GEP-NENs than in LMs of well-differentiated GEP-NENs (P=0.005 and 0.003). With regard to the enhancement area, there was no significant difference (P=0.050), and the enhancement pattern was not significantly different (P=0.477). Lymphadenopathy was statistically significant in differentiating LMs of well-differentiated GEP-NENs from poorly-differentiated GEP-NENs (P<0.001), with lymphadenopathy occurring more often in poorly-differentiated GEP-NENs. Representative cases are shown in Figures 2 and 3.
Full table
The inter-observer agreement of qualitative image analyses between the two readers was substantial to perfect for all CT features (κ=0.877 for distribution, κ=0.791 for shape, κ=0.776 for feeding arteries, κ=0.645 for intratumoral neovascularity, κ=0.844 for enhancement area in the hepatic arterial phase, κ=0.762 for enhancement pattern, and κ=1.000 for lymphadenopathy).
Difference of quantitative CT parameters between LMs of well-differentiated and poorly-differentiated GEP-NENs
The quantitative CT parameters are shown in Table 3. LMs of well-differentiated GEP-NENs were more enhanced than those of poorly-differentiated GEP-NENs. T-A/AP, T-L/AP, and T-A/PVP were significantly higher in LMs of well-differentiated GEP-NENs (all P<0.05) shown by the t-test. Only T-L/PVP was not significantly different between the two groups (P=0.054).
Full table
Screening independent factors for differentiation
The imaging features which were significantly or nearly significantly different between the two groups (feeding arteries, intratumoral neovascularity, and enhancement area in the hepatic arterial phase, lymphadenopathy, T-A/AP, T-L/AP, and T-A/PVP) were included in binary logistic regression. Logistic regression showed that intratumoral neovascularity (P=0.015, OR=0.108, 95% CI, 0.018–0.646), lymphadenopathy (P=0.001, OR=0.055, 95% CI, 0.009–0.323) and T-A/PVP (P=0.004, OR=5.3E–5, 95% CI, 0.000–0.044) were independent factors for differentiation. When bootstrapping was performed to check the model validity, intratumoral neovascularity, lymphadenopathy and T-A/PVP were still statistically significant factors for differentiation (P=0.007, 0.003 and 0.007, respectively). These three CT features were used to construct the predictive equation as follows: Y = 13.937 – 2.228 × Intratumoral neovascularity – 2.908 × Lymphadenopathy – 9.846 × T-A/PVP.
Diagnostic performance of CT for differentiation
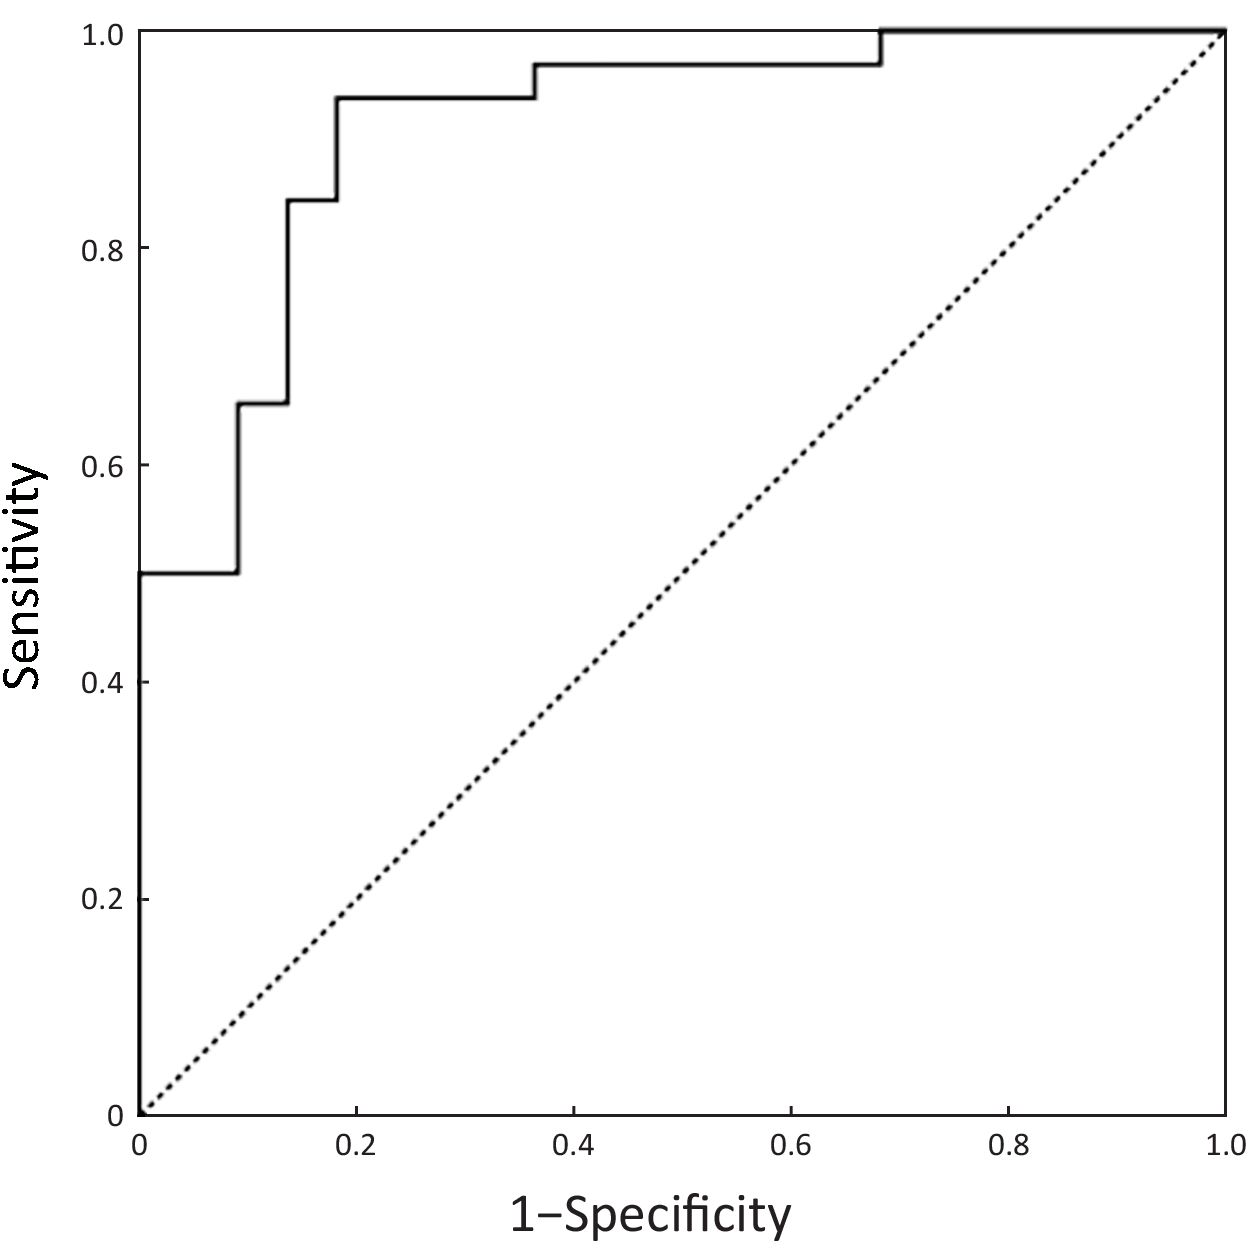
ROC curves of the predictive equation for differential diagnosis are shown in Figure 4. The AUC was 0.911 (95% CI, 0.831–0.990, P<0.001). The larger Y value represented the higher probability of poorly-differentiated GEP-NENs. A cut-off point of –0.21 was determined and patients with Y>–0.21 were judged to have CT-predicted poorly-differentiated GEP-NENs. The sensitivity, specificity, positive predictive value, negative predictive value and accuracy for predicting poorly-differentiated GEP-NENs were 93.8% (30/32), 81.8% (18/22), 88.2% (30/34), 90.0% (18/20) and 88.9% (48/54), respectively.
Discussion
The use of dynamic enhanced CT has been described as being helpful in differentiating tumor pathologic grade in GEP-NENs. Some studies of pancreatic NENs have shown that well-differentiated tumors are more vascularized than poorly-differentiated tumors on enhanced CT (16-18). In our study, a higher degree of enhancement was found in LMs of well-differentiated GEP-NENs both in the hepatic arterial and portal venous phases compared to poorly-differentiated GEP-NENs. In contrast, a MRI study (19) showed a higher degree of early hepatic arterial enhancement in Grade 2 and 3 LMs vs. Grade 1 LMs. This discrepancy may be partly due to different study populations (primary site of GEP vs. whole body) and different grouping methods (Grade 1 and 2 to Grade 3 vs. Grade 1 to Grade 2 and 3). Further study may be required to investigate the relationship between dynamic enhanced CT quantitative parameters and pathologic grading of NEN LMs from a single primary site.
In this study, LMs of poorly-differentiated GEP-NENs showed more feeding arteries and intratumoral neovascularity than LMs of well-differentiated GEP-NENs. Similar results have not been reported in previous studies. A possible explanation for the higher incidence of feeding arteries and intratumoral vessels in LMs of poorly-differentiated GEP-NENs could be that those vessels may represent both an increase in the number and dilation of the vascular architecture, and may correlate with the high proliferation rate of the tumor, which grows rapidly and thus requires more blood supply (20). The relationship between the growth and presence of vessels within and surrounding LMs was reported in an experimental study (21). The results showed that, in a murine model, larger LMs had large vessels surrounding and within the lesions in the late growth stage of NEN LMs. Our results may indicate that the existence of tumor vessels in LMs of GEP-NENs also correlate with pathologic classification.
We found that lymphadenopathy was present in 81.2% of patients with poorly-differentiated GEP-NENs, compared with 27.3% of patients with well-differentiated GEP-NENs. These results were similar to those in the study by Kim et al. (11), which showed that the majority of poorly-differentiated gastric NENs had metastatic lymph nodes (94.4%) while metastatic lymph nodes were noted in 22.2% of patients with well-differentiated gastric NENs. In another study by Kim et al. (22), poorly-differentiated NENs of the gallbladder showed larger lymph node metastases than adenocarcinoma (4.62 cm vs. 2.41 cm). The increasing presence of lymphadenopathy also demonstrates that the biologic behavior of poorly-differentiated NENs is highly aggressive, whereas the behavior of well-differentiated NENs is often indolent. Our results are in line with these results as lymphadenopathy was one of the predictors for LMs of poorly-differentiated GEP-NENs in our study [Exp(B)=2.908].
The distinction between LMs of poorly-differentiated NENs and LMs of well-differentiated NENs is one of the most important diagnostic steps with regard to significant differences in biologic behavior and therapeutic strategy between the two tumor categories. Our results showed that a lower T-A/PVP and the presence of intratumoral neovascularity and lymphadenopathy were more common in LMs of poorly-differentiated GEP-NENs (all P<0.05) and were also statistically significant factors for differentiating the two groups of tumors. Using the predictive equation which was constructed using the three independent discriminators, the diagnostic performance of CT for differentiating the two groups of tumors was 0.911 (AUC). This result indicated that CT was also useful in differentiating LMs with different pathologic grades, and may be helpful in selecting the most appropriate management strategy.
Our study had several limitations. First, this was a retrospective study, and several CT scanners were used, resulting in differences in some scanning parameters. However, all patients involved in this study had the same basic scan parameters, such as slice thickness, slice interval, tube voltage, and dose of contrast medium. Second, a fixed delay time instead of the monitoring trigger approach was applied in scan triggering. To limit this impact, we excluded cases whose image quality was insufficient to reduce the phase disagreement among cases. Furthermore, we used T-L and T-A ratio instead of CT values in the quantitative assessment, to further limit the phase disagreement among cases. Third, all the cases were from a cancer hospital, where patients may have larger LMs (approximately 5 cm). As the patients were consecutively enrolled according to the inclusion criteria, the results were reliable although they were possibly accurate for larger LMs. Fourth, we did not analyze differences in the LMs from different primary sites due to a limited number of patients. Our study applied rigid inclusion criteria and only included patients with untreated LMs, with a clear primary tumor and a single pathologic type. Although these criteria limited the number of patients enrolled, we consider that this is crucial because such factors may alter the appearance of the lesions. Our analysis did show that the value of CT features for determination of LMs of well- and poorly-differentiated GEP-NENs was meaningful. Multicenter and more cases enrollment should be incorporated in future studies.
Conclusions
We observed statistically significant differences in CT features between the LMs of well- and poorly-differentiated GEP-NENs. A lower T-A/PVP, and the presence of intratumoral neovascularity and lymphadenopathy can be helpful features in indicating LMs of poorly-differentiated GEP-NENs.
Acknowledgements
This study has received funding by the National Natural Science Foundation of China (No. 61520106004 and No. 81471640).
Footnote
Conflicts of Interest: The authors have no conflicts of interest to declare.
References
- Panzuto F, Nasoni S, Falconi M, et al. Prognostic factors and survival in endocrine tumor patients: comparison between gastrointestinal and pancreatic localization. Endocr Relat Cancer 2005;12:1083–92. [PubMed] DOI:10.1677/erc.1.01017
- Pavel M, Baudin E, Couvelard A, et al. ENETS Consensus Guidelines for the management of patients with liver and other distant metastases from neuroendocrine neoplasms of foregut, midgut, hindgut, and unknown primary. Neuroendocrinology 2012;95:157–76. [PubMed] DOI:10.1159/000335597
- Wang Z, Li W, Chen T, et al. Retrospective analysis of the clinicopathological characteristics of gastrointestinal neuroendocrine neoplasms. Exp Ther Med 2015;10:1084–88. [PubMed] DOI:10.3892/etm.2015.2634
- Delle Fave G, O’Toole D, Sundin A, et al. ENETS Consensus Guidelines Update for Gastroduodenal Neuroendocrine Neoplasms. Neuroendocrinology 2016;103:119–24. [PubMed] DOI:10.1159/000443168
- Frilling A, Clift AK. Therapeutic strategies for neuroendocrine liver metastases. Cancer 2015;121:1172–86. [PubMed] DOI:10.1002/cncr.28760
- Bosman FT, Carneiro F, Hruban RH, et al. WHO Classification of Tumours of the Digestive System. 4th edition. Lyon: IARC Press, 2010.
- Singh S, Asa SL, Dey C, et al. Diagnosis and management of gastrointestinal neuroendocrine tumors: An evidence-based Canadian consensus. Cancer Treat Rev 2016;47:32–45. [PubMed] DOI:10.1016/j.ctrv.2016.05.003
- Öberg K, Knigge U, Kwekkeboom D, et al. Neuroendocrine gastro-entero-pancreatic tumors: ESMO Clinical Practice Guidelines for diagnosis, treatment and follow-up. Ann Oncol 2012;23 Suppl 7:vii124-30. [PubMed] DOI:10.1093/annonc/mds295
- Sundin A, Vullierme MP, Kaltsas G, et al. ENETS Consensus Guidelines for the Standards of Care in Neuroendocrine Tumors: radiological examinations. Neuroendocrinology 2009;90:167–83. [PubMed] DOI:10.1159/000184855
- Ramage JK, Ahmed A, Ardill J, et al. Guidelines for the management of gastroenteropancreatic neuroendocrine (including carcinoid) tumours (NETs). Gut 2012;61:6–32. [PubMed] DOI:10.1136/gutjnl-2011-300831
- Kim SH, Kim SH, Kim MA, et al. CT differentiation of poorly-differentiated gastric neuroendocrine tumours from well-differentiated neuroendocrine tumours and gastric adenocarcinomas. Eur Radiol 2015;25:1946–57. [PubMed] DOI:10.1007/s00330-015-3600-z
- Luo Y, Dong Z, Chen J, et al. Pancreatic neuroendocrine tumours: correlation between MSCT features and pathological classification. Eur Radiol 2014;24:2945–52. [PubMed] DOI:10.1007/s00330-014-3317-4
- Belousova E, Karmazanovsky G, Kriger A, et al. Contrast-enhanced MDCT in patients with pancreatic neuroendocrine tumours: correlation with histological findings and diagnostic performance in differentiation between tumour grades. Clin Radiol 2017;72:150–58. [PubMed] DOI:10.1016/j.crad.2016.10.021
- Choi TW, Kim JH, Yu MH, et al. Pancreatic neuroendocrine tumor: prediction of the tumor grade using CT findings and computerized texture analysis. Acta Radiol 2017;284185117725367. [PubMed] DOI:10.1177/0284185117725367
- Landis JR, Koch GG. The measurement of observer agreement for categorical data. Biometrics 1977;33:159–74. [PubMed] DOI:10.2307/2529310
- d’Assignies G, Couvelard A, Bahrami S, et al. Pancreatic endocrine tumors: tumor blood flow assessed with perfusion CT reflects angiogenesis and correlates with prognostic factors. Radiology 2009;250:407–16. [PubMed] DOI:10.1148/radiol.2501080291
- Kim JH, Eun HW, Kim YJ, et al. Pancreatic neuroendocrine tumour (PNET): Staging accuracy of MDCT and its diagnostic performance for the differentiation of PNET with uncommon CT findings from pancreatic adenocarcinoma. Eur Radiol 2016;26:1338–47. [PubMed] DOI:10.1007/s00330-015-3941-7
- Rodallec M, Vilgrain V, Couvelard A, et al. Endocrine pancreatic tumours and helical CT: contrast enhancement is correlated with microvascular density, histoprognostic factors and survival. Pancreatology 2006;6:77–85. [PubMed] DOI:10.1159/000090026
- Besa C, Ward S, Cui Y, et al. Neuroendocrine liver metastases: Value of apparent diffusion coefficient and enhancement ratios for characterization of histopathologic grade. J Magn Reson Imaging 2016;44:1432–41. [PubMed] DOI:10.1002/jmri.25320
- Liu P, Zhu X, Li J, et al. Retrospective analysis of interventional treatment of hepatic metastasis from gastroenteropancreatic neuroendocrine tumors. Chin J Cancer Res 2017;29:581–6. [PubMed] DOI:10.21147/j.issn.1000-9604.2017.06.13
- Pourreyron C, Poncet G, Roche C, et al. The role of angiogenesis in endocrine liver metastases: an experimental study. J Surg Res 2008;144:64–73. [PubMed] DOI:10.1016/j.jss.2007.02.045
- Kim TH, Kim SH, Lee KB, et al. Outcome and CT differentiation of gallbladder neuroendocrine tumours from adenocarcinomas. Eur Radiol 2017;27:507–17. [PubMed] DOI:10.1007/s00330-016-4394-3