
Clinical laboratory and imaging evidence for effectiveness of agarose-agarose macrobeads containing stem-like cells derived from a mouse renal adenocarcinoma cell population (RMBs) in treatment-resistant, advanced metastatic colorectal cancer: Evaluation of a biological-systems approach to cancer therapy (U.S. FDA IND-BB 10091; NCT 02046174, NCT 01053013)
Introduction
Cancers of all types are increasingly recognized to comprise a highly heterogeneous, complex, and rapidly evolving biological systems disorder. Whereas previously, cancers tended to be thought of in terms of their anatomical origins, as well as specific surface antigens and intracellular targets (such as metabolism, DNA replication, and signaling pathways), it is now known from genomic studies that classification by specific gene markers and/or patterns, including the separation of driver and passenger genes, is more appropriate and meaningful (1). However, the reality is that a given cancer is defined by much more than the genomics. Although replication errors in stem-cell division have been argued to be the single largest contributor to carcinogenic mutations, the fact is that there are multiple levels of interaction and effects that regulate the genes expressed and drive tumor behavior, once established, in one or more directions, directions that themselves may change over time. These multiple levels of interaction include, but are not limited to, the epigenomic (2), intracellular metabolic shifts from aerobic to anaerobic metabolism (3), surface antigen expression (4), the highly dynamic microenvironment provided by the host and the interactions of both non-neoplastic and neoplastic cells, systemic metabolic and other states such as inflammation, and hormonal influences (5) whether specific, as in the case of estrogens, for example, or non-specific, as with adrenocortical steroids.
Two characteristics further complicate the biological-systems picture of cancer. These characteristics are: 1) intratumoral clonal heterogeneity, as well as clonal heterogeneity among the primary tumor and its metastases (6-9), and 2) the capacity of clonal neoplastic cells and heterogeneous tumors generally to evolve rapidly, whether by Darwinian or non-Darwinian evolution (10-12). The development of resistance to particular lines of anti-cancer therapy is well-known, and there is evidence demonstrating that such therapeutic agents can actually lead to the development of the resistance in a given clone (13) or allow inherently resistant clones to expand and continue to proliferate (9,11,14).
While precision therapy, as defined by specific genomic or other cellular targets, is promising in many ways (15), the challenges of the dynamic, albeit perhaps chaotic, biologic system that malignant neoplasia represents are likely to limit the effectiveness of such approaches in the long term (16).
The findings of the above studies and the evolving understanding of the nature of cancer that they have generated suggest that a multi-pronged and flexible biologic-systems approach could be an effective anti-oncologic therapy. What we report here is experience with one such approach, using the double-layer agarose, implantable macrobeads containing mouse renal adenocarcinoma RENCA cells (RMBs) developed in the Rogosin Institute (17,18). Specifically, we have evaluated the RMBs as an approach to therapy for treatment-resistant, advanced metastatic colorectal cancer (mCRC) in phase I and IIa open-label clinical trials.
Anti-oncologic therapies must ultimately be judged in terms of efficacy by the overall survival (OS), along with the quality of life, that they produce, both in a given patient and for the population of patients with mCRC and its subtypes. It is also important to establish the biological effect of any given therapy comparatively early in the course of the sequence of clinical trial investigations. We hypothesized that the data from our phase I and phase IIa clinical trials with the RMBs would demonstrate consistent biological effects in terms of specific tumor markers, volume and metabolic rate, as well as lactate dehydrogenase (LDH) and, furthermore, that these effects would correlate with and preliminarily be predictive of OS. The results of these exploratory studies in relation to that hypothesis are reported here.
Materials and methods
RENCA macrobeads
The RMBs have been developed and are produced at the Rogosin Institute, Xenia Division in Xenia, Ohio, USA. The full production details have been described in previous publications (17-19). The double-layered agarose bead is 6–8 mm in diameter and, at the outset of its production, contains approximately 150,000 RENCA cells in a single-cell suspension that is mixed with what is to become the inner layer of agarose. The outer layer of agarose provides structural integrity to the RMB and prevents the migration of the enmeshed tumor cells out of the bead (as well as limiting the diffusion of molecules in or out of the bead to <100 kD).
After production and prior to implantation, the RMBs are cultured in vitro in RPMI medium with 10% newborn calf serum for 6–16 weeks. During this period, approximately 99% of the original cells undergo apoptotic cell death, leaving a small number of scattered cells with stem-cell properties. This surviving 1% cell population forms colonies that are composed of the stem cells and their much more numerous daughter cells. The cells in the formed colonies undergo dramatic gene expression changes, the end results of which are downregulation of certain genes, including those associated with DNA replication, angiogenesis, metalloproteinase production, oncogenesis, and immune evasion, as well as upregulation of genes associated with apoptotic cell death [notably 100-fold upregulation of C/EBP homologous protein (CHOP) and growth arrest- and DNA damage-inducible gene 45 (GADD45)]. The RMBs with the changed gene expression patterns and formed colonies release protein and peptide factors into the medium in vitro that have a clear inhibitory effect on freely growing cancer cells outside the beads, as has already been described. The colonies appear to reach a steady state in which there is ongoing cell replication along with cell death.
When the colonies have fully formed and are in the stable state described in the preceding paragraph, they are prepared for laparoscopic implantation into the peritoneal cavity. To evaluate their metabolic health, a 3-(4,5-dimethylthiazol-2-yl)-2,5-diphenyltetrazolium bromide (MTT) assay is employed. RMBs are incubated for 3 h in 1 mg/mL MTT (Sigma-Aldrich, M5655) and absorbance read at 570 nm on a Bio-Tek Synergy 2 Plate Reader. Tumor growth inhibition is assessed in 6-well plates containing 15,000 RENCA cells per well using 4 mL fresh culture media or 5-d RMB-conditioned media. Following 5 days of culture, the cells are methanol-fixed and stained with 0.33% (w/v) neutral red (Sigma-Aldrich, N2889), and absorbance (Ab) is measured at 540 nm with a reference wavelength of 630 nm. Tumor inhibitory capacity is defined as the percent difference in Ab540 nm–630 nm between conditioned and fresh media. A minimum level of inhibition of 25% is required, but RMB lots are preferably in 30%–45% inhibition range.
Prior to RMB implantation, representative samples of qualified RMBs are sent for sterility testing per USP <71> and Ph. Eur. 2.6.1 via membrane filtration and additionally assessed for the presence of Mycoplasma using direct and indicator cell culture methods [USP <63> and Ph. Eur. 2.6.7 Mycoplasma Tests; Avista Pharma Solutions: Agawam, MA]. RMBs are also screened for the presence of bacterial endotoxins per USP <85> and Ph. Eur. 2.6.14. Microbiological testing (sterility, endotoxin and mycoplasma) is repeated 2–4 weeks prior to implantation, as well as 24 h prior to implantation.
It should be noted that the RENCA cells in the RMBs do contain an ecotropic variant of the murine leukemia virus (eMuLV). This virus is not known to infect human cells. However, to be certain of the safety of the RMBs in this respect, serum samples to detect the presence of eMuLV have been taken in all patients at baseline and at the d 30, 60 and 90 visits after each implantation to rule out the presence of this virus in any recipient of the RMBs. In the approximately 1,000 such samples to date, there has been no detection by polymerase chain reaction (PCR) (with probes developed specifically for this purpose) in any sample (Vitrology, Edinburgh, Scotland, UK). In addition, over the decade of RMB implantations, there has been no clinical evidence of viral transmission, nor infection, in the 104 patients treated to date.
Patient population
Patients reported here were adults (>18 years) with treatment-resistant (failed all available therapies), advanced adenocarcinoma of the colon or rectum from either the phase I or IIa clinical trials. The patients reported here had a median value of 4 prior chemotherapy regimens that included oxaliplatin, folinic acid, irinotecan, capecitabine, (alone or in combination as in FOLFIRI, FOLFOX, and CAPOX regimens), cetuximab, panitumumab, bevacizumab and aflibercept. The periods from their initial diagnosis of colorectal cancer to entry into the phase I and IIa RMB trials ranged from 12 months to 12 years (Table 1).
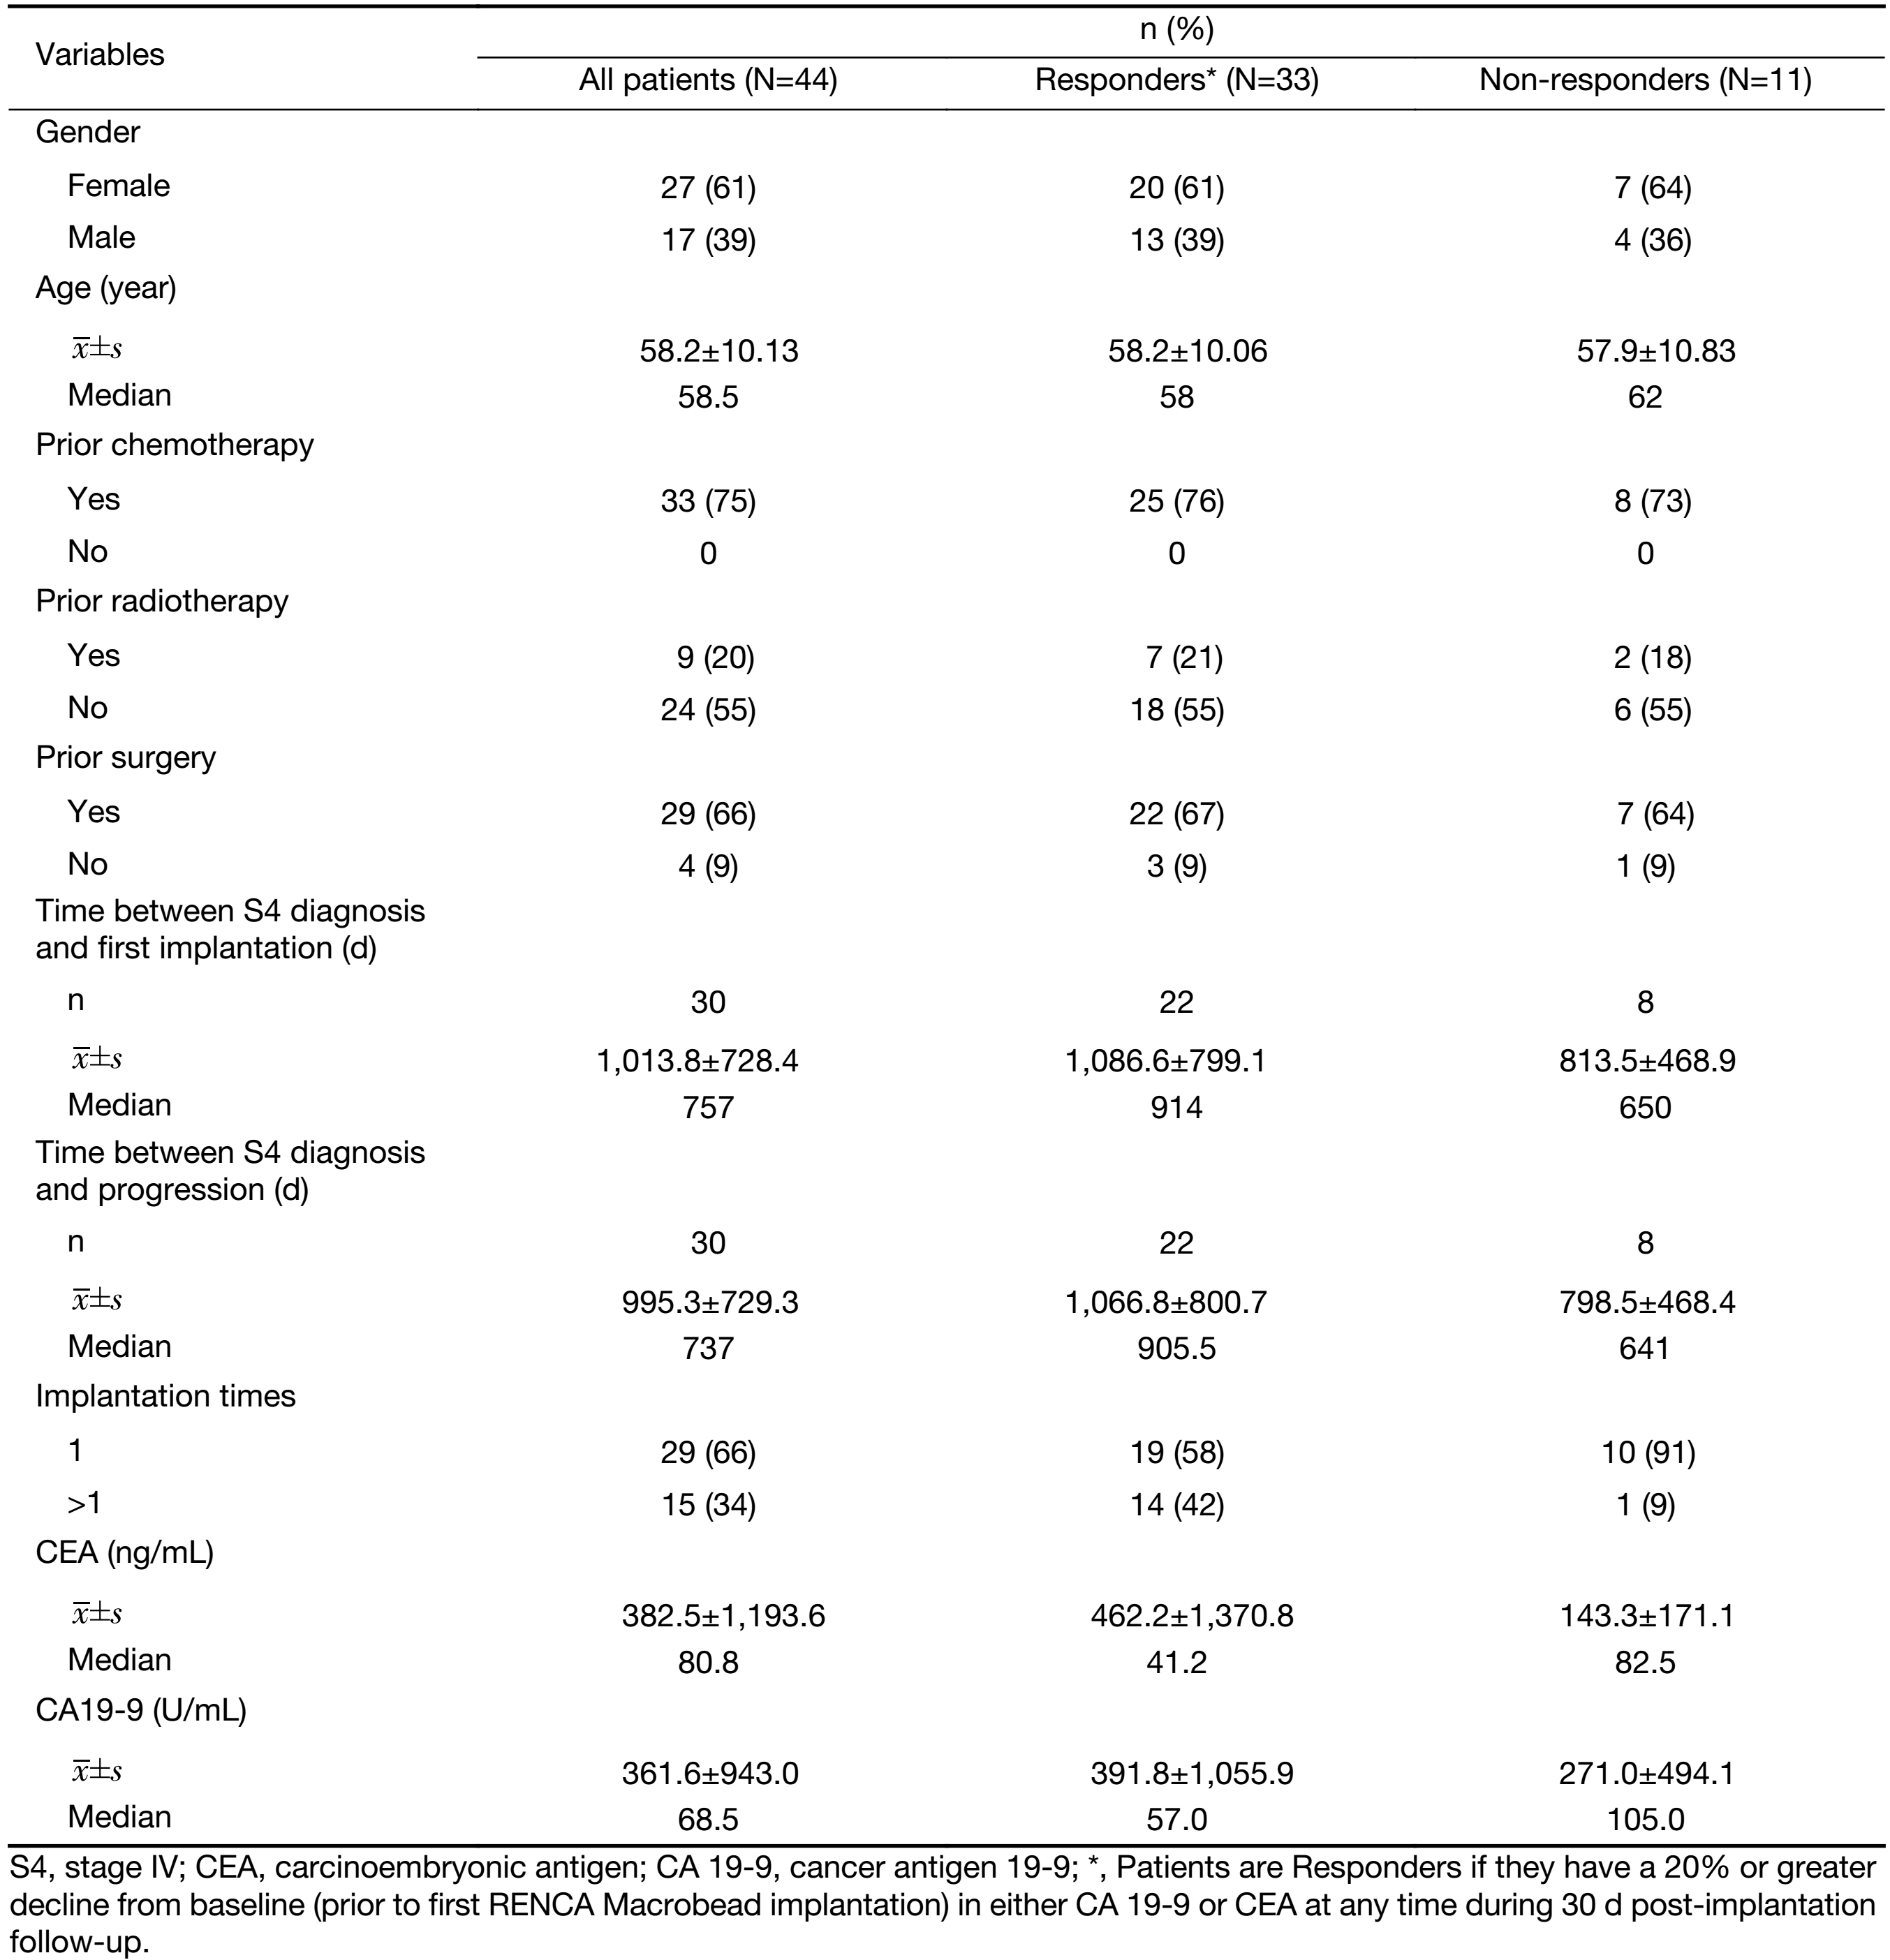
Full table
The RMB implantation requires patients to be under general anesthesia for abdominal muscle relaxation and distribution within the peritoneal space, therefore all patients had to be acceptable as surgical candidates. A likely life expectancy of at least 6 weeks on the basis of co-morbidity risks, number and sites of metastases, and ability to withstand general anesthesia were also required. An adequate functional scale rating (0–2 or equivalent on the Eastern Cooperative Oncology Group (ECOG) and/or Karnofsky scales), as well as adequate, hematologic, hepatic, renal and coagulation parameters was required. Disseminated peritoneal carcinomatosis was considered a contraindication to entry into the protocol and, specifically, the implantation procedure.
All eligibility criteria were assessed and informed consent obtained. Baseline testing, including physical examination, laboratory screening (metabolic profile, hematology, liver and renal function, LDH, inflammatory markers and selected cytokines), chest X-ray, electrocardiogram (ECG), positron emission tomography-computed tomography (PET-CT), and murine allergen testing, was performed within 30 d prior to RMB implantation. The study was approved by the Weill Cornell IRB and was conducted in accordance with the IRB policies, the principles of the Declaration of Helsinki and GCP guidelines (clinicaltrials.gov identifier: NCT02046174 and NCT01053013; U.S. FDA IND-BB 10091).
Treatment and follow-up visits
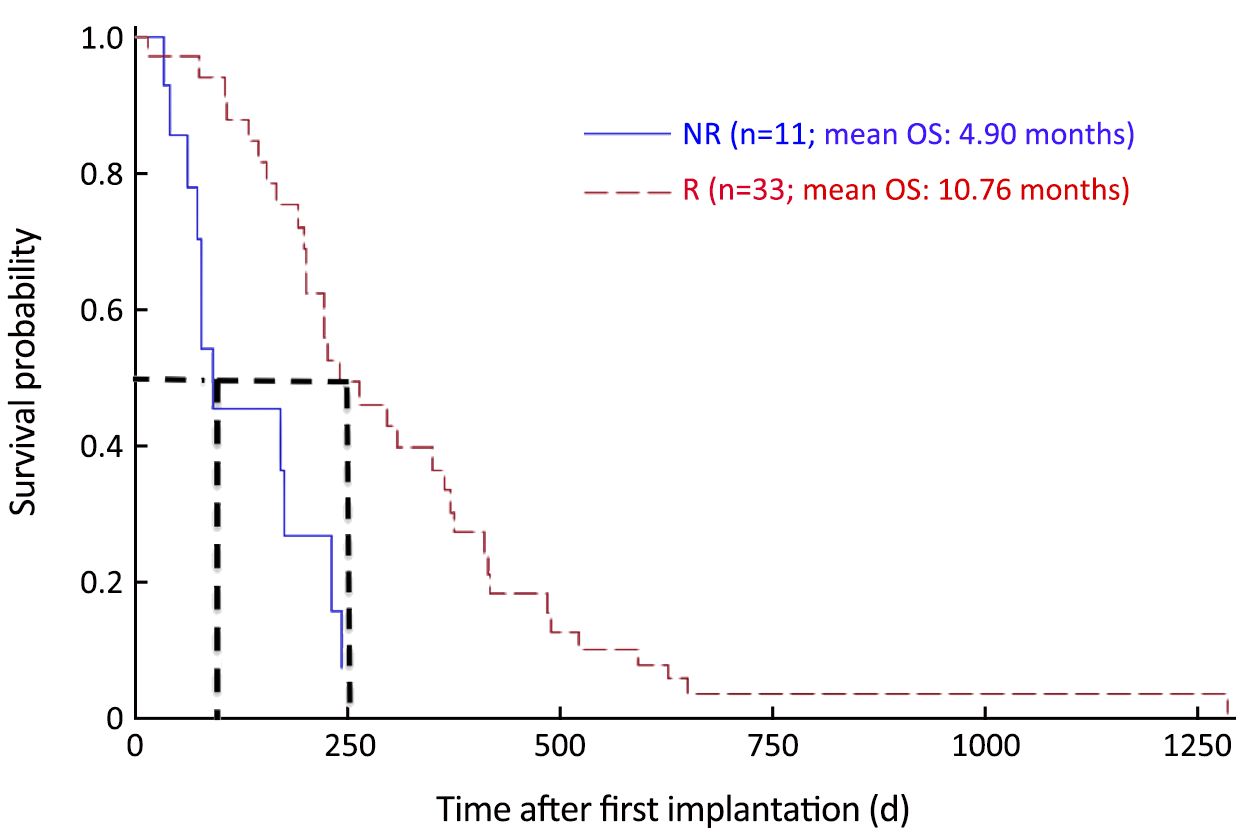
After the baseline testing (described above) was obtained, an outpatient laparoscopic surgical procedure under general anesthesia to implant the RMBs (8 RMB/kg body weight) was scheduled. All procedures for the phase I and IIa trials were performed in the operating suites of the NewYork-Presbyterian/Weill Cornell Medical Center, New York City, NY, USA. Total anesthesia time for the typical implant procedure was 60 min on average and patients were discharged to home after recovery. Patients were eligible by protocol for up to a total of four times. All patients were followed up after their last implantation to a survival endpoint (OS from point of entry into the RMB protocol), with intervals of no greater than every six months. Kaplan-Meier survival plots were constructed from this data (Figure 1).
Laboratory profiles
Laboratory testing for the purposes of this study focused on the following parameters; carcinoembryonic antigen (CEA) and cancer antigen 19-9 (CA 19-9) as tumor markers, total LDH as a metabolic and tissue damage marker, and maximum standard uptake value (SUVmax) of 18F-fluorodeoxyglucose (18F-FDG) on PET-CT scan. In addition, because of the laparoscopic surgical procedure and the implantation of a foreign body into the peritoneal cavity of the patients, as well as to better evaluate the systemic state of reaction to the mCRC, markers of inflammation C-reactive protein (CRP) and erythrocyte sedimentation rate (ESR) were also measured. CA-125, a marker usually used to follow ovarian cancer, was also checked as a marker because its level can indicate inflammation secondary to peritoneal irritation (20). Platelet counts were obtained and reviewed with specific reference to inflammation. Eosinphil counts provided a check for allergic or sensitization reactions to mouse antigens or the agarose of the RMBs themselves.
Tumor marker response was defined a priori as at least a 20% decrease from baseline in CA 19-9 and/or CEA levels within the first 30 d after each RMB implantation.
All laboratory testing was done by the NewYork-Presbyterian Hospital Laboratories or, in the case of some cytokine measurements by Rogosin’s own diagnostic laboratory or Quest Diagnostics.
Imaging techniques
Imaging evaluations of any primary and all secondary tumors using 18F-FDG PET-CT were performed in all patients at baseline and on d 90 post-implantation (Manhattan Diagnostic Radiology, New York, NY, USA). This technique was utilized to evaluate the number, location, size/volume, and metabolic activity of known tumors, as well as the appearance of new metastases. The PET scan was completed 1 h after the injection of 9.4 mCi of 18F-FDG. CT scan was used for the purpose of attenuation correction and anatomical localization. Because of the extensive chemotherapy history of these patients, radiographic contrast was not used for the CT portion of the imaging. Response Evaluation Criteria in Solid Tumors (RECIST) could not be applied to the images obtained, in part because contrast was not utilized in these studies.
Change in the size/volume ≥20% of primary or metastatic tumors was defined as either “increase” or “progression” or “decrease” dependent on the direction of change. Any change between 0 and 20% was defined as “stable”. A positive response post-implantation required a decrease of at least 20% in tumor size/volume. In addition, only lesions with a SUVmax ≥2.5 were evaluated. For the purposes of the evaluation reported here, only the baseline and day 90 scan after the first implantation were used.
Statistical analysis
The critical objectives of phase I were related to safety and toxicity, and in phase IIa, to efficacy. Multiple laboratory and clinical parameters were followed to enable determinations and analysis to be made. Given the study design of the phase I trial, simple population comparisons designed for small samples (non-normal distribution), as well as simple trend analysis for selected parameters, were undertaken. In both phase I and phase IIa studies, each subject served as his/her own control with measurements obtained and were evaluated for response. Each individual subject’s baseline established prior to the first implantation was used for the entire study. The 0.05 two-sided level was used to determine statistical significance. Patients were categorized into two groups: GROUP=1, if decrease in at least one of CEA or CA19-9 or both biomarkers from baseline to any time point up to d 30 visit post 1st implantation was at least 20% (Responders); otherwise patients were assigned to GROUP=0 (Non-responders).
Distribution was tested using the Shapiro-Wilk test; P values for biomarkers were determined using Mann-Whitney U test (Table 2). Time from stage IV diagnosis to death was analyzed using proportional hazards model, which was adjusted for the variables imbalances associated with baseline and survival. This model determined the risk reduction for biomarker Responders vs. Non-responders.
Full table
All data was analyzed for using SAS software (Version 9.1.3 SP4; SAS Institute Inc., Cary, NC, USA).
Results
A total of 69 mCRC patients provided informed consent to participate in the phase I and IIa open-label trials described here. Of these, 48 patients (30 females and 18 males) underwent RMB implantation and were evaluable. The mean age of the participants was 58.2 years. Thirty-five of the 48 patients were diagnosed with colon adenocarcinoma, and 10 patients with rectal adenocarcinoma. Other diagnoses included anal carcinoma (n=2) and appendiceal carcinoma (n=1). These latter patients were not included in the analysis reported here. Thirty of the 48 patients had a total of one implantation, 15 had a total of 2, 1 had a total of 3, and 2 had a total of 4 times. The data reported here evaluate “response” after only the first implantation, with survival from RMB implantation to death reported as a measure. Overall, the patients tolerated the RMB implantation well were observed to have stable or improved performance status after the first implantation, and reported good Quality of Life (QOL) scores.
Tumor markers
The response to the RMBs was marked by a prominent initial rise in CRP, ESR and interleukin-6 (IL-6), indicating a systemic inflammatory response (SIR) of variable intensity in 100% of patients. The systemic inflammatory reaction, including its accompanying fatigue, nausea, weight loss and decrease in appetite, as well as the expected CRP and IL-6 increases generally lasted 1–3 weeks. For the phase IIa patients, mean CRP values were as follows (Responders vs. Non-responders): baseline, 3.24±4.39 vs. 2.96±3.43 (t-test, P=0.86); d 14, 20.97±7.21 vs. 14.50±8.78 (t-test, P=0.04); and d 30, 8.21±5.43 vs. 10.76±6.92 (t-test, P=0.27). Mean changes in IL-6 (baseline, P=0.28; d 14, P=0.36; d 30, P=0.54) and tumor necrosis factor-α (TNF-α) (baseline, P=0.37; d 14, P=0.32; d 30, P=0.29) did not show statistically significant differences between R and NR groups.
Two groups of mCRC patients in the phase IIa study, Responders (R, n=25) and Non-responders (NR, n=9) were defined by the patterns of their tumor marker and LDH values at d 30 and 60 after their first RMB implantation. There was a decrease in CEA and/or CA 19-9 in approximately 75% of the patients (P=0.0006). It was noted that the time course of the decrease in tumor markers was seen between 14 and 30 d, but lasted at least two to three months after implantation. In comparison, the SIR lasted between 7 and 21 d. The tumor marker response correlated with a significant increase in OS (P=0.0006 for Responders vs. Non-responders) (Figure 1).
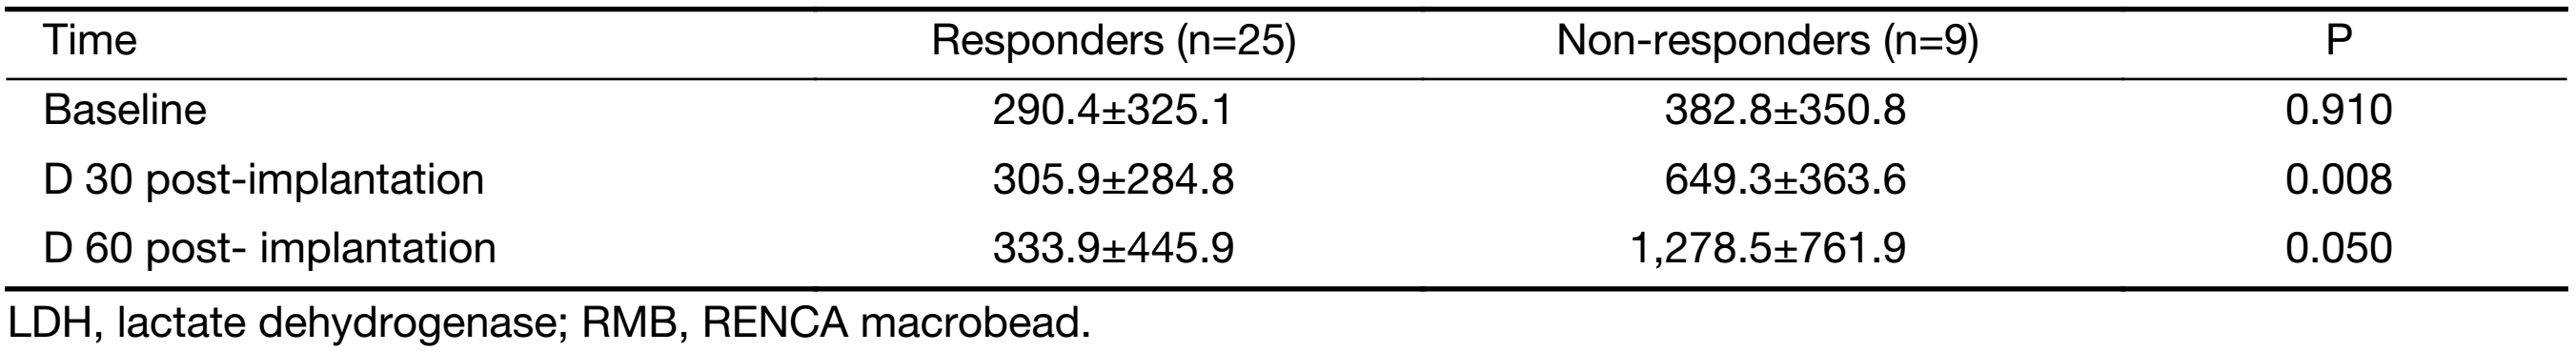
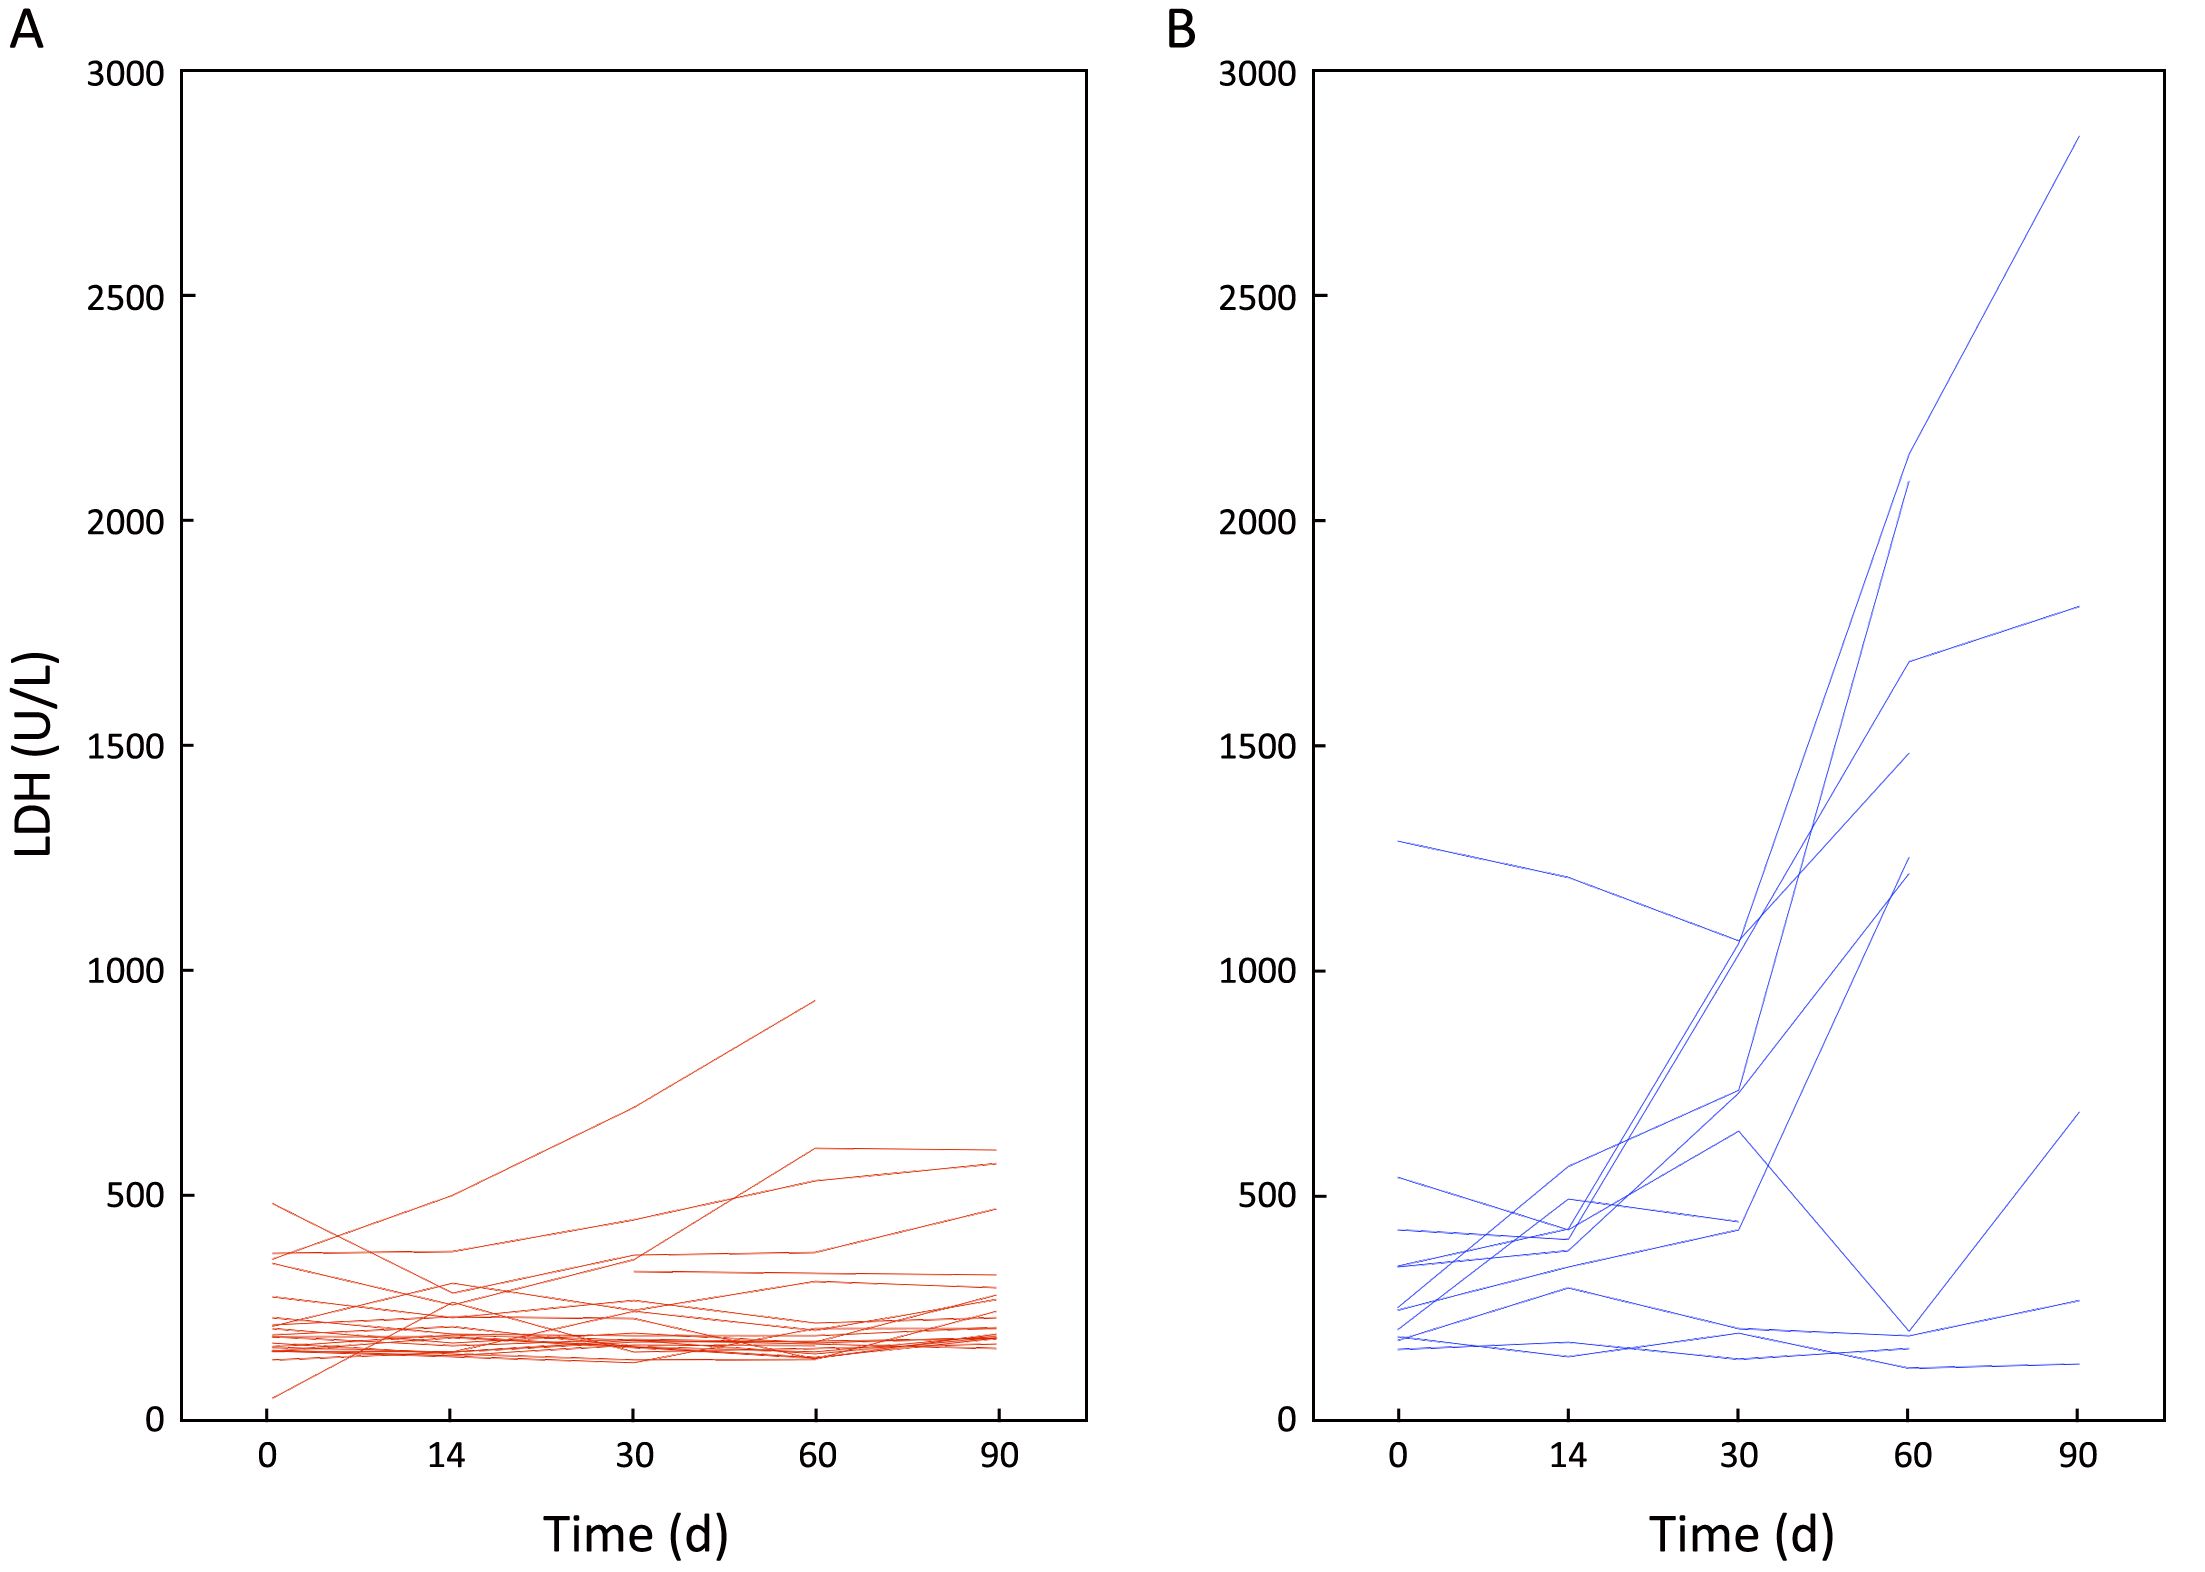
Baseline mean or median LDH values were also correlated with tumor marker-defined Responses or Non-Responses, and the mean values were (Responders vs. Non-responders) 290.4±325.1 vs. 382.8±350.8 U/L; u-test, P=0.910. Whereas at d 30, the mean LDH values were (Responders vs. Non-responders) 305.9±284.8 vs. 649.3±363.6 U/L; P=0.008. The Responses or Non-Responses groups were also statistically different with respect to their mean LDH levels at d 60 (333.9±445.9 vs. 1,278.5±761.9 U/L; P=0.050) (Figure 2, Table 2).
Imaging results
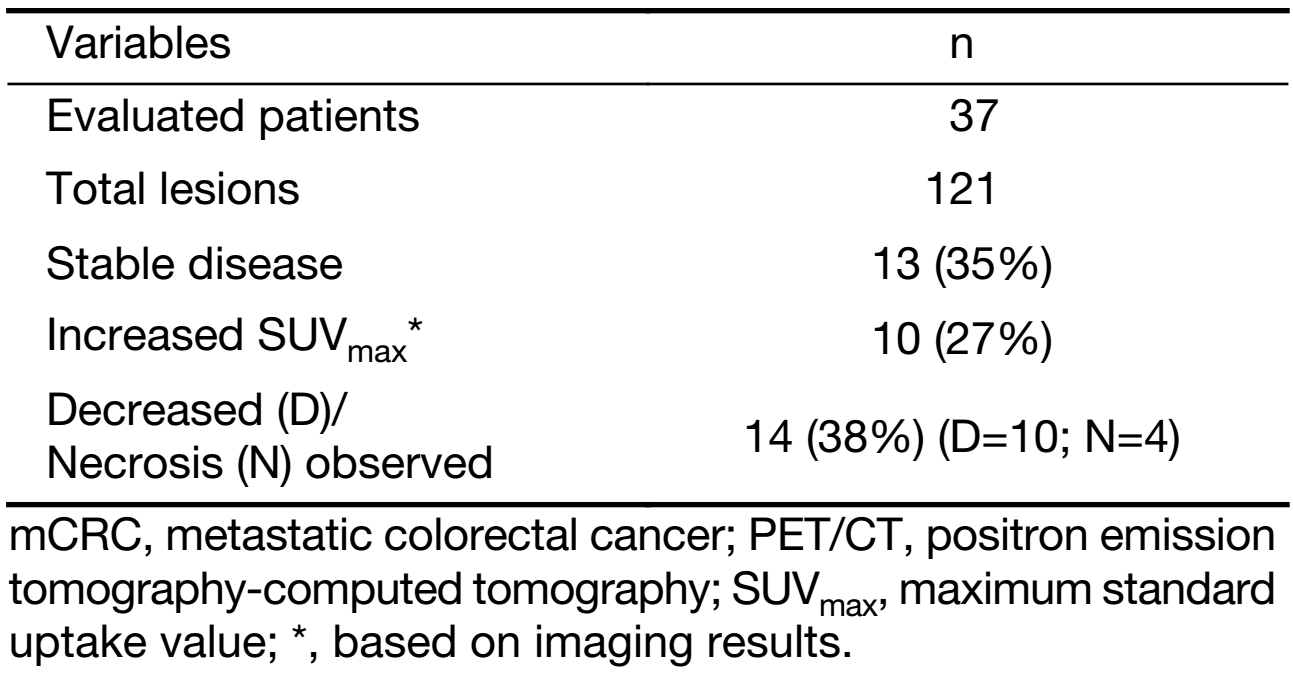
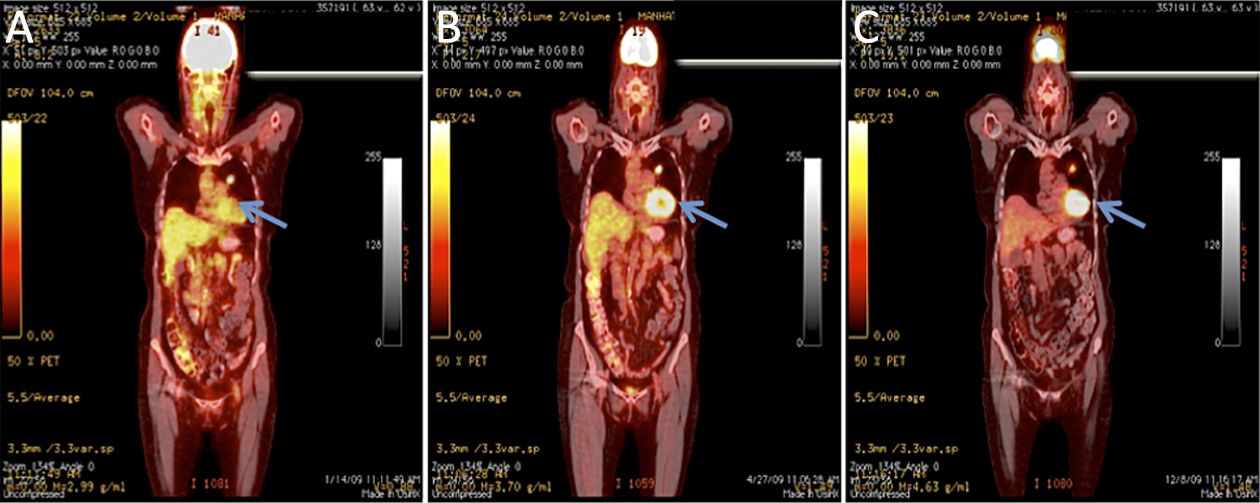
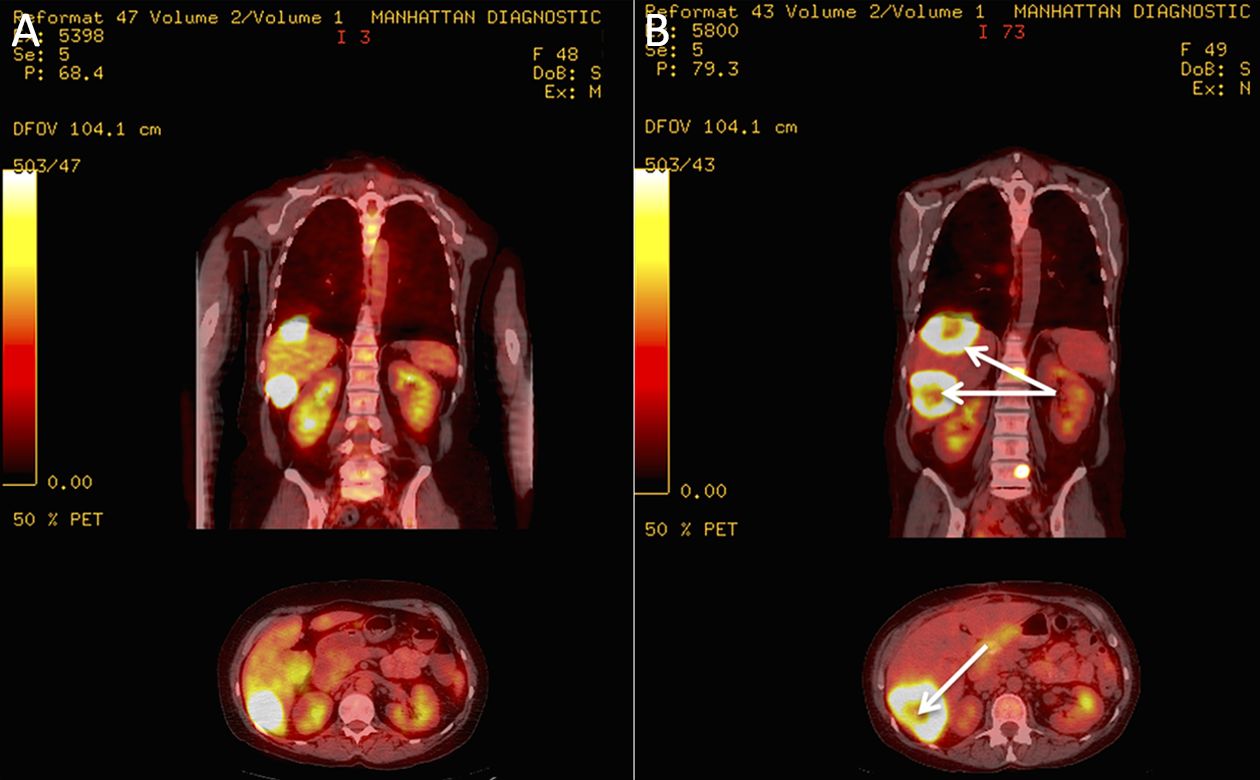
One hundred and twenty-one 18F-FDG-positive tumoral-lesions [phase I (n=39); phase IIa (n=82)] were detected in 37 evaluable patients (14 males; 23 females). Thirty-five percent of the evaluated lesions remained stable, with no changes in their tumor measurements from baseline to d 90 (Table 3). In four patients, tumor necrosis that was not only central, but also peripheral was observed, with the latter likely to be a direct anti-tumor effect induced by the RMBs, as opposed to an indirect effect of a poor vascular supply (Figure 3, 4). Metabolic suppression of the tumor was indicated by decreases in 18F-FDG uptake as measured by SUVmax, an effect and suggestion of direct RMB-induced tumor damage. Such an effect was seen, even with stable tumor volume (Figure 3). In addition, correlation between CEA and SUVmax findings was evaluated. Out of the 37 evaluable patients, 57% (n=21) showed a post-implantation decrease in CEA by at least 20%. Forty-eight percent of the CEA Responders (n=10) were also Responders as classified by changes in SUVmax.
Full table
Overall survival
There was a significant difference in OS in 75% of patients showing a decrease in tumor markers by at least 20% during the first 30 d post-implantation (mean OS, 10.76 months) and those who did not (mean OS, 4.90 months; HR=0.25; P=0.0006) (Figure 1).
Patients who were tumor marker Responders were more likely to have more than one implantation vs. Non-responders (42% vs. 9%, P=0.067).
Discussion
The data presented here demonstrate that RENCA cells trapped in a double-layer agarose matrix and implanted intraperitoneally in patients with advanced, treatment-resistant mCRC produce consistent anti-tumor effects with respect to decreased tumor markers, stable to decreased tumor volume, decreased metabolic activity (as measured by the uptake of 18F-FDG), and stable LDH levels. Furthermore, our preliminary data suggest that these effects correlate with improved survival. Taken together, these findings, along with the extensive laboratory data already published, support the concept of the use of cellular biological systems to control the growth and activity of neoplastic cells and tumors. More clinical data are needed and phase III trial is being organized at this time.
The systems-biological therapeutic approach described here is consistent with the evolving understanding regarding the tremendous complexity, heterogeneity (21), and capacity of many cancers for rapid evolution that has now been demonstrated by many investigators (22). The cellular population within the RMBs represents (as colonies of stem cells and their daughter cells) a neoplastic biological system (23). Under the conditions of entrapment in an agarose matrix, this system demonstrates changes from populations of cells that presumably favor cancer cell proliferation within the macrobeads to one where the entrapped cells maintain a maximal population size that releases multiple factors that signal net growth inhibitory effects in freely-growing neoplastic cells outside the RMBs (17-19).
As previously reported, our studies of the gene expression changes induced by the entrapment of the RENCA cells in the agarose RMBs include downregulation of genes associated with DNA replication, angiogenesis, oncogenes (HRAS), metalloproteinase production, immune evasion, as well as prominent upregulation (100-fold) of genes associated with apoptosis (i.e., CHOP and GADD45), and lesser effects on genes associated with increased differentiation states. One would expect that a therapeutic system that provides such a range of inhibitory processes and has the capability of promoting apoptosis (or other cell death) would be necessary to be effective against complex, heterogeneous, and rapidly evolving tumors that have multiple interactions with the host systems at multiple levels.
Of course, the genomic data for both cells in the RMBs and those in the target cells provide limited information in understanding the RMB mechanism(s) of action. In one approach to further define the mechanism(s), the genomic data we have obtained have been augmented by proteomic/mass spectroscopy analysis. These studies have shown that more than 600 proteins and peptides are released from the RMBs, with some 30 of these having known anti-neoplastic properties and conservation across species. As previously published, 10 of these proteins/peptides seem to be particularly likely candidates as signals capable of producing the inhibitory effects seen with the RMBs (17-19).
Preliminary data obtained from proteomic and key-pathway-analysis studies of the effects of the RMBs on neoplastic cells, done in collaboration with the Mass Spectroscopy Laboratory at Lund University (Lund, Sweden) using breast cancer cell lines as targets, have demonstrated multiple effects in the target cells outside the RMBs (24). The net result was inhibition, induction of the synthesis of misfolded proteins and consequent cellular toxicity, along with downregulation of pathways associated with protein folding, downregulation of gene silencing, and upregulation of apoptosis. Much more work needs to be done with regard to the proteomics and key pathway analysis of these and other cell lines, including RENCA, but the multiple effects of the signals released by the RENCA cells entrapped in the agarose matrices are clear.
One very specific signaling pathway involved in the effects of the RMBs is that involving the transcription factor myocyte enhancing factor-2 (MEF-2) (unpublished data). Originally identified from a panel of signaling pathways in the Rogosin Institute, MEF-2 is involved in producing approximately 40% of the overall tumor inhibitory effect we see in RENCA and other human neoplastic lines tested in the Rogosin Institute. The documented upregulation of MEF-2 is achieved by either or both an epidermal growth factor receptor (EGFR)-mediated pathway and the P13K/Akt pathway. We are continuing to explore these pathways and identify the signal(s) activating them, as well as evaluate the possible involvement of signals other than peptides or proteins, such as mRNA or lipids.
Returning again to the clinical experience in patients with advanced, treatment-resistant mCRC, various findings [decreased tumor markers, stable and/or decreased tumor volume (with or without necrosis), decreased 18F-FDG uptake, and stable LDH in Responders, as well as very early correlation with survival] are consistent in supporting the biological anti-tumor effects of the RMBs. Since multiple processes from the initial systemic inflammatory process to spontaneous central necrosis of the primary and/or metastatic tumors are occurring in these patients, consideration of these effects together is strong evidence that they are due to the RMBs themselves.
One specific concern is whether the decrease in tumor markers is accounted for, at least in part by, the SIR that is stimulated by the laparoscopic implantation of the RMBs and the immune response to the RMBs as a foreign body. The fact that the SIR itself has generally resolved within a few days to two weeks, along with the fact that CEA is likely to rise in association with an inflammatory response argue against this notion. In addition, the clear rise and subsequent rapid fall in CA-125 is clearly associated with the surgical implantation procedure. While it does increase well after implantation, it appears to be a marker, as would be expected, of peritoneal irritation indicative of peritoneal spread of tumor.
Furthermore, the stability of the levels of LDH in all but one of the patients classified as Responders compared to that seen with Non-responders, where tumor progression is occurring, is remarkable. LDH is an indicator of aerobic and anaerobic glycolytic metabolism, but has also been used for many years as a marker of tissue damage. The utility of LDH as a predictor of response to anti-angiogenic therapy and also of OS in mCRC patients has been investigated and reported by others (25-29). The question of what this lack of change in LDH actually represents in the mCRC patients we studied remains to be determined. Increased glycolysis and lactate production under conditions of relative hypoxia (the Warburg effect) (30) has long been described for neoplastic processes and is likely to be relevant to our current findings. Suppression of tumor metabolism by the RMBs may account for the stabilized glycolysis in the Responders (and lower 18F-FDG uptake seen), whereas LDH’s rapid rise in the Non-responders may be due to increased glycolysis in the cancer cells (consistent with the increased 18F-FDG uptake documented on the PET scans). In addition, it is likely that the rising LDH seen in the latter group also reflects tissue damage so that these LDH levels are a mixture of both increased metabolism and cell or tissue damage from hypoxia. To further pursue this, the LDH isozyme profile will be incorporated to determine what those patterns may indicate.
The anatomical and metabolic data derived from the 18F-FDG PET-CT findings in our patient population are also in agreement with the tumor marker and LDH changes reported above. Both the stabilization of tumor volume and the decreased 18F-FDG uptake, as measured by SUVmax, seen in the Responder group are consistent with those changes. These findings are also consistent with previous studies regarding the use of 18F- FDG PET-CT in colorectal cancer patients (31-33), with glioblastoma multiforme, and other types of cancer (34). The appearance of necrosis in four patients’ tumors, especially where it was not only central but also peripheral, is further encouraging. However, frank necrosis was not commonly seen in the patients in this series. One can surmise that this is to be expected since RMB therapy is more cytostatic than cytotoxic in nature.
The limitations of this study are clear. The small number of patients is a major contributor to the limitations, especially since it is understood that colorectal cancer is defined by a variety of genomic subtypes, clonal heterogeneity and the capacity for rapid evolution, including that driven by previous therapies. This must be addressed in a larger phase III trial. Such a trial must include genomic and proteomic profiling of the patients entering the trial, as well as after each implant at d 90. Profiling will greatly assist post-study ability to correlate data with response, and could also provide the basis for possible combination of the RMBs with immunotherapy, such as that associated with PD-1 or PD-L1 blockage. The question of the necessity of randomization is also important to consider, although it will not be possible to blind the trial because of the required surgery (even if laparoscopic). The suggestion has been made that either regorafenib or trifluridine/tipiracil could be administered to the control group, but it is not clear that this will be a balanced, easily interpretable comparison, especially given the significant side effects of both of the chemotherapeutic agents. With regard to LDH levels, it will be important to determine the distribution of the five LDH isozymes to better understand the data. With respect to the PET-CT scanning, it will be necessary to move beyond SUVmax to a more detailed analysis of SUV in different regions of each lesion. To gauge necrosis more precisely, it may be necessary to consider the administration of intravenous contrast in the CT portion of the scan. This would be proposed in only a subset of the patients, i.e., those with normal glomerular filtration rate (GFR) and creatinine values and minimal history of nephrotoxic chemotherapy.
Conclusions
The data presented here, based on phase I and phase II clinical trials of the RMBs for mCRC, support the biological systems concept of cancer and that therapeutic approaches based on this understanding, are viable. The planned phase III trial will be the next step to determine the clinical usefulness of the RMBs. The additional tools of precision medicine will be utilized to better define the subtypes and response patterns of mCRC in both the primary tumors and the metastatic lesions. Further consideration is needed in regards to the RMB therapy with other biologic therapies, including immunotherapeutic modalities.
Acknowledgements
Appreciation is extended to Vital Systems, Inc. for data collection and statistical analysis. We are also grateful for the continuing financial support of this project received from Metromedia Bio-Science, LLC.
Footnote
Conflicts of Interest: The authors have no conflicts of interest to declare.
References
- Guinney J, Dienstmann R, Wang X, et al. The consensus molecular subtypes of colorectal cancer. Nat Med 2015;21:1350–6. [PubMed] DOI:10.1038/nm.3967
- Dawson MA. The cancer epigenome: Concepts, challenges, and therapeutic opportunities. Science 2017;355:1147–52. [PubMed] DOI:10.1126/science.aam7304
- Fang S, Fang X. Advances in glucose metabolism research in colorectal cancer. Biomed Rep 2016;5:289–95. [PubMed] DOI:10.3892/br.2016.719
- Singh R, Campbell BJ, Yu LG, et al. Cell surface-expressed Thomsen-Friedenreich antigen in colon cancer is predominantly carried on high molecular weight splice variants of CD44. Glycobiology 2001;11:587–92. [PubMed]
- Sherbet G. Hormonal influences on cancer progression and prognosis. Vitam Horm 2005;71:147–200. [PubMed] DOI:10.1016/S0083-6729(05)71006-2
- Inukai M, Toyooka S, Ito S, et al. Presence of epidermal growth factor receptor gene T790M mutation as a minor clone in non-small cell lung cancer. Cancer Res 2006;66:7854–8. [PubMed] DOI:10.1158/0008-5472.CAN-06-1951
- Gerlinger M, Rowan AJ, Horswell S, et al. Intratumor heterogeneity and branched evolution revealed by multiregion sequencing. New Engl J Med 2012;366:883–92. [PubMed] DOI:10.1056/NEJMoa1113205
- Greaves M, Maley CC. Clonal evolution in cancer. Nature 2012;481:306–13. [PubMed] DOI:10.1038/nature10762
- Gulati S, Martinez P, Joshi T, et al. Systematic evaluation of the prognostic impact and intratumour heterogeneity of clear cell renal cell carcinoma biomarkers. Eur Urol 2014;66:936–48. [PubMed] DOI:10.1016/j.eururo.2014.06.053
- Ling S, Hu Z, Yang Z, et al. Extremely high genetic diversity in a single tumor points to prevalence of non-Darwinian cell evolution. Proc Natl Acad Sci U S A 2015;112:E6496–505. [PubMed] DOI:10.1073/pnas.1519556112
- Pisco AO, Huang S. Non-genetic cancer cell plasticity and therapy-induced stemness in tumour relapse: ‘What does not kill me strengthens me’. Br J Cancer 2015;112:1725–32. [PubMed] DOI:10.1038/bjc.2015.146
- Lloyd MC, Cunningham JJ, Bui MM, et al. Darwinian dynamics of intratumoral heterogeneity: not solely random mutations but also variable environmental selection forces. Cancer Res 2016;76:3136–44. [PubMed] DOI:10.1158/0008-5472.CAN-15-2962
- Sievers CK, Leystra AA, Clipson L, et al. Understanding intratumoral heterogeneity: lessons from the analysis of at-risk tissue and premalignant lesions in the colon. Cancer Prev Res 2016;9:638–41. [PubMed] DOI:10.1158/1940-6207.CAPR-16-0096
- Gerlinger M, Quezada SA, Peggs KS, et al. Ultra-deep T cell receptor sequencing reveals thecomplexity and intratumour heterogeneity of T cell clones in renal cell carcinomas. J Pathol 2013;231:424–32. [PubMed] DOI:10.1002/path.4284
- Do K, O’Sullivan Coyne G, Chen AP. An overview of the NCI precision medicine trials-NCI MATCH and MPACT. Chin Clin Oncol 2015;4:31. [PubMed] DOI:10.3978/j.issn.2304-3865.2015.08.01
- Crusz SM, Tang YZ, Sarker SJ, et al. Heterogeneous response and progression patterns reveal phenotypic heterogeneity of tyrosine kinase inhibitor response in metastatic renal cell carcinoma. BMC Med 2016;14:185. [PubMed] DOI:10.1186/s12916-016-0729-9
- Smith BH, Gazda LS, Conn BL, et al. Hydrophilic agarose macrobead cultures select for outgrowth of carcinoma cell populations that can restrict tumor growth. Cancer Res 2011;71:725–35. [PubMed] DOI:10.1158/0008-5472.CAN-10-2258
- Smith BH, Gazda LS, Conn BL, et al. Three-dimensional culture of mouse renal carcinoma cells in agarose macrobeads selects for a subpopulation of cells with cancer stem cell or cancer progenitor properties. Cancer Res 2011;71:716–24. [PubMed] DOI:10.1158/0008-5472.CAN-10-2254
- Smith BH, Parikh T, Andrada ZP, et al. First-in-human phase trial of agarose beads containing murine RENCA cells in advanced solid tumors. Cancer Growth Metastasis 2016;9:9–20. [PubMed] DOI:10.4137/CGM.S39442
- Ataseven H, Oztürk ZA, Arhan M, et al. Cancer antigen 125 levels in inflammatory bowel diseases. J Clin Lab Anal 2009;23:244–8. [PubMed] DOI:10.1002/jcla.20323
- Dunne PD, McArt DG, Bradley CA, et al. Challenging the cancer molecular stratification dogma: intratumoral heterogeneity undermines consensus molecular subtypes and potential diagnostic value in colorectal cancer. Clin Cancer Res 2016;22:4095–104. [PubMed] DOI:10.1158/1078-0432.CCR-16-0032
- Yeang CH, Beckman RA. Long range personalized cancer treatment strategies incorporating evolutionary dynamics. Biol Direct 2016;11:56. [PubMed] DOI:10.1186/s13062-016-0153-2
- Fidler IJ, Hart IR. Biological diversity in metastatic neoplasms: origins and implications. Science 1982;217:998–1003. [PubMed]
- Martis PC, Laramore MA, Dudley AT, et al. Abstract B36: RENCA macrobead-induced AKT hyper-phosphorylation leads to MEF2 activation and inhibition of the proliferation of human DU145 prostate carcinoma cells. Mol Cancer Res 2016;14:B36–B36. DOI:10.1158/1557-3125.DEVBIOLCA15-B36
- Lin JT, Wang WS, Yen CC, et al. Outcome of colorectal carcinoma in patients under 40 years of age. J Gastroenterol Hepatol 2005;20:900–5. [PubMed] DOI:10.1111/j.1440-1746.2005.03893.x
- Koukourakis MI, Giatromanolaki A, Sivridis E, et al. Lactate dehydrogenase 5 expression in operable colorectal cancer: strong association with survival and activated vascular endothelial growth factor pathway -- a report of the tumour angiogenesis research group. J Clin Oncol 2006;24:4301–8. [PubMed] DOI:10.1200/JCO.2006.05.9501
- Marmorino F, Salvatore L, Barbara C, et al. Serum LDH predicts benefit from bevacizumab beyond progression in metastatic colorectal cancer. Br J Cancer 2017;116:318–23. [PubMed] DOI:10.1038/bjc.2016.413
- Langhammer S, Najjar M, Hess-Stumpp H, et al. LDH-A influences hypoxia-inducible factor 1α (HIF1 α) and is critical for growth of HT29 colon carcinoma cells in vivo. Target Oncol 2011;6:155–62. [PubMed] DOI:10.1007/s11523-011-0184-7
- Yin C, Jiang C, Liao F, et al. Initial LDH level can predict the survival benefit from bevacizumab in the first-line setting in Chinese patients with metastatic colorectal cancer. Onco Targets Ther 2014;7:1415–22. [PubMed] DOI:10.2147/OTT.S64559
- Warburg O, Wind F, Negelein E. The metabolism of tumors in the body. J Gen Physiol 1927;8:519–30. [PubMed]
- Mertens J, De Bruyne S, Van Damme N, et al. Standardized added metabolic activity (SAM) IN 18F-FDG PET assessment of treatment response in colorectal liver metastases. Eur J Nucl Med Mol Imaging 2013;40:1214–22. [PubMed] DOI:10.1007/s00259-013-2421-z
- Giessen C, Fischer von Weikersthal L, Laubender RP, et al. Evaluation of prognostic factors in liver-limited metastatic colorectal cancer: a preplanned analysis of the FIRE-1 trial. Br J Cancer 2013;109:1428–36. [PubMed] DOI:10.1038/bjc.2013.475
- Xia Q, Liu J, Wu C, et al. Prognostic significance of 18FDG PET/CT in colorectal cancer patients with liver metastases: a meta-analysis. Cancer Imaging 2015;15:19. [PubMed] DOI:10.1186/s40644-015-0055-z
- Parker NR, Hudson AL, Khong P, et al. Intratumoral heterogeneity identified at the epigenetic, genetic and transcriptional level in glioblastoma. Sci Rep 2016;6:22477. [PubMed] DOI:10.1038/srep22477