
MAT1 correlates with molecular subtypes and predicts poor survival in breast cancer
Introduction
Breast cancer is a common cancer type and accounts for the most cancer-related deaths among women worldwide (1). Many efforts have sought to improve the diagnosis and treatment strategies for breast cancer patients (2-6). Despite these efforts, relapse and metastasis still present challenges. Fundamental research has implicated various potential targets of intervention for delaying tumor development, including cell cycle progression (7).
The cell cycle is regulated by a complex network of regulators, including cyclin-dependent kinases (CDKs) in eukaryotic cells. Diverse CDKs are activated by the CDK-activating kinase (CAK) which is the active trimeric complex of CDK7, cyclin H and menage a trois 1 (MAT1) (8), which results in the protein phosphorylation of CDK2 (9) and the tumor suppressor retinoblastoma (Rb) and ultimately cell cycle G1 stage exit (10). Among these three components, CDK7 (11) and cyclin H (12,13) are the pivotal proteins for the major CAK activity, and the assembly factor MAT1 facilitates the efficient combination of CDK7 and cyclin H. In addition, the CAK complex is a module of the multisubunit transcriptional factor IIH (TFIIH) that participates in RNA polymerase II (Pol II)-catalyzed transcription through phosphorylating Pol II C-terminal domain (14) and in DNA nucleotide excision repair by suppressing intrinsic helicase activities (15-17). These observations indicate that MAT1 might play important roles in cell cycle processes, transcription, and DNA repair.
Previous studies reported the correlation between the absence or genetic variants of MAT1 and multiple diseases including some deformities and cancer. The demonstration that a deletion of MAT1 at 14q23.1 contributed to the malformations of pectus carinatum and excavatum, suggests that MAT1 is associated with connective tissue abnormalities (18). In cancer, the short interfering (si)RNA-mediated knockdown of MAT1 blocks the cell cycle at G0/G1 stages, inhibits the growth of pancreatic cancer BxPC3 cells, and reduces the weight and volume of the transplant tumors in mice compared with blank controls (19). Furthermore, genetic variants of MAT1 have been correlated with the susceptibility to lung cancer in a Chinese population (20). Among colorectal cancer patients receiving oxaliplatin treatment, the presence of variant alleles of MAT1 was linked to longer survival in comparison with patients with no variant alleles of MAT1 (21).
The roles of MAT1 in breast cancer remain unclear. In this study, we explored the association between MAT1 and molecular subtypes as well as the role in the clinical outcomes of breast cancer patients.
Materials and methods
Immunohistochemical staining
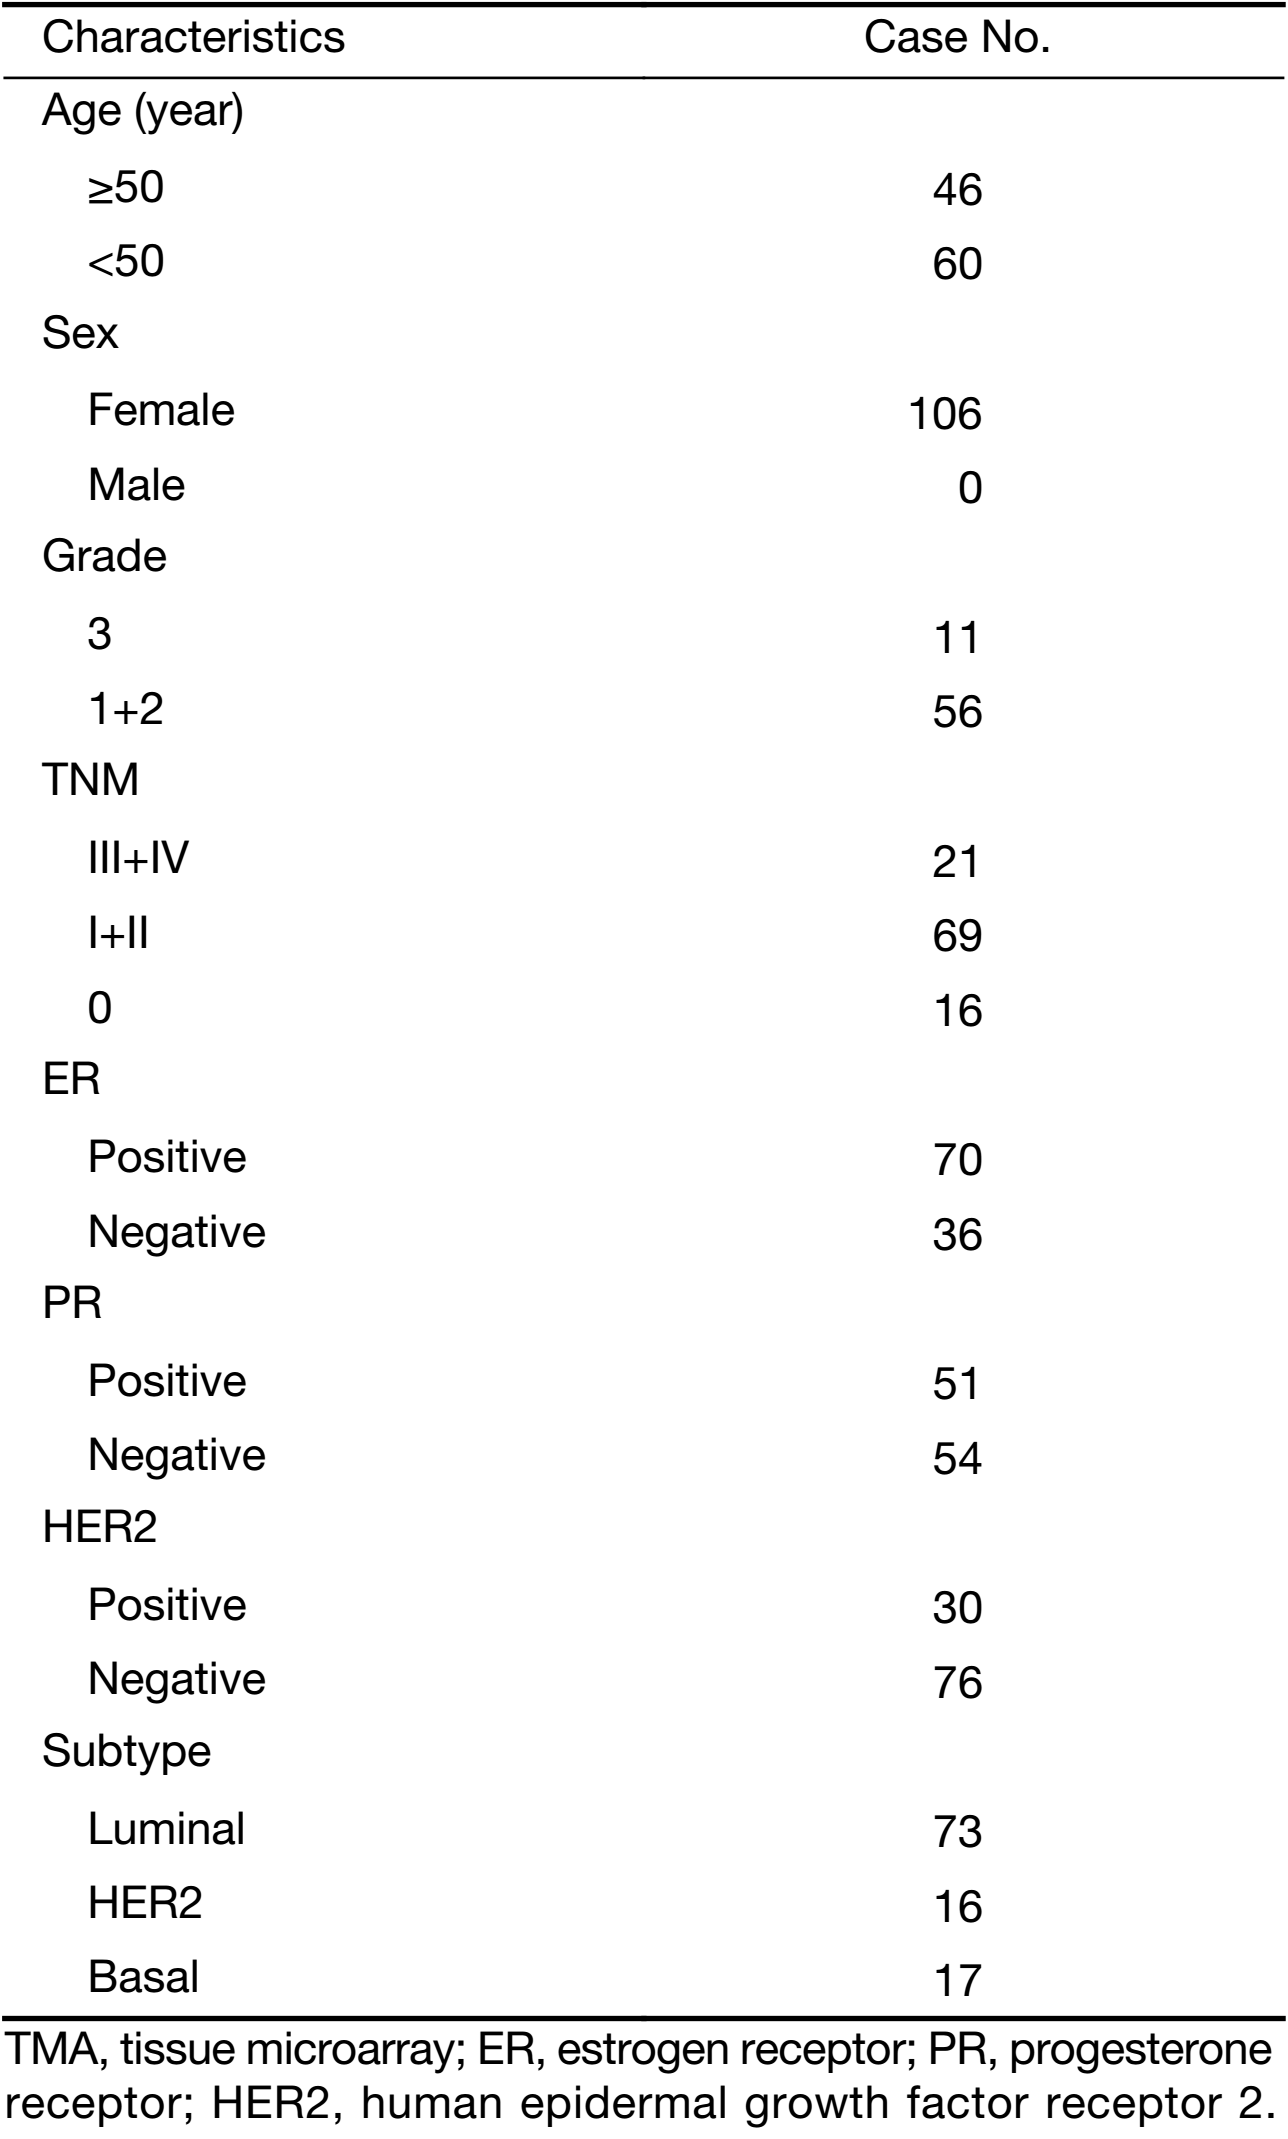
We purchased a commercially available tissue microarray (TMA) slide (BR2082b, US Biomax, Inc, Rockville, MD) containing histologically confirmed tissues for immunohistochemistry (IHC) analysis to assess the protein abundance of MAT1 in estrogen receptor negative (ER–) vs. ER-positive (ER+), progesterone receptor negative (PR–) vs. PR-positive (PR+) and luminal-type vs. human epidermal growth factor receptor 2 (HER2)-enriched vs. basal-like human breast carcinoma tissues. The TMA included 69 cases of invasive ductal carcinoma, 21 cases of invasive lobular carcinoma, 4 cases of squamous cell carcinoma, 15 cases of intraductal carcinoma, 2 cases of intraductal papillary carcinoma and one case of lobular carcinoma in situ. Due to tissue abscission, a total of 106 breast cancer cases were available for IHC and quantification. Among these cases, there were 73 cases of luminal-type, 16 cases of HER2-enriched and 17 of basal-like breast cancer. For the analysis of ER and PR, we classified the cancer tissues with ER status of “1+”, “2+” and “3+” into ER+ group (n=70), and identified “–” as the ER– group (n=36). Similarly, we classified the tumor tissues with PR status of “1+”, “2+” and “3+” into PR+ group (n=51), and sorted “–” as the PR– group (n=54). The PR status of one case was not available. In addition, there were 30 cases with HER2 status of “3+” and 76 cases with HER2 status of “–”, “1+” and “2+”.
The specific primary antibody against MAT1 (sc-13142, Santa Cruz Biotechnology, Dallas, TX, USA) was utilized for IHC at 1:75 dilution with a 2-step standard protocol (22-24). Slides in BR2082b were embedded in paraffin and were baked at 60 °C for 1 h, and then were deparaffinized and rehydrated in xylenes solutions and graded alcohols. After antigen retrieval, slides were incubated in 3% hydrogen peroxide for 30 min to block endogenous peroxidases. Normal goat serum was applied for 20 min to block the non-specific binding of antibody. Next, tissues were incubated with primary antibody at 4 °C overnight. Slides were then incubated with goat anti-mouse secondary antibody for 1 h at 37 °C. Nuclear counterstaining was performed using hematoxylin.
Analysis and quantification of staining
Two experienced pathologists carried out the immunohistochemical scoring independently. According to the Fromowitz Standard (25), the multiplication for intensity and proportion of positive staining cancer cells in each whole tissue represent the protein abundance of MAT1 in each core. The staining intensity was scored as 0 (no staining), 1 (weak staining), 2 (moderate staining) and 3 (strong staining). The proportions of stained tumor cells were identified as 1 (0–25% positive cells), 2 (26%–50% positive cells), 3 (51%–75% positive cells) and 4 (76%–100% positive cells) (23).
Analysis of gene expression data
We used two public Gene Expression Omnibus (GEO) datasets: GEO accession GSE25066 (26) and GSE20685 (27). The gene expression data in these two datasets were both pre-normalized. GSE25066 contained 238 luminal-type, 37 HER2-overexpression, 189 basal-like and 44 normal-like breast carcinoma cases. It was analyzed to evaluate the mRNA expression of MAT1 in ESR1– vs. ESR1+ and distinct molecular subtypes. It was also employed to perform the Kyoto Encyclopedia of Genes and Genomes (KEGG) analysis and assess the correlation between MAT1 mRNA expression and the mRNA levels of ESR1, PGR, keratin-8 (KRT8), KRT18, ERBB2, epidermal growth factor receptor (EGFR), tight junction protein 3 (TJP3), VIM, Y-box binding protein 1 (YBX1), sex determining region Y-box 2 (SOX2), AKT1, caspase 1 (CASP1), CASP4, CASP5, CASP9, CASP10, MYC associated zinc finger protein (MAZ) and sine oculis homeobox homolog 1 (SIX1). In addition, GSE20685, including 327 breast cancer cases with distinct clinical-pathological characteristics, was also employed to carry out KEGG analysis and correlation analysis.
Cell culture and establishment of MAT1 stable cell lines
The MDA-MB-231 and MCF-7 human breast cancer cell lines were cultured in Dulbecco’s modified Eagle’s medium (DMEM) with 10% fetal bovine serum (FBS, Life Technologies, Inc., Carlsbad, CA, USA). Cells were cultured in the condition of 37 °C and 5% CO2 in a humidified incubator. Lentivirus expression vector for MAT1 in pLX304 (HsCD00441199) was purchased from the DNASU plasmid repository (The Biodesign Institute, Tempe, AZ, USA). HEK 293T cells were transfected with the combination of expression vector or control vector with the third generation package plasmids using LipofectamineTM 2000 (Invitrogen, Carlsbad CA, USA) as described previously (24). Subsequently, the viral supernatants were harvested and filtered to transduce MDA-MB-231 and MCF-7 cells three times at 24, 48 and 72 h after transfection. For selection of MAT1 stable cells, transduced cells were then treated with 5 μg/mL blasticidin for 2 weeks.
Immunofluorescence stain
Immunofluorescence staining was performed and modified based on published methods (24). Cells were fixed in 4% formaldehyde for 15 min, permeated by 1% Triton X-100 for 30 min, then blocked in 5% goat serum for 1 h. Primary antibodies used at 1:150 dilution were: MAT1 (Santa Cruz Biotechnology; sc-13142), EGFR (Santa Cruz Biotechnology; sc-03), vimentin (Cell Signaling Technology, Beverly, MA, USA; 5741), Sox2 (Millipore, Billerica, MA, USA; AB5603) and SIX1 (Sigma-Aldrich, St. Louis, MO, USA; HPA001893). The goat anti-mouse and the goat anti-rabbit secondary antibodies (Alexa Fluor-568) were both used at 1:300. Cell nuclei were stained with Honchest 33342 at a dilution of 1:2,000.
Statistical analysis
Expression analysis and correlation analyses were performed using GraphPad Prism (GraphPad Software, La Jolla, CA, USA) and IBM SPSS software (Version 20.0; IBM Corp., New York, USA), respectively. Student’s t-test was applied to evaluate the differences in groups. A two-tailed P<0.05 was considered statistically significant.
Results
MAT1 participates in multiple pathways
KEGG analysis is generally accepted and employed to explore and predict functions of genes. The Database for Annotation, Visualization and Integrated Discovery (DAVID) was employed to perform the KEGG pathway analysis. To evaluate the pathways in which MAT1 might be involved, the public datasets GSE25066 and GSE20685 including 508 and 327 breast cancer cases, respectively, with distinct clinical-pathological characteristics, were examined to carry out KEGG pathway analysis. P<0.05 was considered statistically significant, and the P value was processed by –log analysis. The common pathways from the KEGG analysis of these two datasets are marked in the same color.MAT1 was involved in both physiology processes and pathology pathways (Figure 1), including natural killer cell mediated cytotoxicity, Fc gamma receptor-mediated phagocytosis, endocytosis, tuberculosis, osteoclast differentiation, cytokine-cytokine receptor interaction, ERBB signaling pathway, focal adhesion, leukocyte transendothelial migration, cell adhesion molecules, Epstein-Barr virus infection, transcriptional misregulation in cancer, bacterial invasion of epithelial cells, phosphatidylinositol 3-kinase (PI3K)-AKT signaling pathway, herpes simplex infection, mammalian target of rapamycin (mTOR) signaling pathway, insulin signaling pathway, toxoplasmosis, T cell receptor signaling pathway, primary immunodeficiency, mitogen-activated protein kinase (MAPK) signaling pathway and chemokine signaling pathway.
MAT1 tends to be associated with molecular subtypes of breast cancer
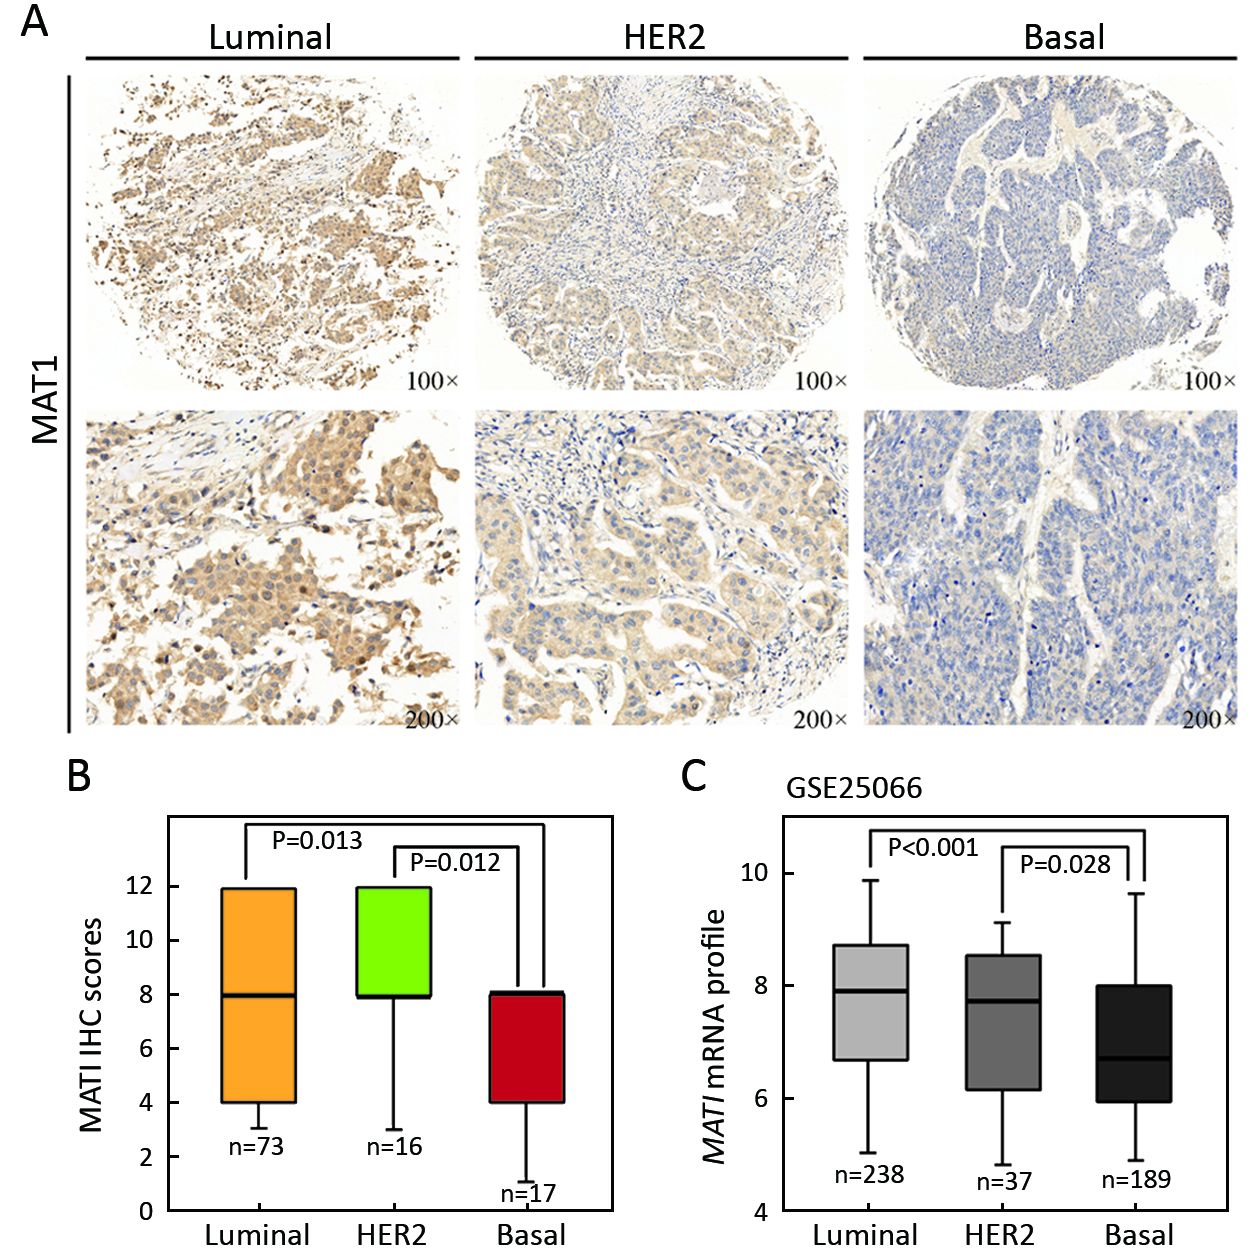
According to the status of ER, PR and HER2, breast cancer is classified into three major molecular subtypes of luminal, HER2-overexpressing, and basal-like. To assess whether there was any correlation between MAT1 protein level and molecular subtypes as well as the status of ER and PR, we carried out IHC analysis on TMA (BR2082b) provided with clinical information (Table 1). MAT1 protein was predominantly detected in the cytoplasm of breast cancer cells. Representative images of IHC staining for luminal-type, HER2-enriched and basal-like breast cancer tissues are presented in Figure 2A. Statistical analysis of the IHC scores revealed that MAT1 protein was enriched in HER2-overexpressing (P=0.012) and luminal subtype (P=0.013) in comparison with basal-like cancerous tissues (Figure 2B). Additionally, expression analysis of GSE25066 indicated a similar tendency at the mRNA level for HER2-enriched vs. basal-like (P=0.028) and luminal vs. basal-like (P<0.001) (Figure 2C). However, there was no statistically significant difference in mRNA level of MAT1 between luminal-type and HER2-enriched tumors at both the protein and mRNA levels.
Full table
Representative images of IHC staining for ER– vs. ER+ and PR– vs. PR+ breast cancer are presented in Figure 3A. Statistical analysis of IHC scores revealed greater protein abundance of MAT1 in PR+ than in PR– cancerous tissues (P=0.019) (Figure 3D). However, there was no statistically significant difference in the MAT1 protein level between ER– and ER+ groups (P=0.225) (Figure 3B). Considering that HER2-overexpressing tissues had a more abundant MAT1 protein level and might increase the average level of MAT1 in the ER– and PR– groups, we eliminated the cases with strong positive status of HER2. The protein level of MAT1 was significantly positively correlated with the status of ER (P=0.008) (Figure 3C) and PR (P=0.003) (Figure 3E) with the removal of the strongly HER2+ cases. Additionally, the GSE25066 dataset was utilized to evaluate whether there was any association between MAT1 mRNA level and the status of ESR1. MAT1 mRNA expression was significantly higher in ESR1+ cancerous tissues in comparison with ESR1– breast cancer tissues (P<0.001) (Figure 3F) or without the strongly ERBB2+ cases (P<0.001) (Figure 3G).

Correlation between MAT1 and luminal, HER2, and basal-like markers
Correlation analysis on GSE25066 indicated that MAT1 mRNA expression was positively correlated with luminal markers of ESR1 (R=0.351, P<0.001) (Figure 4A), PGR (R=0.229, P<0.001) (Figure 4B), KRT8 (R=0.355, P<0.001) (Figure 4C), KRT18 (R=0.314, P<0.001) (Figure 4D), and ERBB2 (R=0.306, P<0.001) (Figure 4E), and was inversely associated with basal-like marker EGFR (R=–0.436, P<0.001) (Figure 4F). The results were consistent with the results at protein level displayed in Figure 2 and Figure 3.

The GSE20685 dataset that included 327 breast cancer patients with distinct molecular subtypes, was also employed to assess the correlation between MAT1 mRNA expression and the aforementioned genes. The quantity of MAT1 mRNA was positively associated with luminal markers of ESR1 (R=0.258, P<0.001) (Figure 4G), PGR (R=0.203, P<0.001) (Figure 4H), KRT8 (R=0.344, P<0.001) (Figure 4I), KRT18 (R=0.401, P<0.001) (Figure 4J) and forkhead box protein A1 (FOXA1) (R=0.377, P<0.001) (Figure 4K), and negatively associated with EGFR (R=–0.377, P<0.001) (Figure 4L).
Correlation between MAT1 and epithelial, mesenchymal, cancer stem cell (CSC) and apoptosis markers
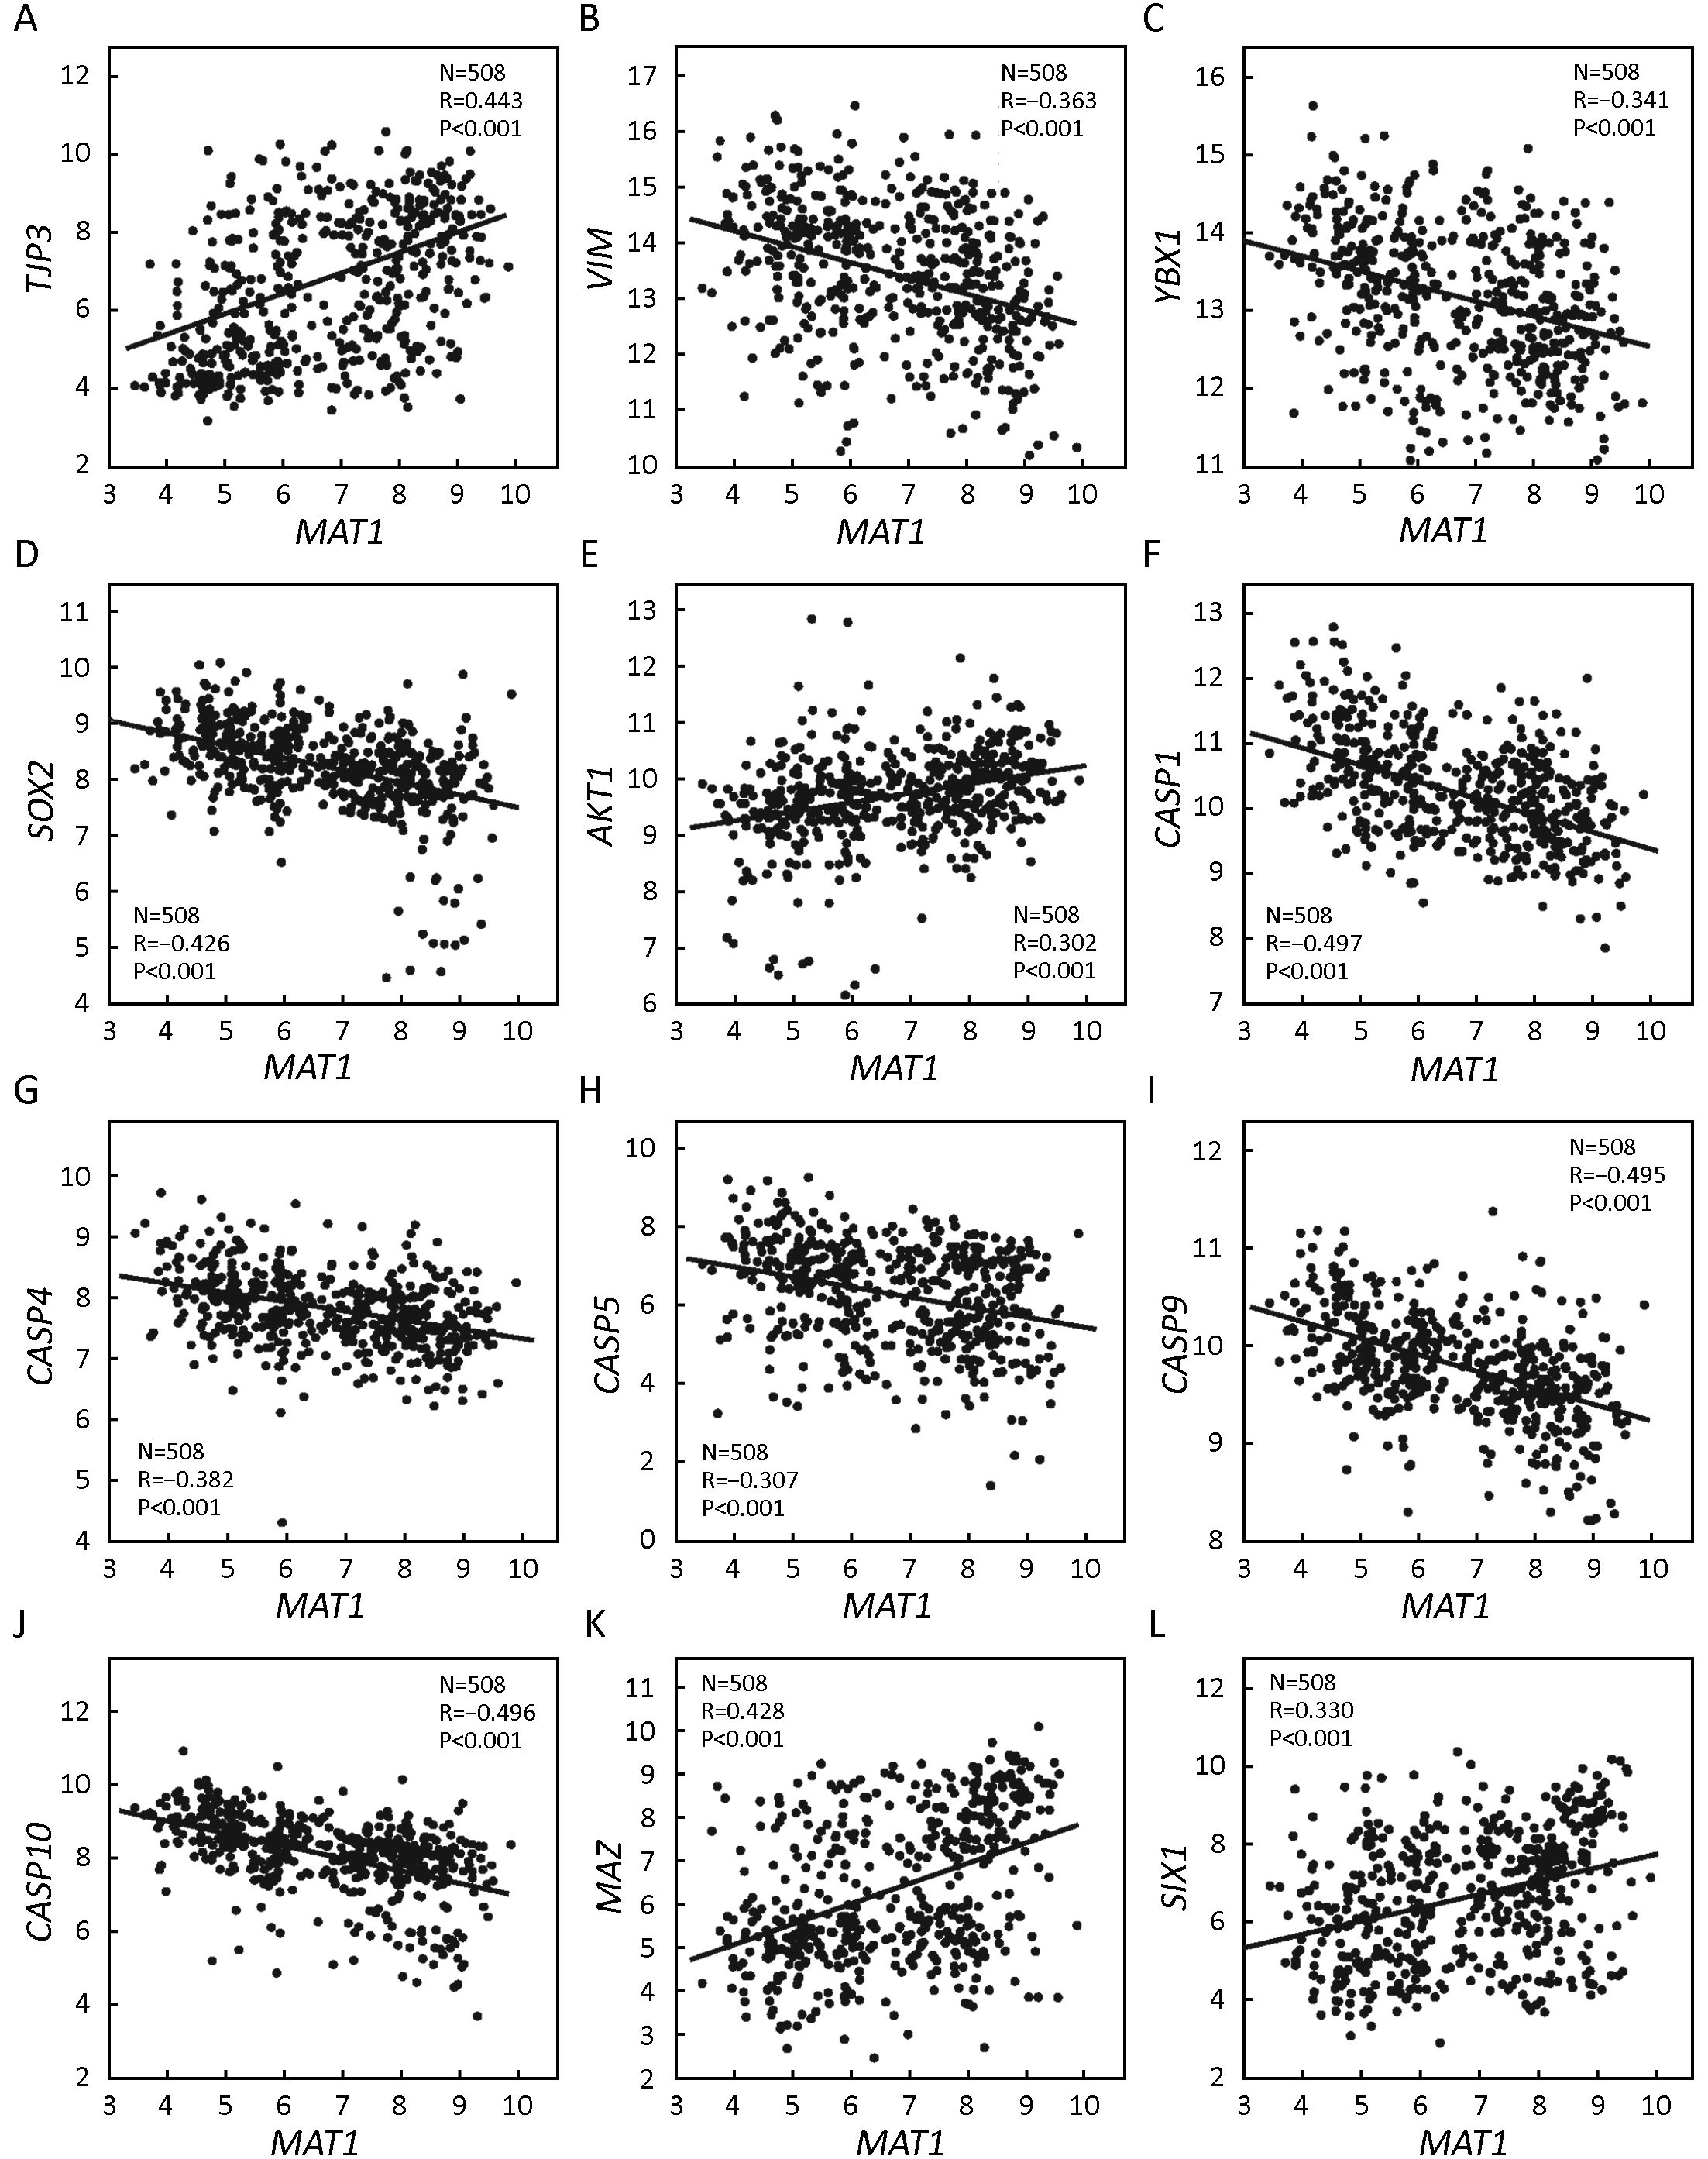
GSE25066 correlation analysis indicated that MAT1 mRNA expression was positively correlated with the epithelial marker TJP3 (R=0.443, P<0.001) (Figure 5A) and negatively associated with the mesenchymal marker VIM (R=–0.363, P<0.001) (Figure 5B). Furthermore, the mRNA amount of MAT1 was inversely correlated with CSC markers YBX1 (R=–0.341, P<0.001) (Figure 5C) and SOX2 (R=–0.426, P<0.001) (Figure 5D). Consistent with KEGG analysis, the mRNA level of MAT1 was positively associated with the proliferation marker AKT1 (R=0.302, P<0.001) (Figure 5E), and was negatively associated with the apoptosis markers of CASP1 (R=–0.497, P<0.001) (Figure 5F), CASP4 (R=–0.382, P<0.001) (Figure 5G), CASP5 (R=–0.307, P<0.001) (Figure 5H), CASP9 (R=–0.495, P<0.001) (Figure 5I) and CASP10 (R=–0.496, P<0.001) (Figure 5J). Furthermore, MAT1 mRNA expression was positively correlated with the transcription factor MAZ (R=0.428, P<0.001) (Figure 5K) and the oncogene SIX1 (R=0.330, P<0.001) (Figure 5L).
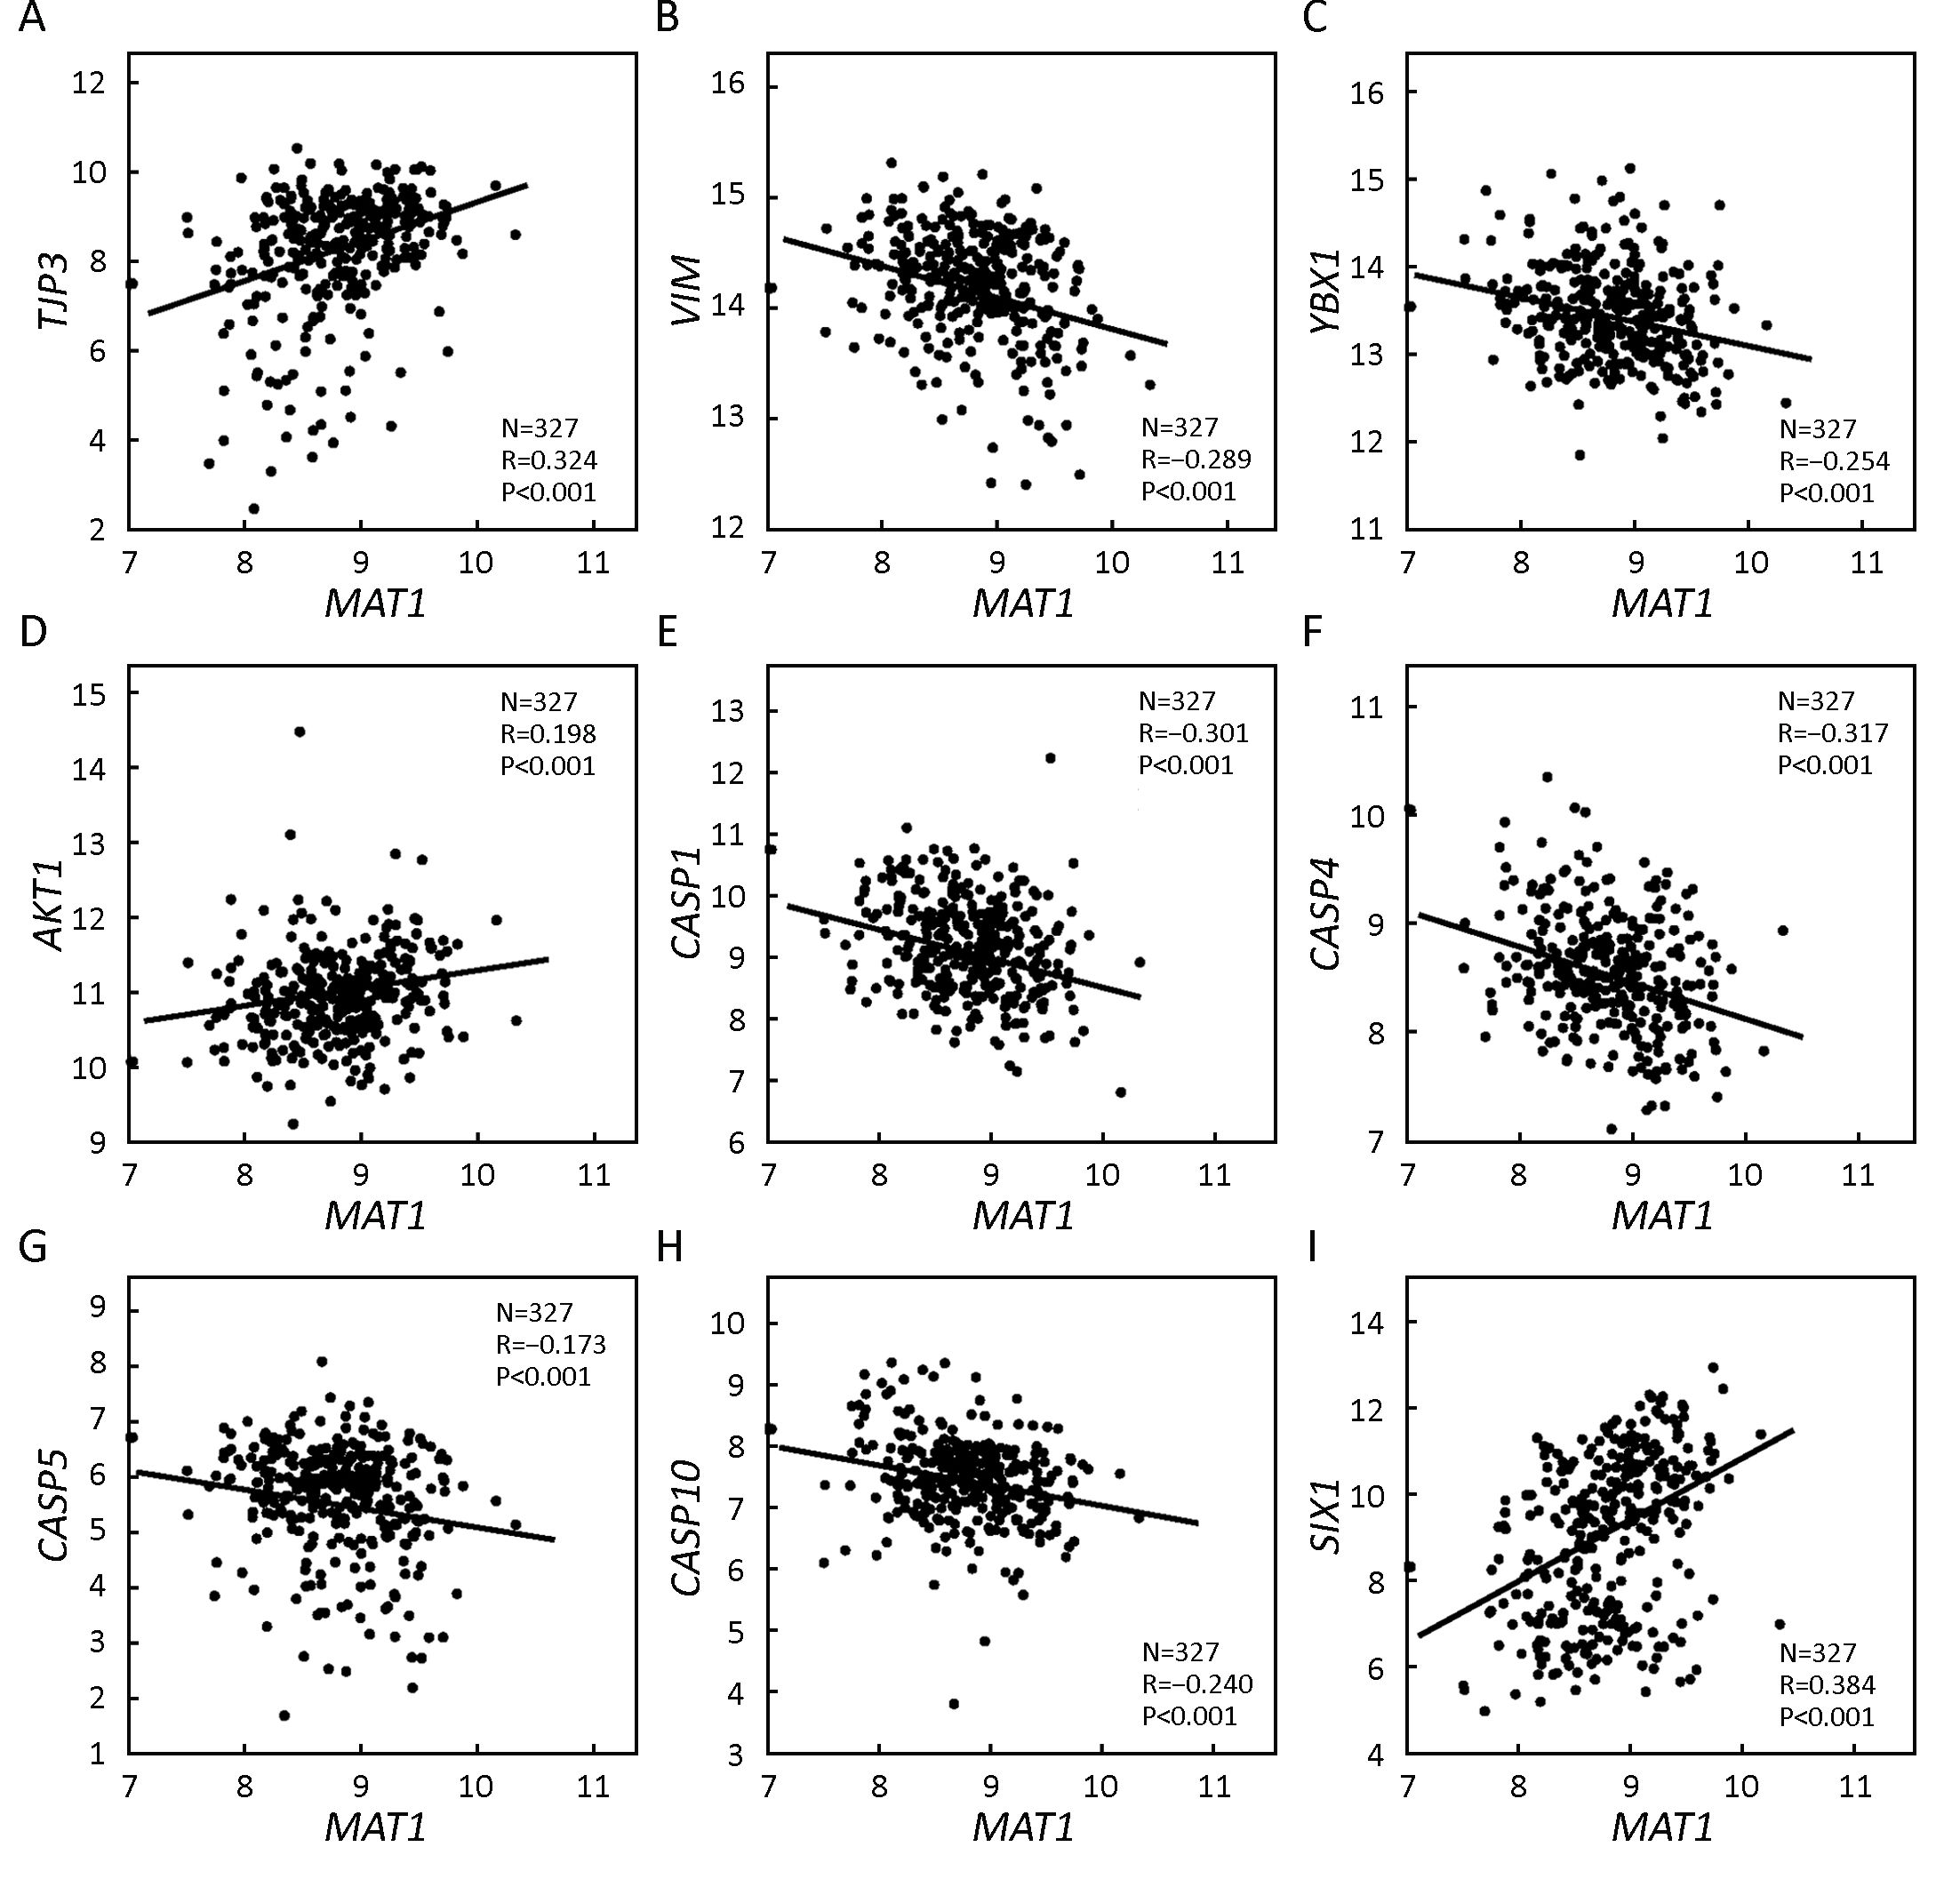
GSE20685 correlation analysis revealed that the mRNA expression of MAT1 was positively correlated with the epithelial marker TJP3 (R=0.324, P<0.001) (Figure 6A) and negatively associated with the mesenchymal marker VIM (R=–0.289, P<0.001) (Figure 6B). Furthermore, the mRNA amount of MAT1 was inversely correlated with the CSC marker YBX1 (R=–0.254, P<0.001) (Figure 6C). Consistent with KEGG analysis, the mRNA amount of MAT1 was positively associated with the proliferation marker AKT1 (R=0.198, P<0.001) (Figure 6D), and was negatively associated with the apoptosis markers CASP1 (R=–0.301, P<0.001) (Figure 6E), CASP4 (R=–0.317, P<0.001) (Figure 6F), CASP5 (R=–0.173, P<0.001) (Figure 6G), and CASP10 (R=–0.240, P<0.001) (Figure 6H). Additionally, MAT1 mRNA expression was positively correlated with the oncogene SIX1 (R=0.384, P<0.001) (Figure 6I).
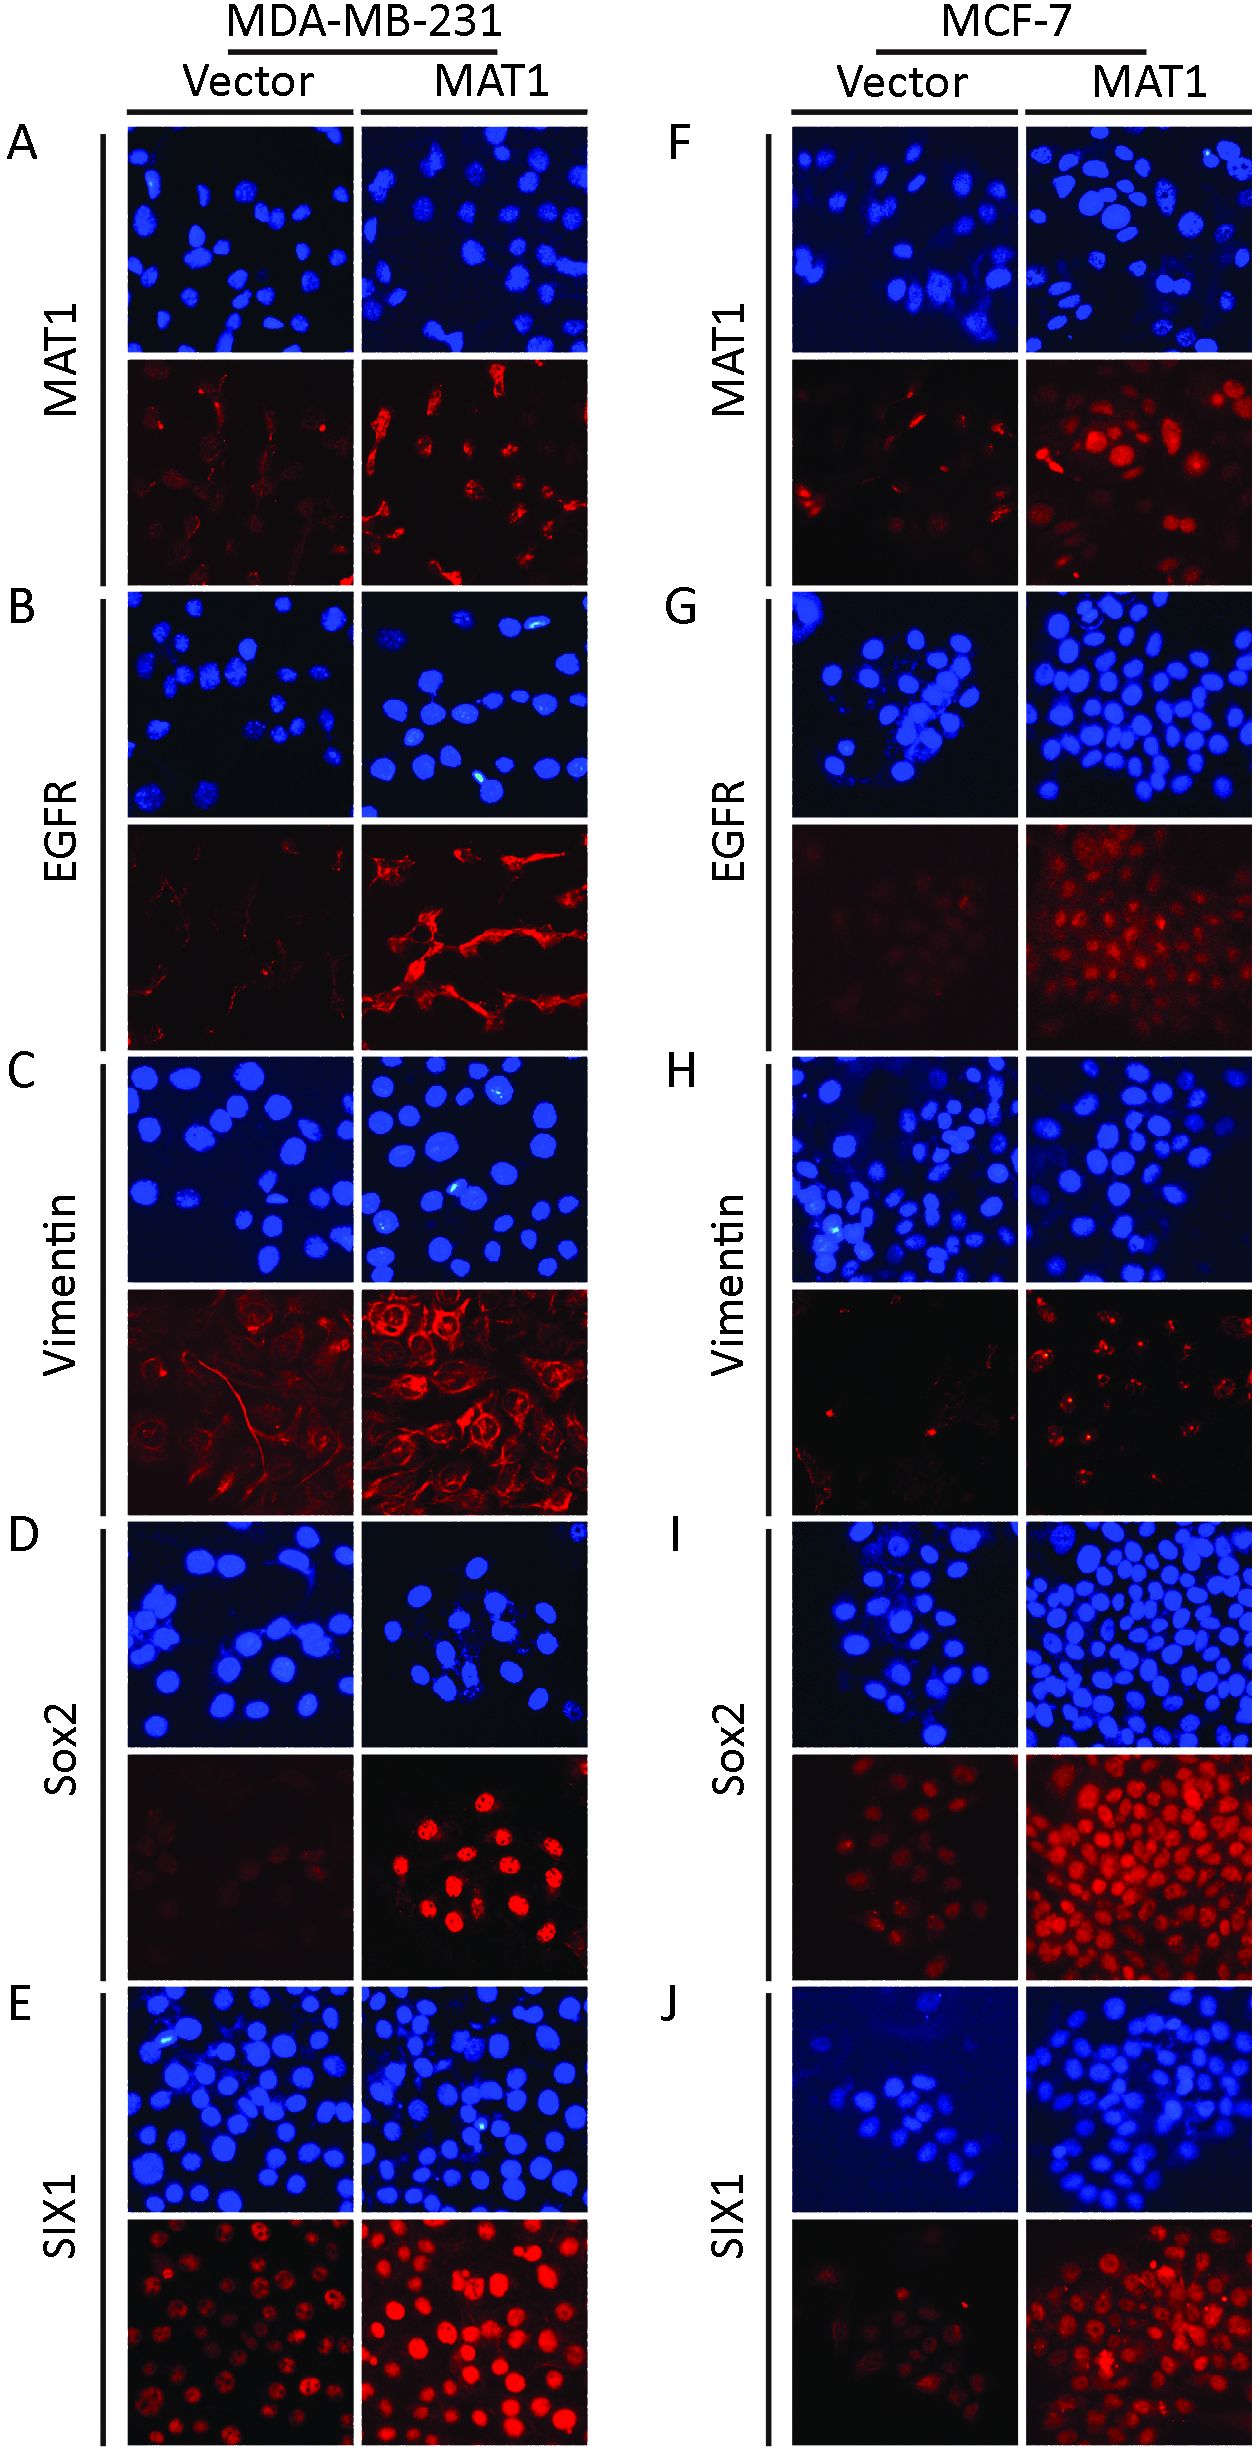
MAT1 regulated protein abundance of cancer-related markers
Immunofluorescence staining revealed that exogenous over-expression of MAT1 upregulated the expression of MAT1 (Figure 7A), EGFR (Figure 7B), vimentin (Figure 7C), Sox2 (Figure 7D) and SIX1 (Figure 7E) at the protein level in MDA-MB-231 cells. In MCF-7 breast cancer cells, upregulation of MAT1 promoted the protein levels of MAT1 (Figure 7F), EGFR (Figure 7G), vimentin (Figure 7H), Sox2 (Figure 7I), and SIX1 (Figure 7J).
High MAT1 expression predicts worse prognosis
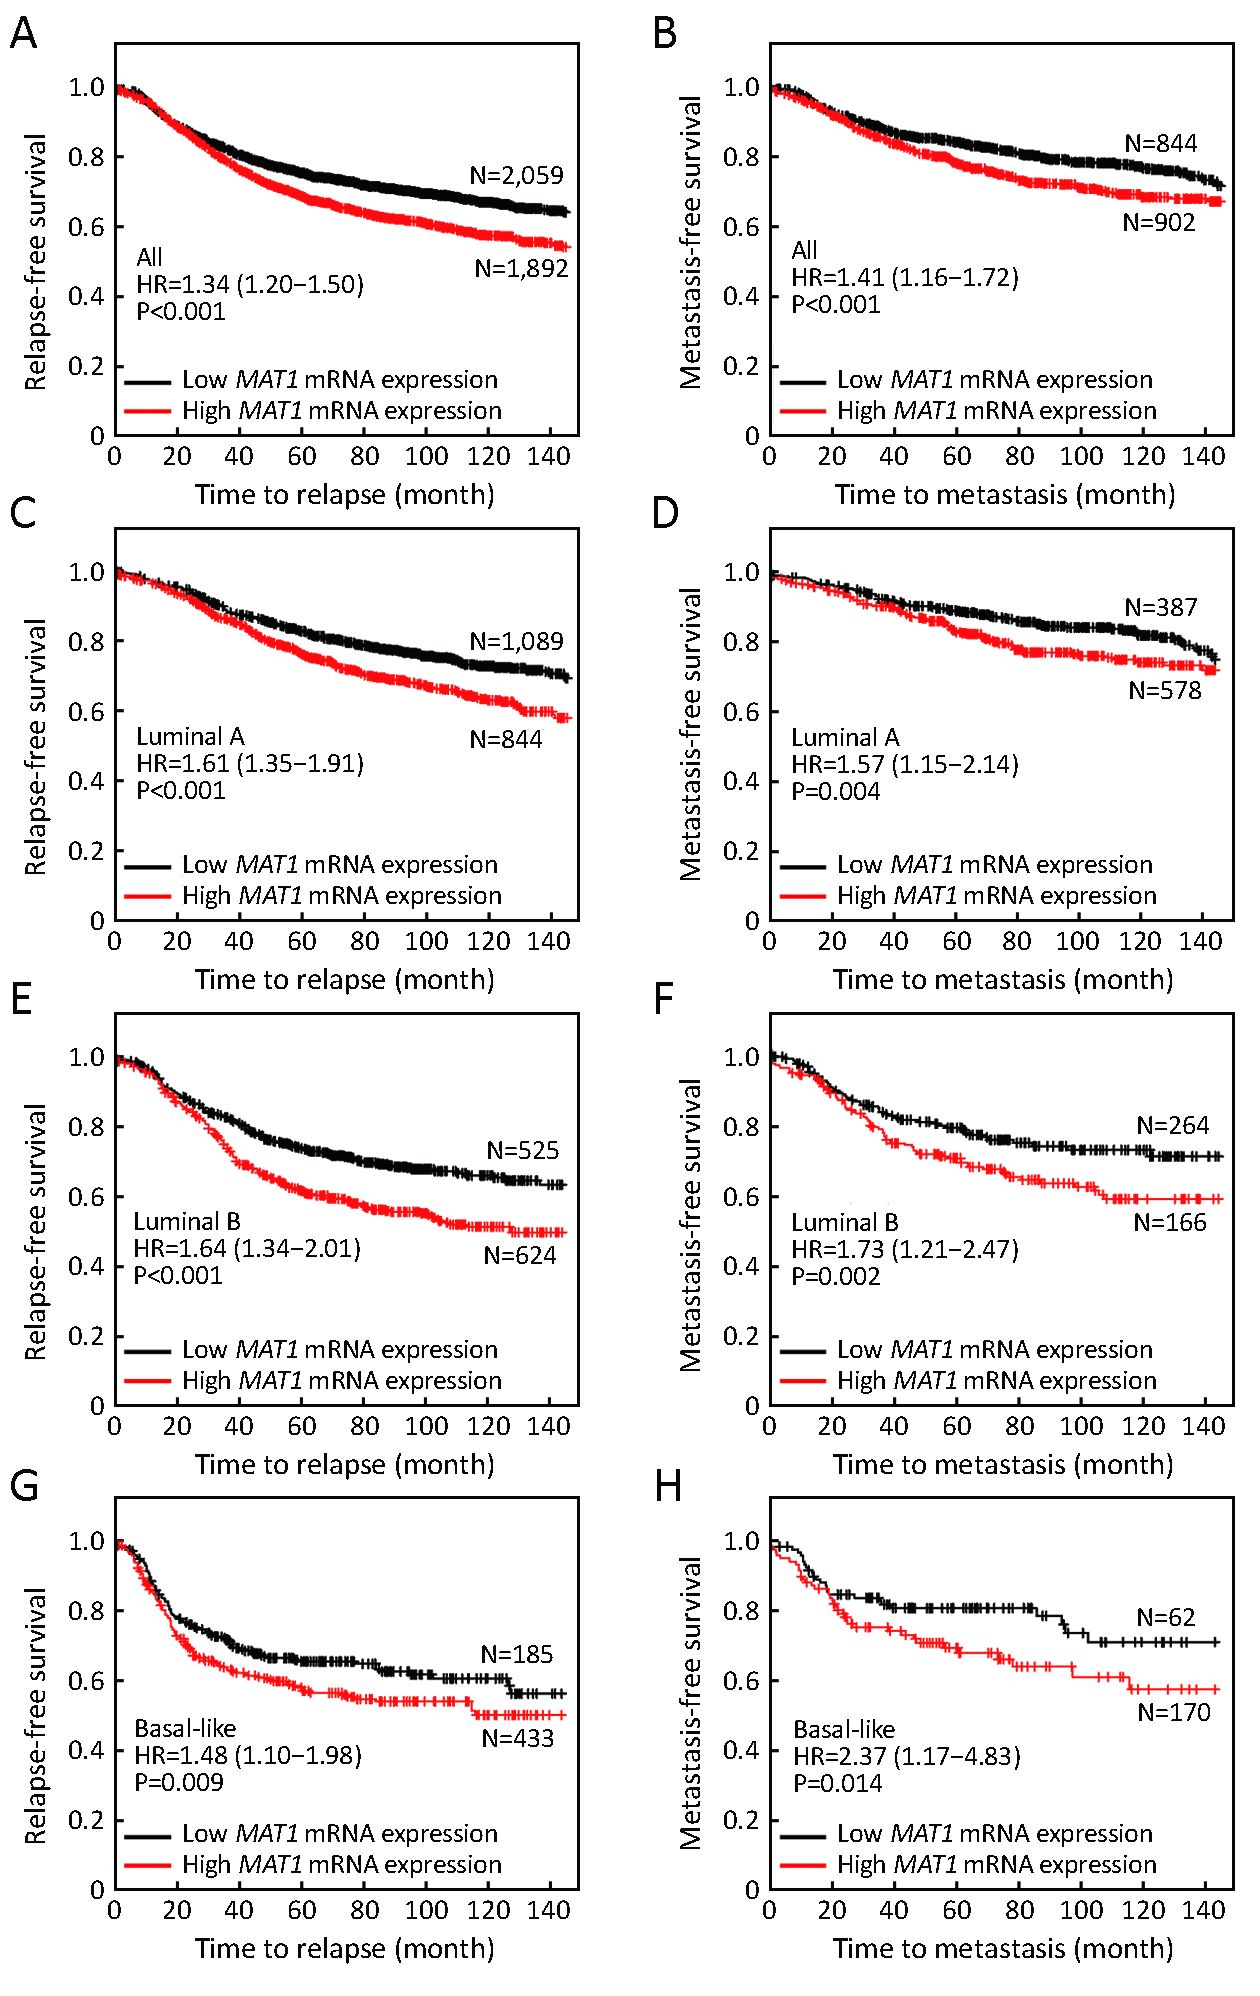
The public Kaplan-Meier Plotter database was employed to evaluate the effects of MAT1 mRNA level on the prognosis of breast cancer patients. Median value of MAT1 mRNA level was utilized to separate the high expression group and low expression group. Patients with higher mRNA level of MAT1 tended to have shorter time to relapse [hazard ratio (HR): 1.34 (1.20–1.50), P<0.001] (Figure 8A) and metastasis [HR: 1.41 (1.16–1.72), P<0.001] (Figure 8B) among the overall population. Furthermore, a higher amount of mRNA of MAT1 was also correlated with worse relapse-free survival (RFS) [HR: 1.61 (1.35–1.91), P<0.001] (Figure 8C) and metastasis-free survival (MFS) [HR: 1.57 (1.15–2.14), P=0.004] (Figure 8D) among luminal A subpopulation. In addition, similar results were obtained among the luminal B subpopulation, in which high MAT1 mRNA expression was an unfavorable prognostic factor for RFS [HR: 1.64 (1.34–2.01), P<0.001] (Figure 8E) and MFS [HR: 1.73 (1.21–2.47), P=0.002] (Figure 8F). Basal-like breast cancer patients with higher mRNA level of MAT1 displayed shorter time free from relapse [HR: 1.48 (1.10–1.98), P=0.009] (Figure 8G) and metastasis [HR: 2.37 (1.17–4.83), P=0.014] (Figure 8H). However, there was no significant association between the quantity of MAT1 mRNA and the clinical outcomes of patients with HER2-enriched breast cancer.
Discussion
During the past decade, precise medicine has been one of the greatest achievements in breast cancer treatment. Personal treatment according to molecular subtypes successfully improves the prognosis of breast cancer patients. Better curative effect depends upon the identification of novel molecular biomarkers that drive tumor initiation and progression. Several studies have reported that MAT1 plays role in some cancer types, such as pancreatic cancer (19), lung cancer (20), and colorectal cancer (21). However, there is still a lack of evidence in breast cancer.
KEGG pathway analysis is a common strategy for exploring functions of unknown genes. The present KEGG pathway analysis revealed the involvement of MAT1 in cell proliferation, adhesion, and apoptosis. The dysregulation of these pathways could drive tumor initiation and development. Consistently, correlation analysis revealed that MAT1 mRNA level was positively associated with proliferative genes and inversely correlated with apoptosis markers. In terms of the pivotal roles that PI3K-AKT signaling plays in cell proliferation, PI3K inhibitors arrest cell cycle progression and have been developed for cancer treatment (28). In combination with CDK7 and cyclin H, MAT1 constitutes CAK and promotes cell cycle progression and proliferation. The abrogation of MAT1 deregulates CAK and inhibits cell cycle G1 stage exit by suppressing cyclin E expression and phosphorylation of the Rb protein (10). The complete MAT1 protein has been associated with the expansion of human hematopoietic stem cells (HSC), while intrinsically programmed or MAT1 fragmentation comes along with granulocytic differentiation of HSC or leukemic myeloblasts (29). MAT1 fragmentation inversely regulates the activities of CAK and TFIIH to inhibit cell cycle progression and gene transcription, resulting in the suppression of the growth and metastasis of different leukemic myeloblasts (29).
Based on the results of KEGG pathway analysis, MAT1 might participate in ERBB2 signaling. HER2+ tumors account for approximately 30% of all breast cancer cases. Although targeted therapy remarkably improves the treatment efficiency for HER2-enriched patients (30,31), there are still some patients who fail to benefit from these targeted drugs. Identification of the relative genes of ERBB2 might further enhance therapy efficiency. Our IHC results indicated that HER2-overexpressing tumors had high MAT1 expression at both the mRNA and protein levels, and correlation analysis implied a positive correlation between MAT1 and ERBB2. These results suggest that MAT1 might be a molecular target of ERBB2.
Both IHC and gene expression analysis showed that luminal-type had relatively higher MAT1 expression in comparison with basal-like breast cancer patients. MAT1 was also positively associated with the status of ER and PR both at mRNA and protein levels. In support of this, correlation analysis displayed that the amount of MAT1 mRNA was positively associated with ESR1, PGR, KRT8 and KRT18, and inversely associated with basal-like marker EGFR.
Epithelial-mesenchymal transition (EMT) is a complex process that is involved in the invasion, metastasis, and CSC property of tumors (32). CSCs are intrinsically endowed with powerful ability of self-renewal and multi-way differentiation potential, and are responsible for cancer initiation and progression (32). A variety of oncogenes and anti-oncogenes exert their effects through the modulation of EMT and CSCs (23). Interestingly, correlation analysis in this study showed that MAT1 mRNA level was positively correlated with epithelial marker TJP3 and was inversely associated with the mesenchymal marker VIM and the CSC markers YBX1 and SOX2. In addition, MAT1 mRNA expression was positively correlated with MAZ and SIX1, two known oncogenes in breast cancer. MAZ functions as a transcription factor and promotes tumor progression (33,34), and the oncogene SIX1 drives cancer development and could serve as a prognostic biomarker predicting poor clinical outcomes (35,36). Correlation analysis showed a positive correlation between MAT1 and these molecules at the mRNA level. Furthermore, immunofluorescence staining indicated that over-expression of MAT1 contributed to the upregulation of EGFR, vimentin, Sox2, and SIX1 at the protein level, which was consistent with the results at the mRNA level.
Commonly accepted parameters for assessing prognosis include overall survival (OS), RFS and MFS. Our results indicated that MAT1 mRNA level did not significantly affect the OS of breast cancer patients, but predicted poor RFS and MFS among whole breast cancer, luminal and basal-like populations. The unfavorable role of MAT1 in prognosis might be explained by that MAT1 promoted proliferation and suppressed apoptosis. In pancreatic cancer, silencing MAT1 can suppress the growth of cancer cells in vitro and in vivo (19). The knockdown of MAT1 in BxPC3 pancreatic cancer cells by siRNA remarkably arrests cells in the G0/G1 phase (19). The weight and volume of transplanted tumors in MAT1-knockdown injected nude mice were reported to be remarkably reduced than those in the controls (19). Among colorectal cancer patients treated with oxaliplatin, variant alleles of MAT1 were linked to better OS in comparison with patients without these variant alleles (21), suggesting that MAT1 might modulate drug response. However, there was an opposite tendency among patients who had not received oxaliplatin treatment (21).
There are some limitations in this study. Firstly, our IHC analysis was carried out on a small set of cases. Secondly, only univariate analysis of the survival analysis was performed, since the multivariate analysis was not available in this public database for breast cancer section. Thus, statistical analyses on larger datasets are needed.
Conclusions
MAT1 appears to promote the proliferation pathway and inhibit apoptosis signaling. Furthermore, MAT1 expression was positively related to the status of ER and ESR1, and was enriched in luminal and HER2-overexpressing tumors in comparison with basal-like cancer at both the protein and mRNA levels. Importantly, a high mRNA level of MAT1 was an unfavorable prognostic marker for breast cancer patients, predicting poor RFS and MFS, especially for the luminal-type population. Further research concerning the molecular mechanisms of MAT1 functions is required.
Acknowledgements
This study was supported by the National Natural Science Foundation of China (Grant No. 81572608 and 81172422), and the Wuhan Science and Technology Bureau (Grant No. 2017060201010170).
Footnote
Conflicts of Interest: The authors have no conflicts of interest to declare.
References
- Siegel RL, Miller KD, Jemal A. Cancer Statistics, 2017. CA Cancer J Clin 2017;67:7–30. [PubMed] DOI:10.3322/caac.21387
- Hu X, Huang W, Fan M. Emerging therapies for breast cancer. J Hematol Oncol 2017;10:98. [PubMed] DOI:10.1186/s13045-017-0466-3
- Yu S, Li A, Liu Q, et al. Chimeric antigen receptor T cells: a novel therapy for solid tumors. J Hematol Oncol 2017;10:78. [PubMed] DOI:10.1186/s13045-017-0444-9
- Zhang P, Tong Z, Tian F, et al. Phase II trial of utidelone as monotherapy or in combination with capecitabine in heavily pretreated metastatic breast cancer patients. J Hematol Oncol 2016;9:68. [PubMed] DOI:10.1186/s13045-016-0297-7
- Li H, Shao B, Yan Y, et al. Efficacy and safety of trastuzumab combined with chemotherapy for first-line treatment and beyond progression of HER2-overexpressing advanced breast cancer. Chin J Cancer Res 2016;28:330–8. [PubMed] DOI:0.21147/j.issn.1000-9604.2016.03.07
- Yan M, Lv HM, Zhang MW, et al. Maintenance treatment of trastuzumab for patients with advanced breast cancer to achieve long term survival: two case reports and literature review. Chin J Cancer Res 2014;26:486–92. [PubMed] DOI:10.3978/j.issn.1000-9604.2014.08.10
- Xu H, Yu S, Liu Q, et al. Recent advances of highly selective CDK4/6 inhibitors in breast cancer. J Hematol Oncol 2017;10:97. [PubMed] DOI:10.1186/s13045-017-0467-2
- Kaldis P. The cdk-activating kinase (CAK): from yeast to mammals. Cell Mol Life Sci 1999;55:284–96. [PubMed] DOI:10.1007/s000180050290
- Fouillen L, Abdulrahman W, Moras D, et al. Analysis of recombinant phosphoprotein complexes with complementary mass spectrometry approaches. Anal Biochem 2010;407:34–43. [PubMed] DOI:10.1016/j.ab.2010.07.006
- Wu L, Chen P, Shum CH, et al. MAT1-modulated CAK activity regulates cell cycle G(1) exit. Mol Cell Biol 2001;21:260–70. [PubMed] DOI:10.1128/MCB.21.1.260-270.2001
- Poon RY, Yamashita K, Adamczewski JP, et al. The cdc2-related protein p40MO15 is the catalytic subunit of a protein kinase that can activate p33cdk2 and p34cdc2. EMBO J 1993;12:3123–32. [PubMed]
- Fisher RP, Morgan DO. A novel cyclin associates with MO15/CDK7 to form the CDK-activating kinase. Cell 1994;78:713–24. [PubMed] DOI:10.1016/0092-8674(94)90535-5
- Mäkelä TP, Tassan JP, Nigg EA, et al. A cyclin associated with the CDK-activating kinase MO15. Nature 1994;371:254–7. [PubMed] DOI:10.1038/371254a0
- Helenius K, Yang Y, Tselykh TV, et al. Requirement of TFIIH kinase subunit Mat1 for RNA Pol II C-terminal domain Ser5 phosphorylation, transcription and mRNA turnover. Nucleic Acids Res 2011;39:5025–35. [PubMed] DOI:10.1093/nar/gkr107
- Reardon JT, Ge H, Gibbs E, et al. Isolation and characterization of two human transcription factor IIH (TFIIH)-related complexes: ERCC2/CAK and TFIIH. Proc Natl Acad Sci U S A 1996;93:6482–7. [PubMed] DOI:10.1073/pnas.93.13.6482
- Roy R, Adamczewski JP, Seroz T, et al. The MO15 cell cycle kinase is associated with the TFIIH transcription-DNA repair factor. Cell 1994;79:1093–101. [PubMed] DOI:10.1016/0092-8674(94)90039-6
- Svejstrup JQ, Vichi P, Egly JM. The multiple roles of transcription/repair factor TFIIH. Trends Biochem Sci 1996;21:346–50. [PubMed] DOI:10.1016/S0968-0004(96)10046-3
- Heithaus JL, Davenport S, Twyman KA, et al. An intragenic deletion of the gene MNAT1 in a family with pectus deformities. Am J Med Genet A (in Chinese) 2014;164A:1293–7. [PubMed] DOI:10.1002/ajmg.a.36445
- Liu JP, Yuan SZ, Zhang SN. Experimental study of MAT1 gene silencing mediated by siRNA in pancreatic cancer. Zhonghua Yi Xue Za Zhi 2007;87:2719–23. [PubMed] DOI:10.3760/j.issn:0376-2491.2007.38.015
- Li Y, Jin G, Wang H, et al. Polymorphisms of CAK genes and risk for lung cancer: a case-control study in Chinese population. Lung cancer 2007;58:171–83. [PubMed] DOI:10.1016/j.lungcan.2007.06.016
- Kap EJ, Seibold P, Richter S, et al. Genetic variants in DNA repair genes as potential predictive markers for oxaliplatin chemotherapy in colorectal cancer. Pharmacogenomics J 2015;15:505–12. [PubMed] DOI:10.1038/tpj.2015.8
- Xu H, Wu K, Tian Y, et al. CD44 correlates with clinicopathological characteristics and is upregulated by EGFR in breast cancer. Int J Oncol 2016;49:1343–50. [PubMed] DOI:10.3892/ijo.2016.3639
- Xu H, Yu S, Yuan X, et al. DACH1 suppresses breast cancer as a negative regulator of CD44. Sci Rep 2017;7:4361. [PubMed] DOI:10.1038/s41598-017-04709-2
- Chu Q, Han N, Yuan X, et al. DACH1 inhibits cyclin D1 expression, cellular proliferation and tumor growth of renal cancer cells. J Hematol Oncol 2014;7:73. [PubMed] DOI:10.1186/s13045-014-0073-5
- Fromowitz FB, Viola MV, Chao S, et al. ras p21 expression in the progression of breast cancer. Hum Pathol 1987;18:1268–75. [PubMed] DOI:10.1016/S0046-8177(87)80412-4
- Hatzis C, Pusztai L, Valero V, et al. A genomic predictor of response and survival following taxane-anthracycline chemotherapy for invasive breast cancer. JAMA 2011;305:1873–81. [PubMed] DOI:10.1001/jama.2011.593
- Kao KJ, Chang KM, Hsu HC, et al. Correlation of microarray-based breast cancer molecular subtypes and clinical outcomes: implications for treatment optimization. BMC Cancer 2011;11:143. [PubMed] DOI:10.1186/1471-2407-11-143
- Janku F. Phosphoinositide 3-kinase (PI3K) pathway inhibitors in solid tumors: From laboratory to patients. Cancer Treat Rev 2017;59:93–101. [PubMed] DOI:10.1016/j.ctrv.2017.07.005
- Lou S, Liu G, Shimada H, et al. The lost intrinsic fragmentation of MAT1 protein during granulopoiesis promotes the growth and metastasis of leukemic myeloblasts. Stem Cells 2013;31:1942–53. [PubMed] DOI:10.1002/stem.1444
- Eroglu Z1, Tagawa T, Somlo G. Human epidermal growth factor receptor family-targeted therapies in the treatment of HER2-overexpressing breast cancer. Oncologist 2014;19:135–50. [PubMed] DOI:10.1634/theoncologist.2013-0283
- Li H, Shao B, Yan Y, et al. Efficacy and safety of trastuzumab combined with chemotherapy for first-line treatment and beyond progression of HER2-overexpressing advanced breast cancer. Chin J Cancer Res 2016;28:330–8. [PubMed] DOI:10.21147/j.issn.1000-9604.2016.03.07
- Xu H, Tian Y, Yuan X, et al. The role of CD44 in epithelial-mesenchymal transition and cancer development. Onco Targets Ther 2015;8:3783–92. [PubMed] DOI:10.2147/OTT.S95470
- Wang X, Southard RC, Allred CD, et al. MAZ drives tumor-specific expression of PPAR gamma 1 in breast cancer cells. Breast Cancer Res Treat 2008;111:103–11. [PubMed] DOI:10.1007/s10549-007-9765-7
- Smits M, Wurdinger T, van het Hof B, et al. Myc-associated zinc finger protein (MAZ) is regulated by miR-125b and mediates VEGF-induced angiogenesis in glioblastoma. FASEB J 2012;26:2639–47. [PubMed] DOI:10.1096/fj.11-202820
- Xu HX, Wu KJ, Tian YJ, et al. Expression profile of SIX family members correlates with clinic-pathological features and prognosis of breast cancer: A systematic review and meta-analysis. Medicine (Baltimore) 2016;95:e4085. [PubMed] DOI:10.1097/MD.0000000000004085
- Liu Q, Li A, Tian Y, et al. The expression profile and clinic significance of the SIX family in non-small cell lung cancer. J Hematol Oncol 2016;9:119. [PubMed] DOI:10.1186/s13045-016-0339-1