
Radiomics approach for preoperative identification of stages I−II and III−IV of esophageal cancer
Introduction
Esophageal cancer (EC), the eighth most frequent malignant disease and the sixth most prevalent cause of disease associated deaths worldwide, had an estimated 456,000 new cases and 400,000 deaths in 2012 (1). EC prognosis is strongly associated with the stage at diagnosis. Most of the patients diagnosed with EC tend towards the locally advanced stage and the 5-year survival rate is very low (less than 20%). However, for early stage (stage I−II) patients, the survival rate could be up to 85% (2,3). Additionally, surgical resection, chemoradiation or other optimal therapeutic approaches depend on accurate preoperative staging (4). Therefore, accurate preoperative staging is important for predicting prognosis and choosing a suitable therapeutic strategy for patients with EC.
In clinical practice, computed tomography (CT) is universally used for preoperative diagnostics and remains the mainstay for preoperative staging of EC. However, because of poor contrast resolution of the esophageal wall, it is difficult to distinguish the different histologic layers in CT. CT is mainly used to evaluate regional spread into the adjacent organization (T4) and distant metastases (M1) (5-7). Recently, the study of radiomics has become a hot field. Radiomics, a noninvasive, quantitative and low-cost approach, can objectively and comprehensively evaluate tumor heterogeneity by extracting high-throughput quantitative features from medical images through data characterization algorithms (8,9). These features have the potential to reveal disease characteristics and provide valuable information for personalized therapy (10,11). Some previous studies have shown that clinical parameters merged into quantitative radiomics features as a predictive biomarker or radionics signature could enhance predictive accuracy in oncology (12-14). Through texture analysis, some studies have shown that several texture features of the tumor, such as entropy and uniformity, were associated with an early or advanced stage in EC (15,16). However, using multiple imaging biomarkers to predict the stage of EC based on CT images has been unexplored. To our knowledge, there have been no reports about whether a radiomics approach could predict the stage of EC based on CT images.
We hypothesized that the radiomics approach could be helpful in differentiating stage I−II from stage III−IV EC. Tumor volume is an important independent prognostic indicator that was extensively researched (17,18). We excluded tumor volume from radiomics features and separately analyzed the discrimination performance for stage I−II and III−IV patients. Therefore, the purpose of this study was mainly to investigate the feasibility of preoperative staging using a radiomics approach based on CT images in patients with esophageal squamous cell carcinoma (ESCC).
Materials and methods
Patients
Institutional Review Board approval of Guangdong General Hospital, Guangdong Academy of Medical Sciences was obtained, and written informed consent was waived by the Institutional Review Board. The data of this study were collected from the Institutional Picture Archiving and Communication System for patients with ESCC who underwent radical surgery at Guangdong General Hospital, Guangdong Academy of Medical Sciences between January 2008 and August 2016. All the patients underwent an enhanced CT scan from the neck to the abdomen.
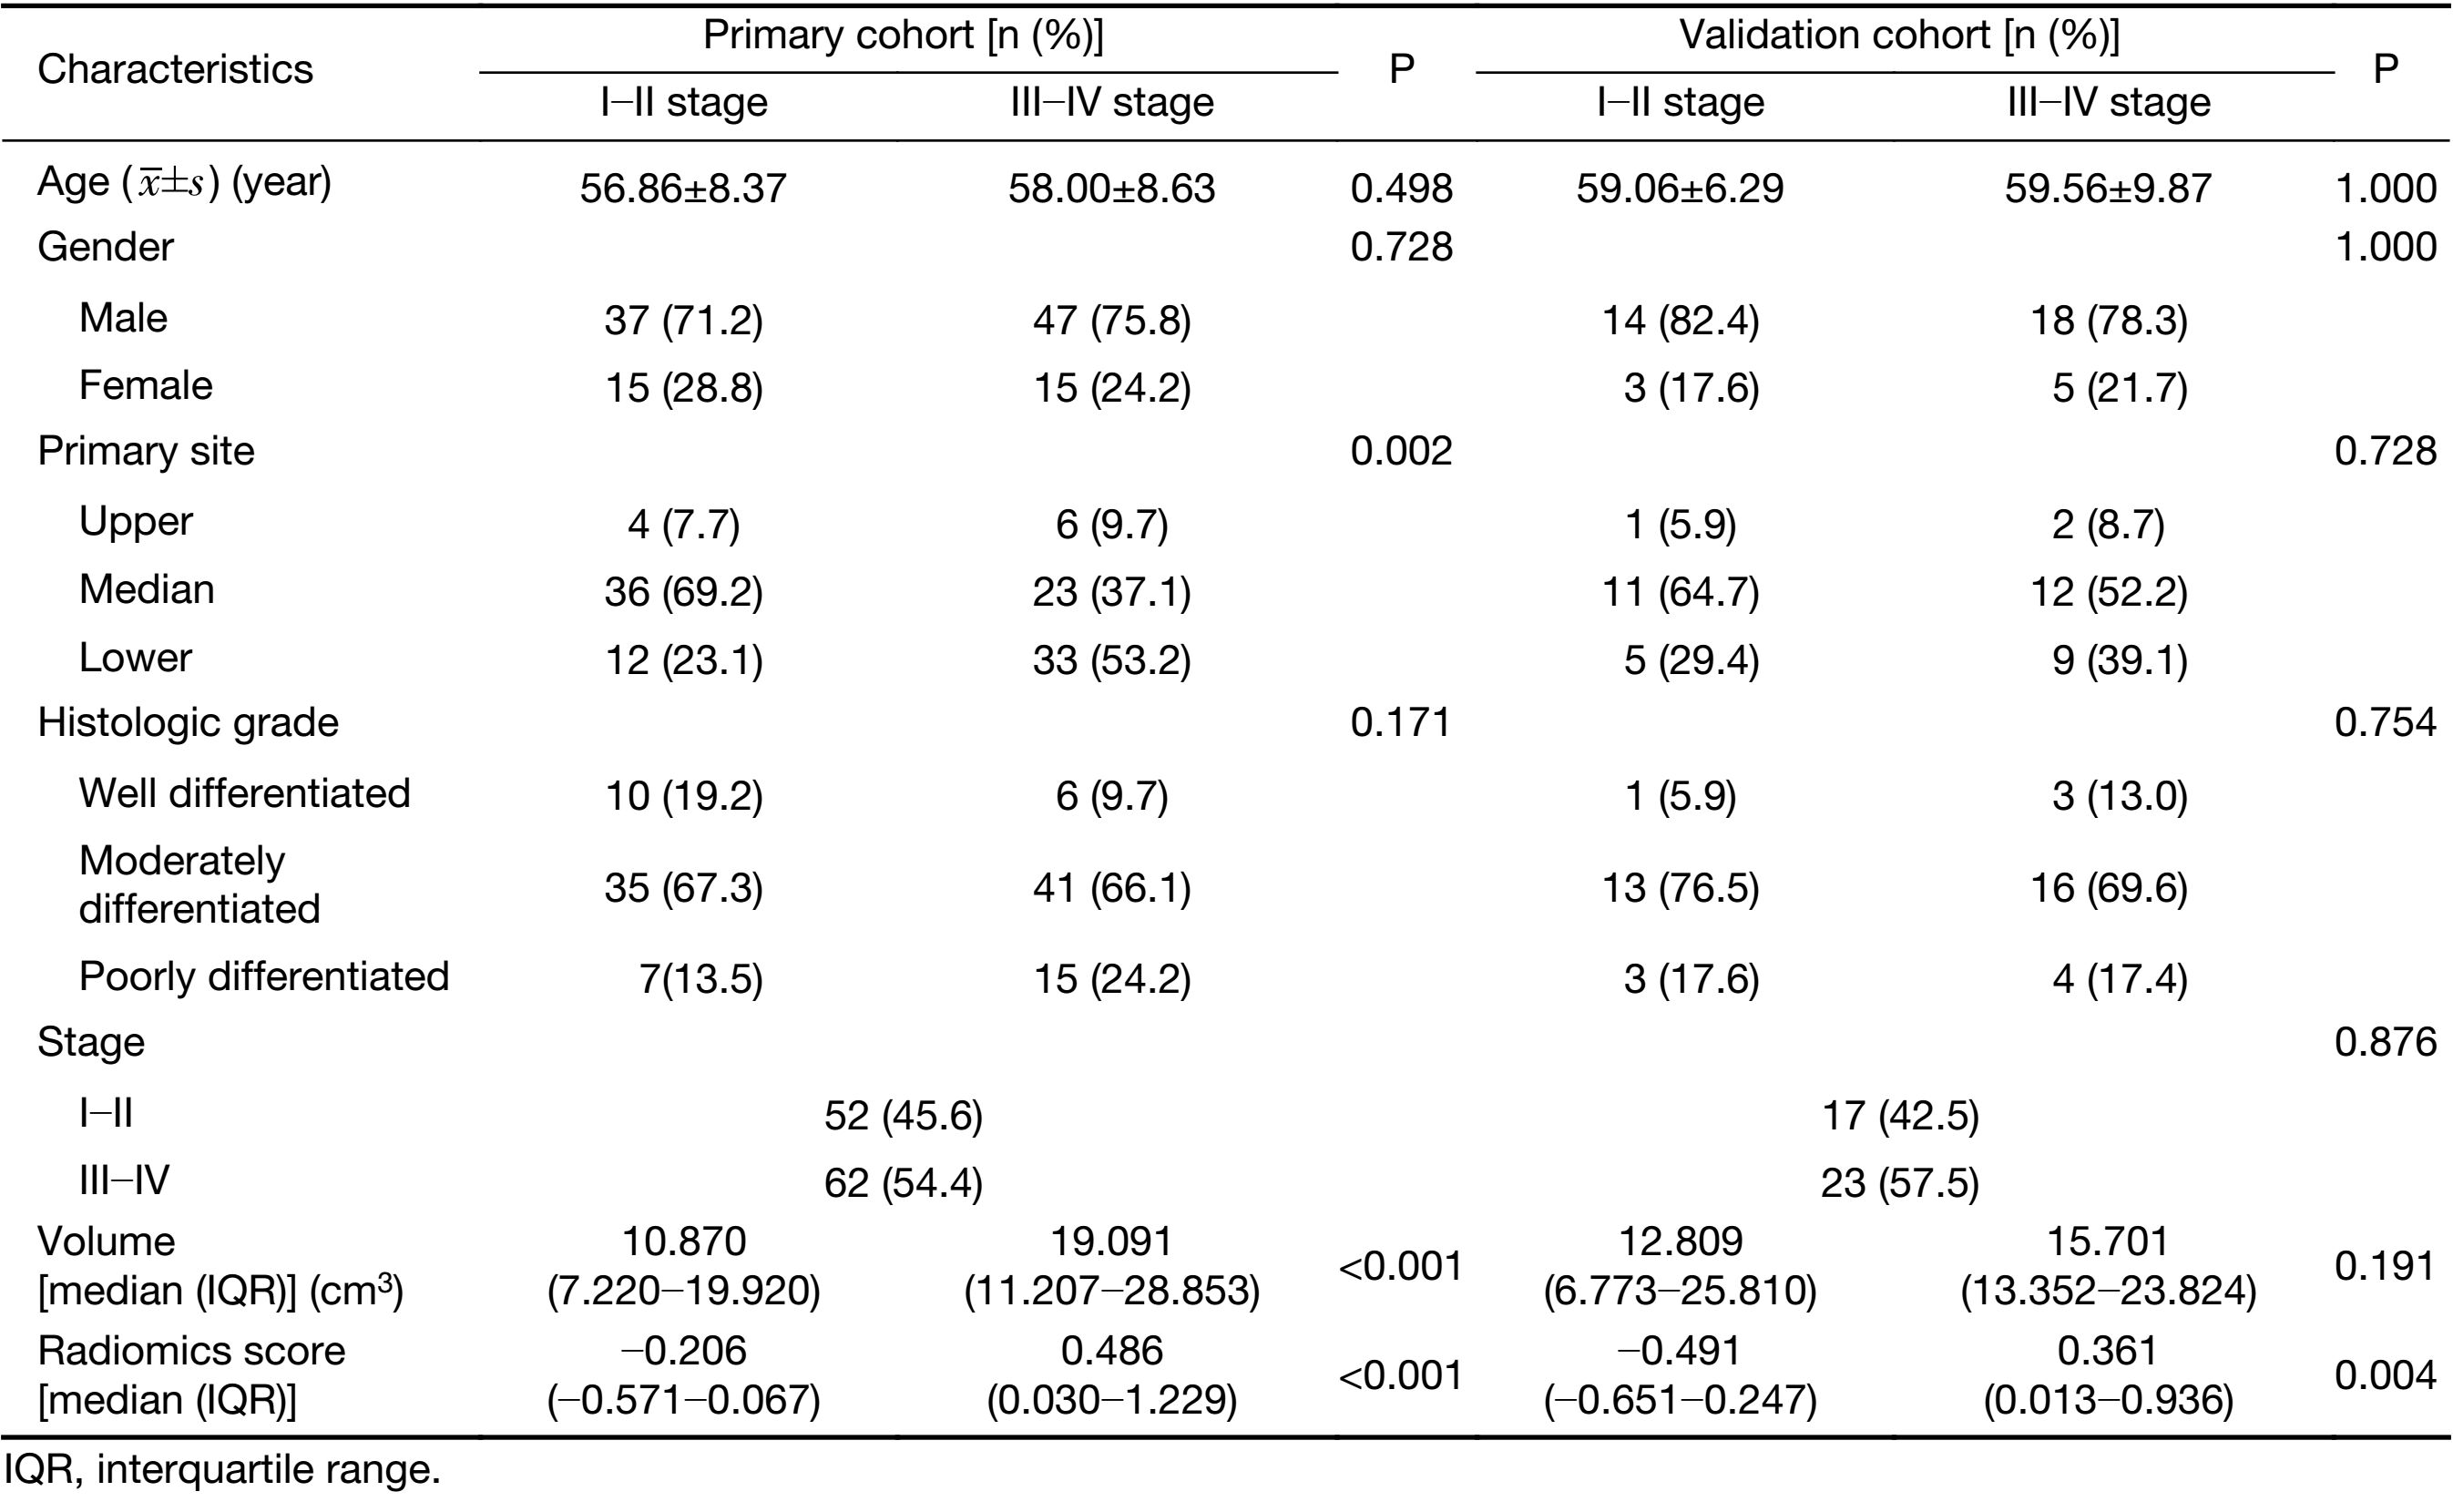
A total of 211 consecutive patients were initially enrolled in this study, of which 57 patients were excluded according to the following exclusion criteria: 1) clinicopathological information was incomplete (n=27); 2) pathologically diagnosed with adenocarcinoma (n=2); 3) cases with unknown histological grade (n=3); or 4) absence of preoperative contrast-enhanced CT (n=25). The remaining 154 patients were included in this study and met the following inclusion criteria: 1) pathologically confirmed ESCC; 2) underwent radical surgery for ESCC; 3) standard contrast-enhanced CT was performed within 1−2 weeks prior to surgery; and 4) complete clinical information was available. We randomly divided the data into primary cohort and validation cohort by a ratio of about 3:1. We trained models in the primary cohort and then validated models in the validation cohort. Tumor staging was performed according to the American Joint Committee on Cancer TNM Staging System Manual, 8th Edition (19). The clinicopathologic characteristics of patients in the primary and validation cohorts are presented in Table 1.
Full table
CT images acquisition and preprocessing
All patients underwent non-enhanced and contrast-enhanced CT of the esophagus performed using a 64-channel multi-detector CT scanner (LightSpeed VCT, GE Medical Systems, Milwaukee, Wis, USA). The acquisition parameters were as follows: 120 kV; 160 mAs; 0.5-second rotation time; detector collimation, 64 × 0.625 mm; field of view, 350 mm × 350 mm; and matrix, 512 × 512. After routine non-enhanced CT, contrast-enhanced CT was performed after a 25-second delay following intravenous administration of 85 mL of iodinated contrast material (Ultravist 370; Bayer Schering Pharma, Berlin, Germany) at a rate of 3.0 mL/s with a pump injector (Ulrich CT Plus 150, Ulrich Medical, Ulm, Germany). All images were reconstructed with a thick slice of 5.0 mm.
Although the CT images were obtained from the same scanner and the same protocol, the intensities of the images may vary because of some uncontrollable factors such as room humidity, temperature, slice location, etc. Those factors influenced the gray-level ranges and further affected the extraction of image features. We normalized segmented regions of interest (ROIs) to reduce the influence of image intensity variation via two steps: 1) Gray-level range selection: this step normalized image intensities into the range (μ–3σ, μ+3σ) (where μ is the gray-level mean, and σ is the gray-level standard deviation), as shown by Collewet et al. (20). 2) Image quantification: this step specifies the number of bits for each pixel to quantify the resulting gray-level range as follows (21):
| $P\left( x \right)=\left[ {Range \times \frac{{I\left( x \right) -{ \min}_{\,i \in \Phi }\;i}}{{\max {i_{i \in \Phi }} - {\min}_{\,i \in \Phi }\;i + 1}}} \right]$ |
Where Range is a discrete value (8, 16, 32, 64), I is the intensity of the original ROI, and Φ is the set of pixels in the ROIs area. Sixteen discrete values were adopted to resample normalization in this study.
Radiomics features extraction and interobserver reproducibility
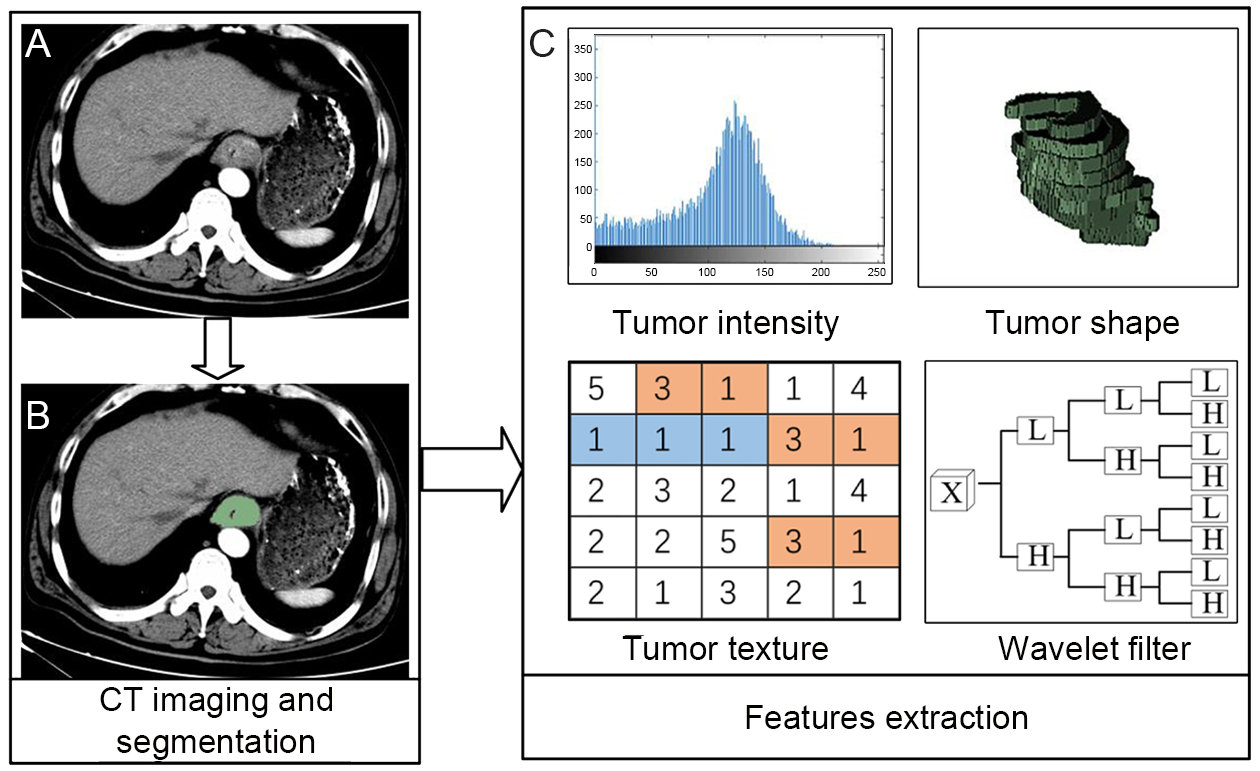
Radiomics features were extracted from late arterial phase CT images with a 5.0 mm thickness for ESCC patients (Figure 1). The methodology of radiomics feature extraction is presented in Supplementary Material S1. Quantitative radiomics features were conducted using in-house radiomics analysis software and executed in Matlab 2016b (Mathworks, Natick, USA). The radiomics features included the following categories: 1) first-order statistics features (8); 2) size and shape-based features (8); 3) texture features; and 4) wavelet features.
The ROI was manually outlined along the tumor boundaries on each slice by an experienced radiologist. Interobserver reproducibility was analyzed with randomly selected 30 patients’ images to delineate the ROIs by two experienced radiologists (doctors 1 and 2, with 11 and 13 years of clinical experience in chest CT interpretation, respectively), and the rest of images were outlined by doctor 1. We utilized interclass correlation coefficient (ICC) to determine the agreement in feature values between the observers.
Radiomics signature building and predictive performance
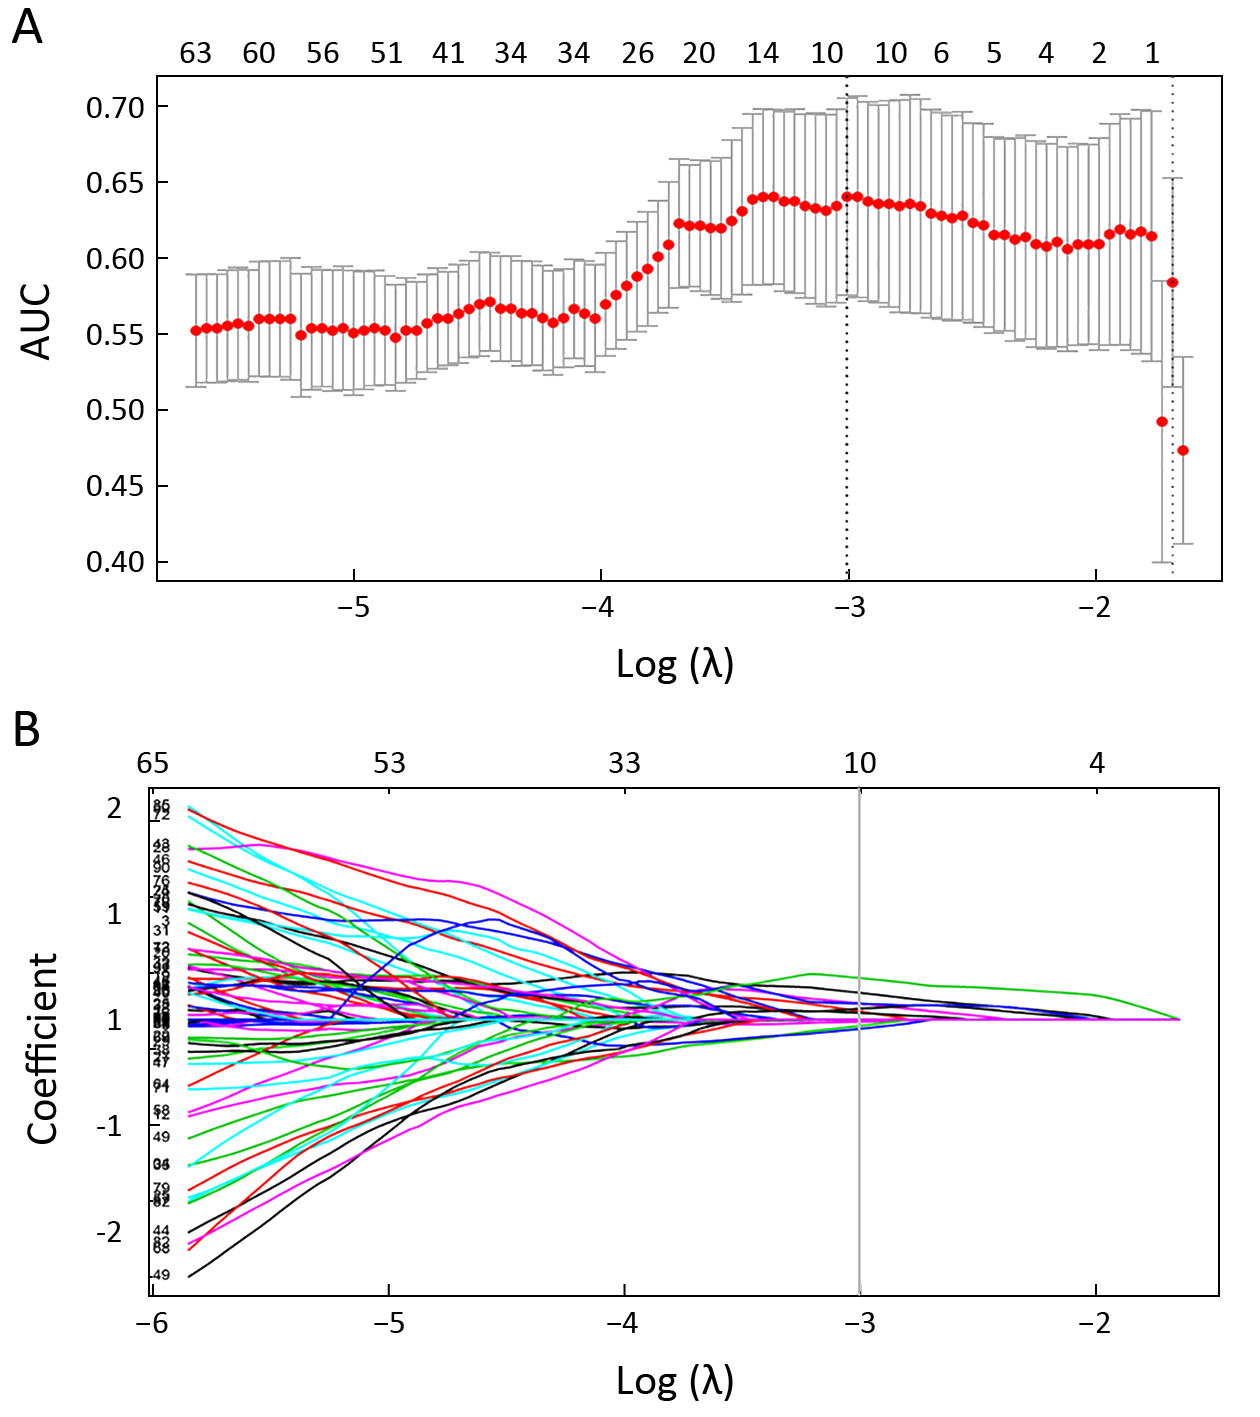
To eliminate the redundant features, we removed highly correlated features by calculating the correlation coefficient between the features. Then, the least absolute shrinkage and selection operator (Lasso) logistic regression model (22) was used to identify the most useful prognostic features. Lasso is a method of regression analysis that performs feature selection and regularization to improve the prediction accuracy via penalized estimation functions. This maximizes the area under the receiver operating characteristic curve (AUC) by tuning parameter (λ) selection and adopts 5-fold cross-validation via minimum criteria. Simultaneously, most covariate coefficients were shrunk to zero and the remaining variables with non-zero coefficients were selected by Lasso. Finally, the radiomics signature was built by combining those variables in the primary cohort and validated in the validation cohort. Radiomics score (Rad-score) was calculated for each ESCC patient in the primary and validation cohorts. We divided patients into stages I−II or III−IV according to the cutoff value of Rad-score. The higher the Rad-score, the higher the probability of stage III−IV.
We first assessed the potential association between radiomics signature and stage in the primary cohort and then validated it in the validation cohort using the Mann-Whitney U test. The discrimination and classification ability was adopted to estimate the predictive performance of radiomics signature. Receiver operating characteristic (ROC) curves were plotted for each cohort; the AUC, sensitivity, and specificity were calculated to evaluate the classification ability.
Predictive performance of tumor volume and combination model
A combination model, which combined volume into the radiomics signature, was built using a logistic regression model and the predictive performance was evaluated by means of discrimination. ROC curves were plotted and the AUC, sensitivity, specificity, and accuracy were calculated. Similarly, volume was used as a variable to establish a univariate regression model and evaluate the predictive performance as the combination model.
Comparison of predictive performance among volume, radiomics signature, and combination model
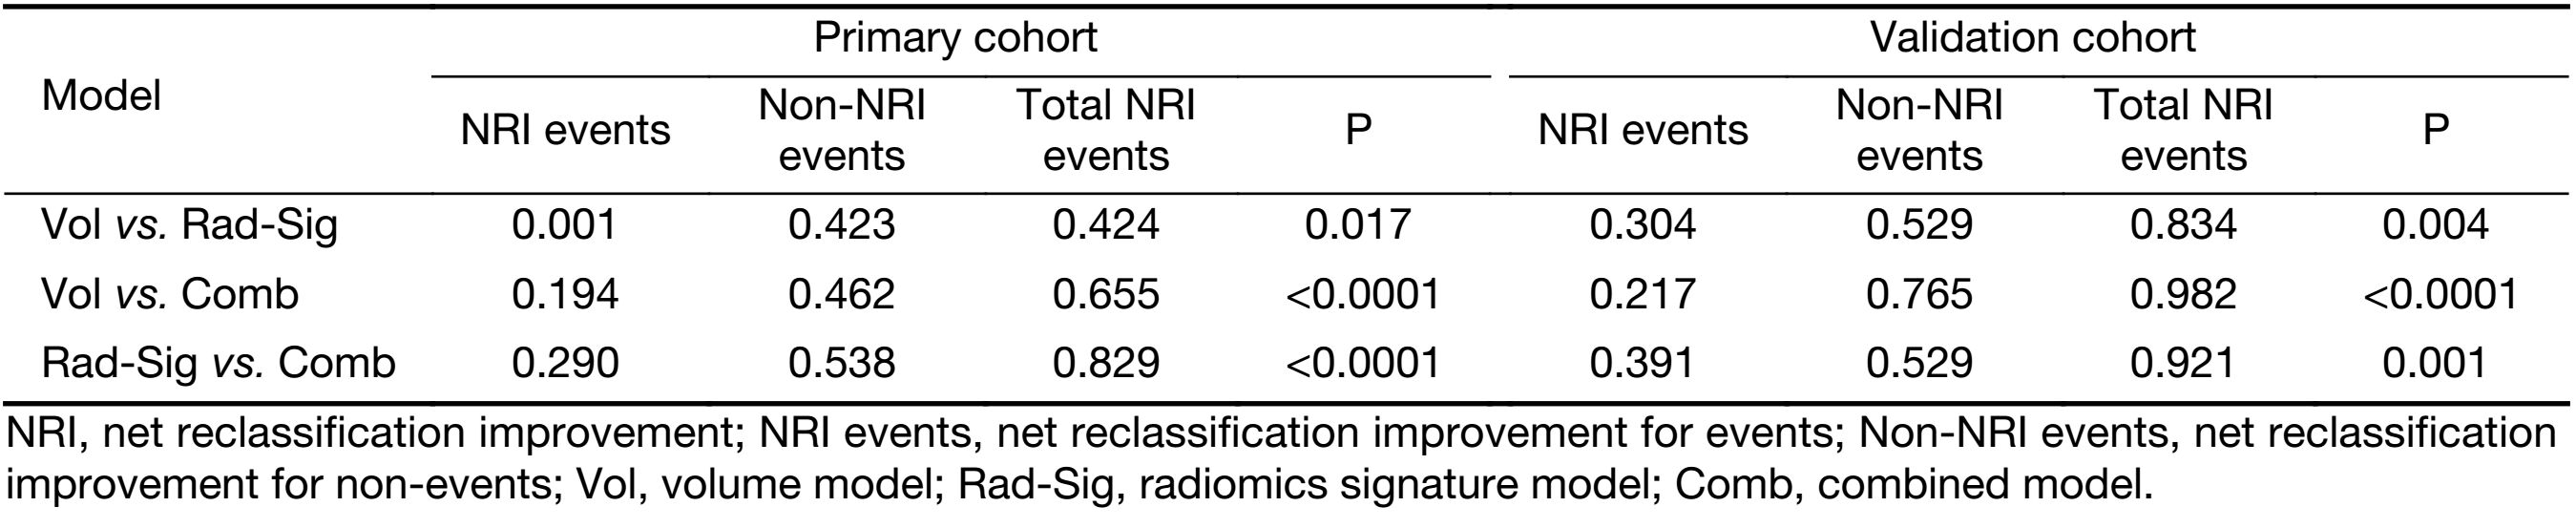
To compare the discrimination ability of those models on predictive performance in staging, we compared the difference of AUC of ROC among those models using the DeLong test in the primary and validation cohorts. The net reclassification improvement (NRI) was also considered in two cohorts. NRI is often used to quantify how well a new model reclassifies subjects compared with an old model (23). It is also used to assess whether one set of predictive effects is better than another. The value of NRI can be positive or negative. A positive value means a net improvement of the model in discrimination for patients’ tumor stage.
Statistical analysis
All statistical analysis was performed on R software (version 3.4.0, R Foundation for Statistical Computing, Vienna, Austria) in this study. The following R packages were used. The “glmnet” package was used for Lasso logistic regression. AUC values comparison was performed with the “pROC” package. The “Hmisc” package was used for calculating NRI. The “ggplot2” and “pROC” packages were used to draw ROC curves.
The statistical significance levels in this study were all two-sided, with P<0.05 considered as statistically significant. The difference test for gender, stage, tumor location, and histologic grade between the primary and validation cohorts was calculated by taking an independent samples Chi-square test. Continuous variables such as age, tumor volume, and radiomics score were analyzed using the Mann-Whitney U test.
Results
Clinical characteristics of patients
We retrospectively analyzed 154 patients with ESCC who were treated between 2008 and 2016 (stage I−II, n=69; stage III−IV, n=85). A total of 114 patients were assigned to the primary cohort (84 males and 30 females; mean age, 57.48±8.49 years), while 40 patients were assigned to the validation cohort (32 males and 8 females; mean age, 59.35±8.44 years). Clinical characteristics of patients in the primary and validation cohorts with stages I−II and III−IV are summarized in Table 1. There were no significant differences in gender, age, primary site, histologic grade, or tumor volume between the primary and validation cohorts (P=0.277−0.876).
Features dimension reduction and radiomics signature building
In total, we extracted 9,790 radiomics features from CT images. These may contain many redundant and highly correlated features. To find robust and valuable features, the following steps were performed:
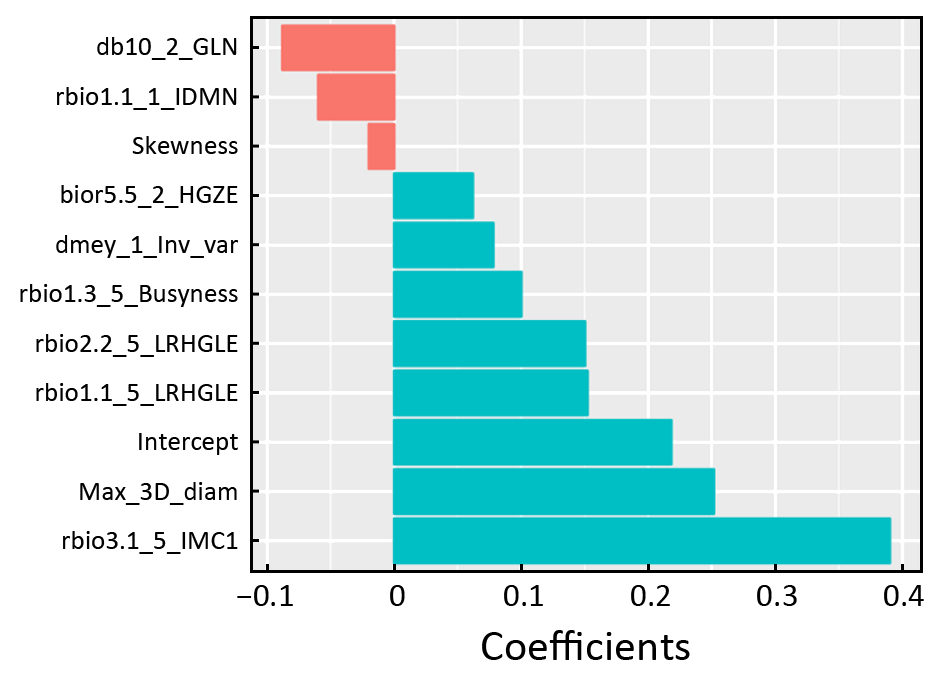
Features with ICC≥0.90 were identified as robust features. After robustness assessment, 6,140 features (ICC: 0.900−0.998) were selected from 9,790 features (ICC: 0.373−0.998). Then, the correlation coefficient was calculated for each pair of features to remove highly correlated features. The most predictive feature in each feature pair with correlation coefficient ≥0.9 was retained while the other feature was discarded. After highly correlated analysis, 218 features remained. Finally, 10 features were selected from 218 features with Lasso (Figure 2). All those calculations were implemented in the primary cohort. The radiomics signature was built with 10 selected features in the primary cohort and validated in the validation cohort. For linear models to produce a reasonable robust estimate, Peduzzi et al. (24,25) recommended that the number of observations per variable was at least 10. Therefore, it is reasonable to select 10 variables for 114 samples in the primary cohort. In addition, Rad-score was calculated by a Rad-score calculation formula that was constructed using those 10 selected variables. The Rad-score calculation formula is presented in Supplementary Material S2 and Supplementary Figure S1.
Predictive performance of radiomics signature
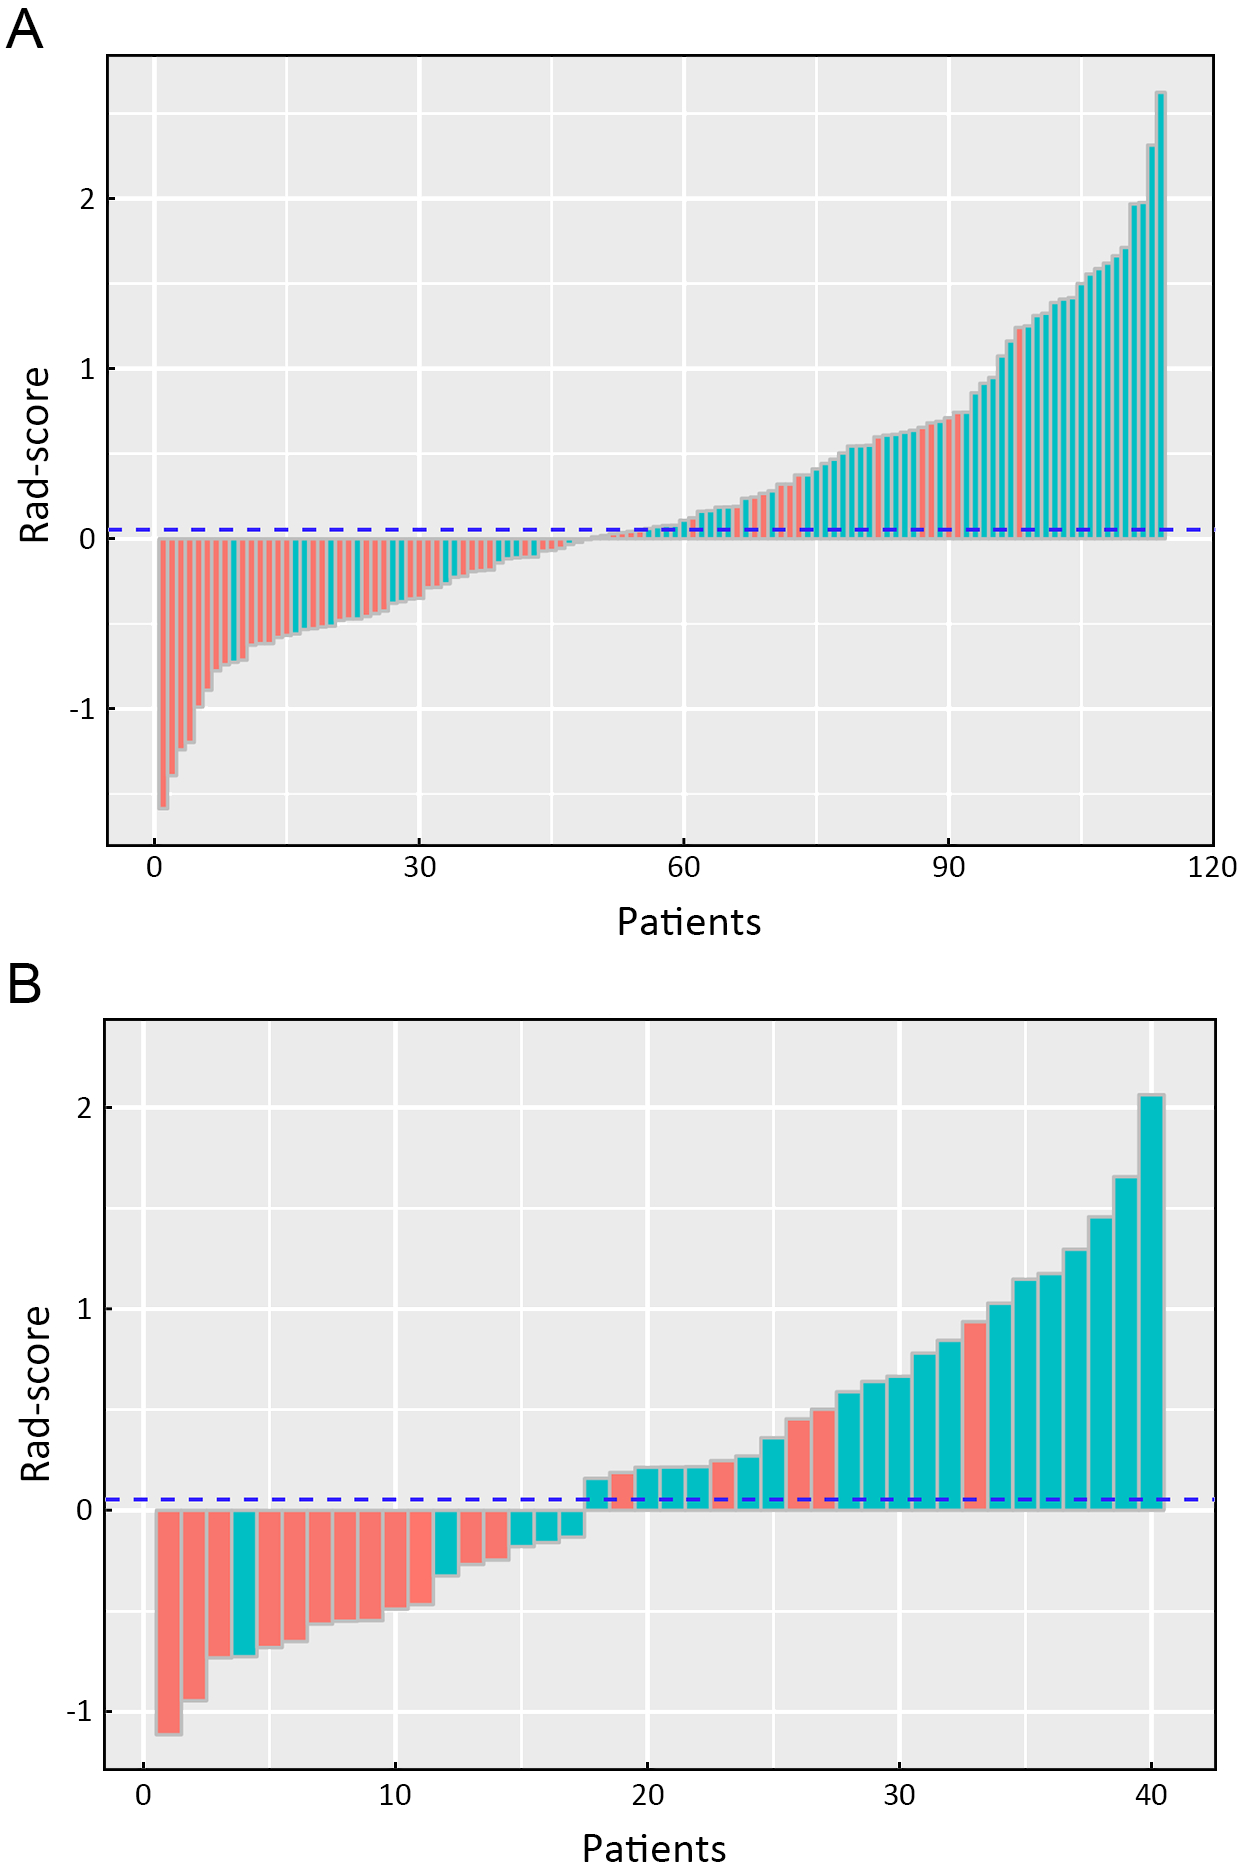
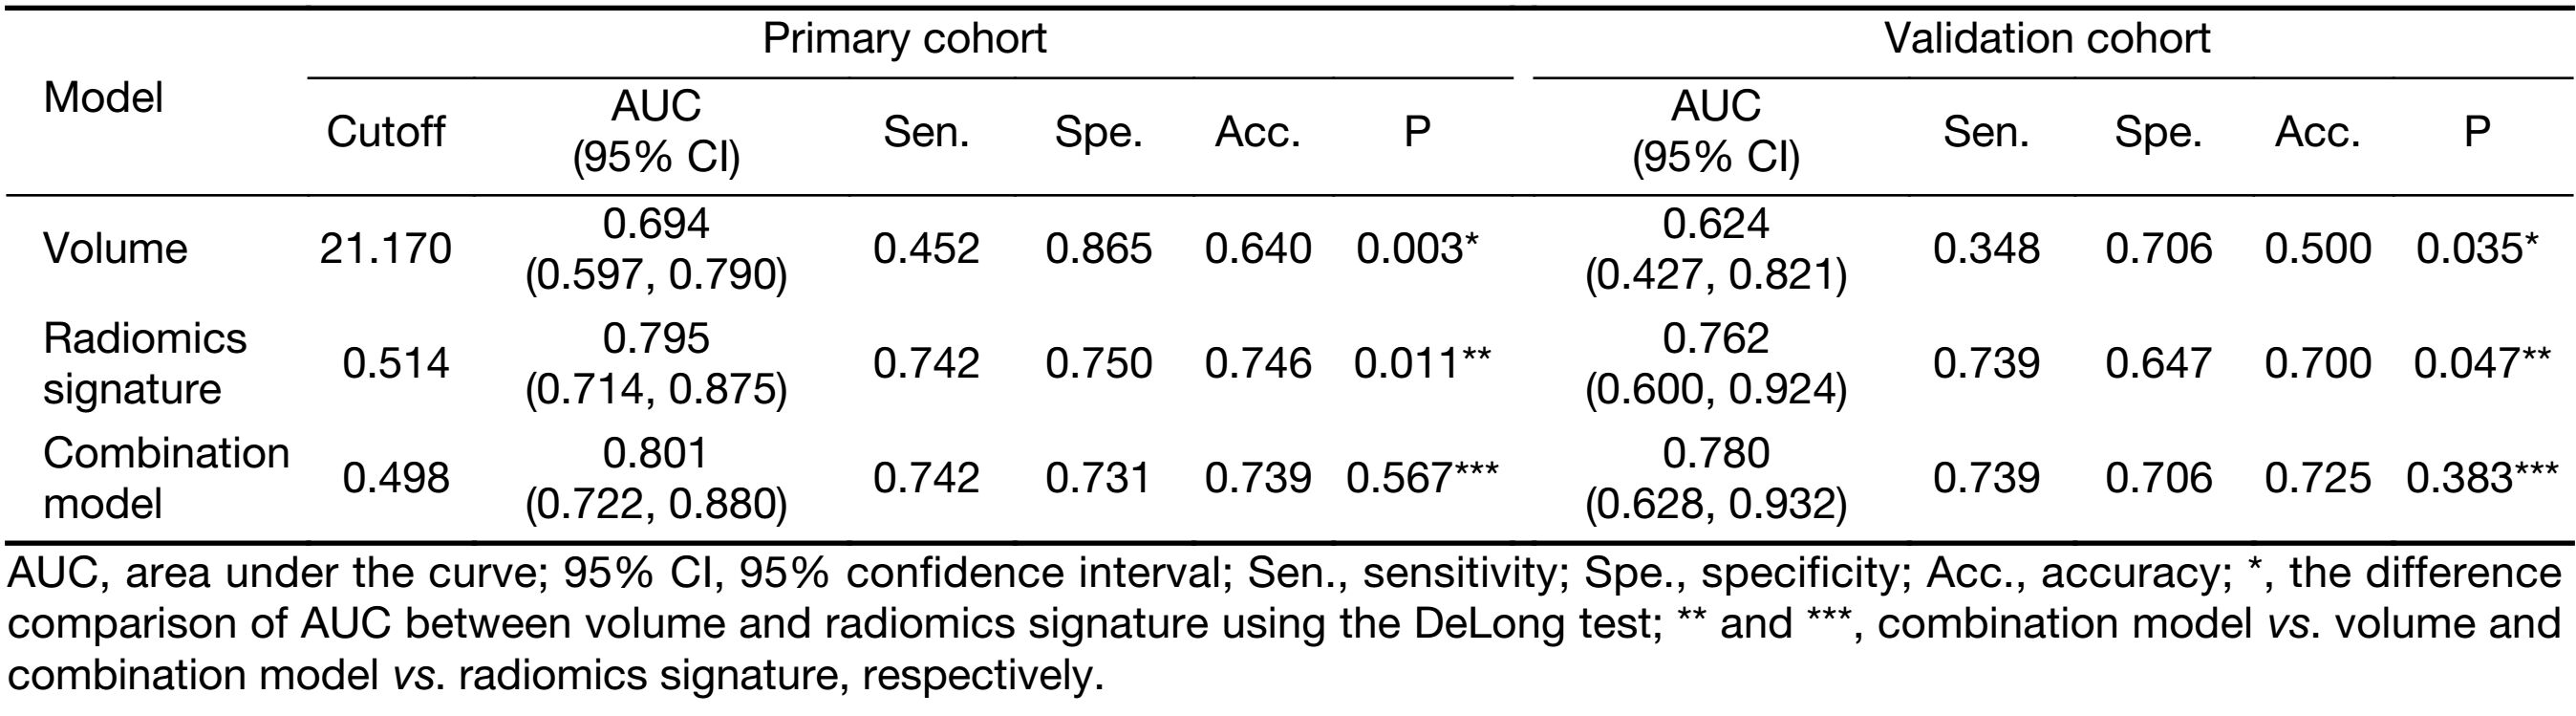
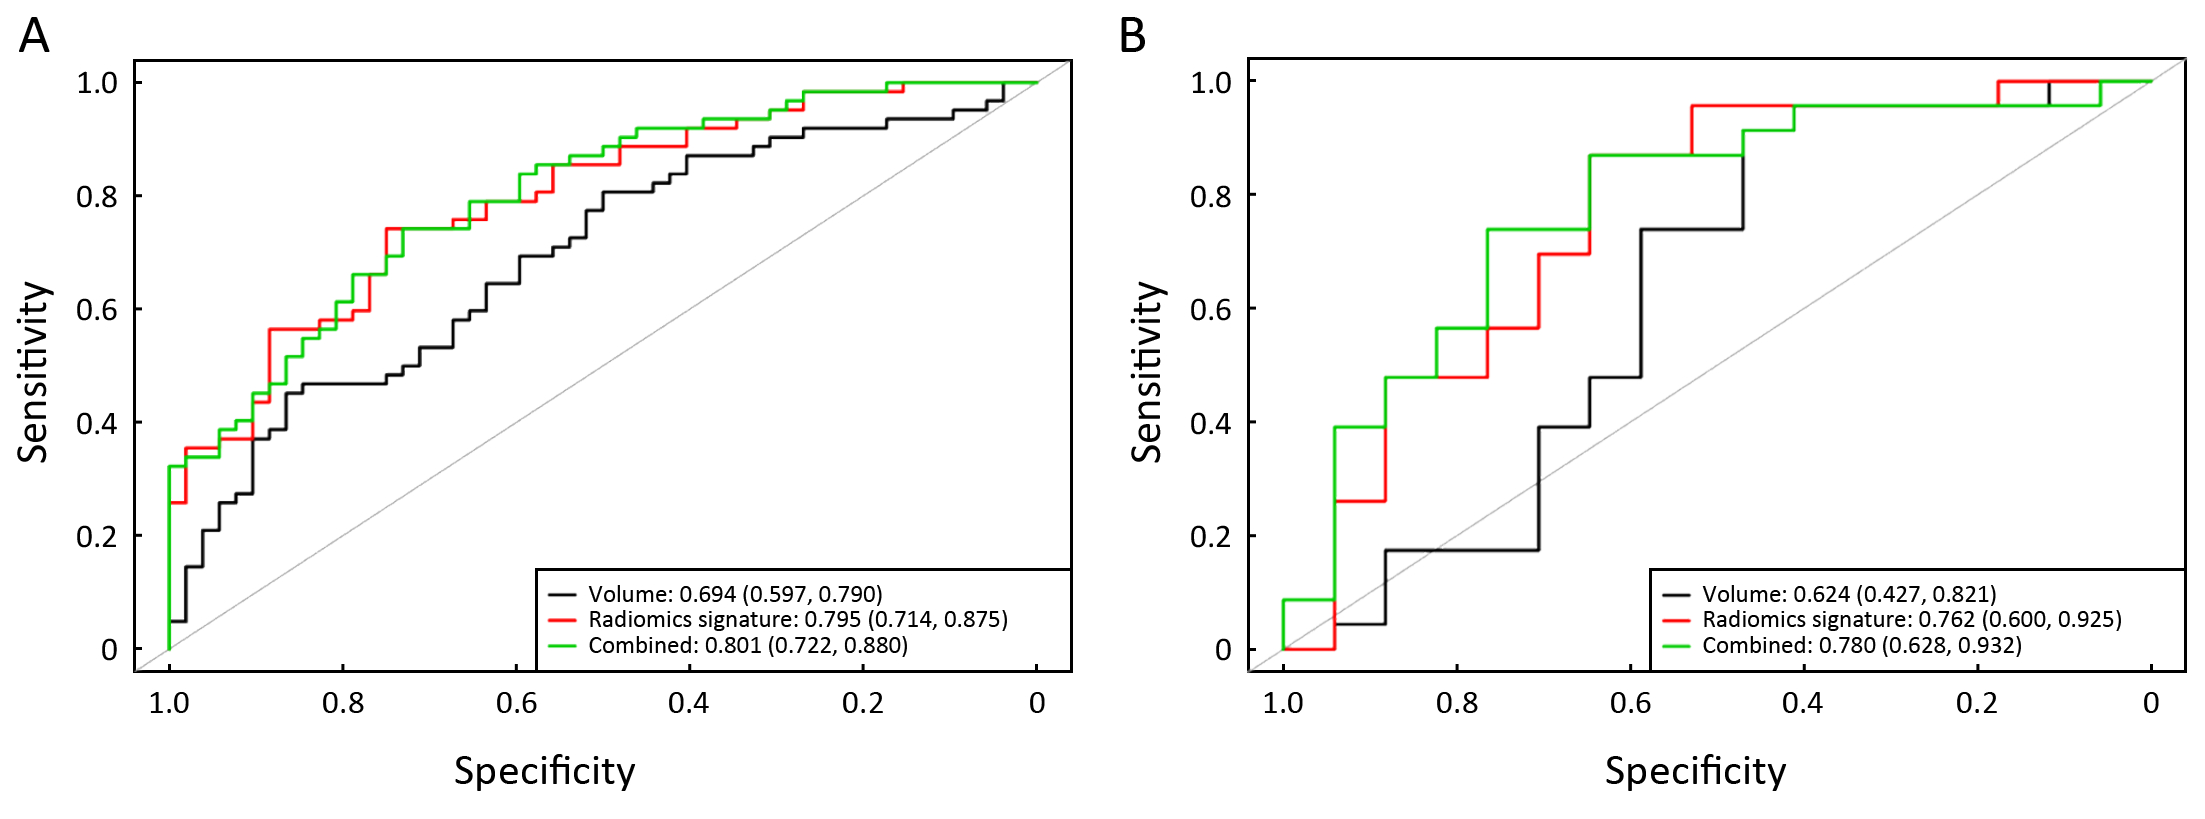
A significant difference in radiomics score was observed between stages I−II and III−IV in the primary cohort (P<0.001), which was validated in the validation cohort (P<0.001). Compared with stage I−II, patients who were in stage III−IV had a higher Rad-score in the primary (median: 0.486 vs. −0.206) and validation cohorts (median: 0.361 vs. −0.491). The radiomics signature shows a significant discrimination between stages I−II and III−IV. The AUC was 0.795 (95% CI: 0.714−0.875) in the primary cohort and 0.762 (95% CI: 0.600−0.924) in the validation cohort.
The radiomics signature performance of discrimination for stage I−II and III−IV ESCC in the primary and validation cohorts is presented using ROC curves in Supplementary Figure S2A, and the Rad-score for each patient in the primary and validation cohorts is shown in
Figure 3.
Predictive performance of volume and combination model
The predictive performance of volume for discrimination of stage I−II vs. III−IV yielded an AUC of 0.694 (95% CI: 0.597−0.790) and 0.624 (95% CI: 0.427−0.821) in primary and validation cohorts, respectively. The combination model, combining volume into the radiomics signature, yielded an AUC of 0.801 (95% CI: 0.722−0.880) in the primary cohort and 0.780 (95% CI: 0.628−0.932) in the validation cohort. The volume and combination model performance of discriminating stage I−II and III−IV ESCC in primary and validation cohorts is presented using ROC in Supplementary Figure S2B.
Comparison of predictive performance among volume, radiomics signature and combination model
The comparisons of predictive performance among volume, radiomics signature, and combination model were evaluated using the DeLong test. As shown in Table 2, there were significant differences between volume and radiomics signature and combined model in the primary and validation cohorts. Although there is no significant difference in predictive performance between the radiomics signature and combined model, the AUC, sensitivity, specificity, and accuracy of the combined model were better than those of the radiomics signature in the validation cohort. In addition, the NRIs among models were analyzed (Table 3).
Full table
Full table
Our results show that in discriminating between stage I−II and III−IV ESCC, the radiomics approach is superior to volume. The model of radiomics signature is better than volume (primary cohort: AUC, 0.795 vs. 0.694, P=0.003; validation cohort: AUC, 0.762 vs. 0.624, P=0.035); the combination model is better than volume (primary cohort: AUC, 0.801 vs. 0.694, P<0.011; validation cohort: AUC, 0.780 vs. 0.624, P=0.047). We further proved our results through analysis of the NRI (radiomics signature vs. volume: primary cohort, NRI=0.424, Z-statistics=2.37, P=0.017; validation cohort, NRI=0.834, Z-statistics=2.92, P=0.004; and combination model vs. volume: primary cohort, NRI=0.829, Z-statistics=3.74, P<0.0001; validation cohort, NRI=0.921, Z-statistics=3.83, P=0.001).
Discussion
In this study, we developed and validated a radiomics signature based on CT images for the preoperative individualized prediction of stage I−II or III−IV ESCC. Based on the significant difference in Rad-score, the radiomics signature successfully differentiated between stages I−II and III−IV of ESCC before treatment. Additionally, by comparing the volume, radiomics signature and combination model, our results showed that the radiomics approach has potential value in preoperative differentiation of stage I−II and III−IV ESCC.
In clinical practice, CT, magnetic resonance imaging (MRI), positron emission tomography (PET), and endoscopic ultrasound (EUS) have their own advantages and disadvantages in the staging of EC. The current UK guidelines recommended to combine these different modalities to stage EC, as each imaging modality provides unique staging information (26,27). Consolidating this unique information provided by these modalities is conducive to improving the probability of accurate staging. However, the use of these modalities is limited because they are expensive and time-consuming. CT is a low cost, readily available, and noninvasive imaging modality. Our study constructed a CT-based radiomics signature and demonstrated the potential to discriminate between stage I−II and III−IV ESCC. Currently, the primary role of CT is the detection of distant metastases in EC.
To build the radiomics signature, we selected 10 potential predictors from 6,140 candidate radiomics features by both eliminating highly correlated features and Lasso logistic regression. Most of the radiomics features’ regression coefficients were shrunk to zero by Lasso in the model fitting process. Thus, the established model is more easily interpreted. In addition, it not only selects potential predictors and combines them into the radiomics signature, but also avoids over fitting (28). In the radiomics approach in this study, like in most multimarker analyses (29-31), we combined several individual images for radiomics features to discriminate stage I−II and III−IV ESCC, and achieved a satisfactory discrimination (AUC: 0.795 in primary cohort; AUC: 0.762 in validation cohort). Compared with previous studies on tumor staging, the performance of the radiomics signature we built was better than those reported in lung (AUC: 0.762 vs. 0.64) (32) and colorectal cancers (AUC: 0.762 vs. 0.708) (33); the accuracy was higher than that reported in EC (accuracy <0.50) (34). Similarly, Dong et al. (35) used PET/CT images combined with texture features to stage ESCC and obtained a satisfying result (AUC: 0.789). Liu et al. (36) applied one texture feature that was extracted from CT images to identify ESCC with overall stage (I−II and III−IV) and achieved a good performance (AUC: 0.778). Although their results are slightly superior to our result, the studies of Donget al. (35) and Liu et al. (36) were limited by the lack of independent validation and the small sample size, and needed further study before they could be applied to clinical practice. As a possible alternative to preoperative staging, we constructed and validated a radiomics signature that can be used as an independent predictor to discriminate between stage I−II and III−IV ESCC.
The significant differences in AUC and NRI between volume and radiomics approaches indicate that the predictive performance of staging with the radiomics approach is better than that of volume. It is not surprising that the radiomics approach yielded a satisfactory performance in tumor staging. The tumor volume is a morphological characteristic that only reflects the size of the tumor, and the information it provides in tumor heterogeneity is limited. Nevertheless, the radiomics approach can more fully reveal the tumor heterogeneity and biological behaviors by combining the quantitative texture features and morphological features (8,9).
Some previous studies reported that the volume of ESCC could be used as a prognostic factor for radiotherapy and chemotherapy assessment, lymph node metastasis and tumor staging (15,37-39). However, the volume of the tumor showed poor discrimination ability in staging early and advanced EC compared with the radiomics approach in our study. Additionally, the accuracy was not significantly improved when volume was combined with the radiomics signature, and there was no significant difference between the radiomics signature and combined model. This may be due to two main reasons: 1) The volume may be a predictive factor in univariate analysis, but it is no longer an effective predictor when combined with other potential predictors in multivariate analysis; 2) Though contrast-enhanced CT images were adopted, CT can’t accurately reveal the length of EC and the depth of invasion, which can then affect the accuracy of the stage. Therefore, this suggests that we should take more predictive factors into account to reduce the deviations caused by the single predictor.
There were several limitations in our study. First, we used thick-slice CT images rather than thin-slice images for the radiomics approach. Zhao et al. (40) found that thin-slice images fully reflected texture features of tumor compared to thick-slice images. For the measurement of tumor volumes, thin-slice images had less measurement variability. We will further study the effect of thin-slice CT images for the staging of ESCC and compare it with thick-slice images to confirm whether the thick-slice images are comparable. Second, all data in this study are derived from the same institution, and our findings lack multi-center validation. We will further investigate whether the findings are applicable to other institutions. Third, the tumor length and the depth of tumor wall invasion were not included in this study. Zeybek et al. (41) found that tumor length and invasion depth were independent prognostic factors in predicting survival and tumor staging for EC. In the future, we will attempt to investigate the performance of adding those factors into our study.
Conclusions
This study explored the radiomics approach based on CT images as a feasible method to identify stage I−II and III−IV ESCC before treatment. We constructed a multi-feature radiomics model from extracted radiomics features. This model showed satisfactory performance in the preoperative identification of stage I−II and III−IV ESCC. Therefore, as a noninvasive and quantitative method, radiomics approach has the potential to guide individualized treatment decisions by preoperative staging.
Acknowledgements
All the authors have contributed significantly and have approved the manuscript. This work was supported by the National Key R&D Program of China (No. 2017YFC1309100), National Natural Scientific Foundation of China (No. 81771912), and Science and Technology Planning Project of Guangdong Province (No. 2017B020227012)
Footnote
Conflicts of Interest: The authors have no conflicts of interest to declare.
Supplementary Material S1
Radiomics feature extraction methodology
All the late arterial phase CT images with 5.0 mm thickness for esophageal cancer patients were obtained from PACS for tumor segmentation. Regions of interest (ROIs) along the contours of the whole tumor were delineated using 3D Slicer software (version 4.3, http://www.slicer.org). Quantitative CT images for radiomics analysis was conducted using in-house radiomics analysis software with algorithms executed in Matlab 2016b (Mathworks, Natick, USA). The radiomics features included the following categories: (I) first-order statistics features; (II) size and shape based features; (III) texture features; (IV) wavelet features. Texture features were extracted from gray level co-occurrence matrix (GLCM); gray level run length matrix (GLRLM); gray level size zone matrix (GLSZM); and neighborhood gray tone difference matrix (NGTDM) of images.
First order statistics features: First order statistics described the distribution of pixel intensities of the ROI. Seventeen first-order statistics features were extracted from the pixel matrix of ROI, such as energy, entropy, kurtosis, skewness, etc.
Size and shape-based features: This category of features describes the size and shape of tumor region. Eight features were extracted from the tumor region including volume, surface area, surface-to-volume ratio, maximum three-dimensional diameter, sphericity, spherical disproportion, compactness1, and compactness2.
Texture features: This group of features included four typical matrices: gray level co-occurrence matrix (GLCM), gray level run length matrix (GLRLM), gray level size zone matrix (GLSZM), and neighborhood gray tone difference matrix (NGTDM). GLCM is the matrix that describes the distribution of each pixel in distance and angle. GLCM reveals integrated information about the direction, interval, amplitude, and frequency of images by calculating the correlation between two gray levels. Twenty-two features were extracted from the GLCM. GLRLM is defined by the length of the consecutive pixels having the same gray level value. The number of pixels in the run on pictures represents the length of the run. A total of 14 features were extracted from GLRCM. GLSZM is the starting point of the Thibault matrices, which provided a statistical description by estimating the bivariate conditional probability density function of the image distribution values, which included 13 features. NGTDM describes a grayscale difference between pixels with certain grayscale and their neighboring pixels. We calculated 5 features such as coarseness, contrast, busyness, complexity, and strength from NGTDM.
Wavelet features: three-dimensional wavelet transform was used to extract some information from images. A total of 29 wavelet basis functions are used: db1, db2, db3, db8, db10, sym2, sym3, sym4, coif1, coif2, bior1.1, bior1.3, bior2.2, bior2.8, bior3.1, bior3.7, bior4.4, bior5.5, bior6.8, dmey, rbio1.1, rbio1.3, rbio2.2, rbio2.8, rbio3.1, rbio3.9, rbio4.4, rbio5.5, rbio6.8. By turning the ratio of weight to band-pass sub-bands (LLH, LHL, LHH, HLL, HLH, HHL) and low- and high-frequency sub-bands (LLL and HHH), and applied for each wavelet basis function, we obtained different information from images. The ratio of 1/2, 2/3, 1, 3/2, 2 were used and marked by a number from 1 to 5.
Finally, we selected 10 radiomics features to build a radiomics signature using Lasso. Those features are as follows: Max_3D_diam, Skewness, dmey_1_Inv_var, rbio1.1_1_IDMN, db10_2_GLN, bior5.5_2_HGZE, rbio1.1_5_LRHGLE, rbio1.3_5_Busyness, rbio2.2_5_LRHGLE, rbio3.1_5_IMC1. The calculation formula are presented below:
Max_3D_diam: Abbreviation of maximum 3D diameter. A feature of size- and shape-based features, defined by the largest Euclidean distance between surface voxels of the volume of interest (VOI).
Skewness: A first order statistics feature that measures the asymmetry of the distribution of values about the Mean value. X denotes the three-dimensional image matrix with N voxels, X is the mean of X:
| $Skewness = \frac{{\frac{1}{N}\sum\nolimits_{i = 1}^N {{{\left( {X\left( i \right) - \overline X } \right)}^3}} }}{{{{\sqrt {\frac{1}{N}\sum\nolimits_{i = 1}^N {{{\left( {X\left( i \right) - \overline X } \right)}^2}} } }^3}}}$ |
dmey_1_Inv_var: The inverse variance in gray level co-occurrence matrix features with the wavelet basis function of dmey and the ratio of 1/2.
| $Inv\_var=\sum \nolimits_{i=1}^{{N_g}} \sum \nolimits_{j=1}^{{N_g}} \frac{{P\left( {i,j} \right)}}{{{{\left| {i - j} \right|}^2}}},i \ne j$ |
Where the P(i,j) is the co-occurrence matrix for specific θ and α.
Ng is the number of discrete intensity levels in the image.
rbio1.1_1_IDMN: Inverse difference moment normalized in gray level co-occurrence matrix features with the wavelet basis function of rbio1.1 and the ratio of 1/2.
| $IDMN=\sum \nolimits_{i=1}^{{N_g}} \sum \nolimits_{j=1}^{{N_g}} \frac{{P\left( {i,j} \right)}}{{1 + \left( {\displaystyle\frac{{{{\left| {i - j} \right|}^2}}}{{{N^2}}}} \right)}}$ |
rbio3.1_5_IMC1: Informational measure of correlation 1 in gray level co-occurrence matrix features with the wavelet basis function of rbio3.1 and the ratio of 2.
| $IMC1=\frac{{HXY - HXY1}}{{{\rm{max}}\left\{ {HX,HY} \right\}}}$ |
Where HXY1=$ - \sum \nolimits_{i=1}^{{N_g}} \sum \nolimits_{j=1}^{{N_g}} {\rm{P}}\left( {{\rm{i}},{\rm{j}}} \right){\log _2}\left[ {{p_x}\left( i \right){p_y}\left( j \right)} \right]$
HX=$-\sum \nolimits_{i=1}^{{N_g}} {{\rm{p}}_x}\left( {\rm{i}} \right){\log _2}\left[ {{p_x}\left( i \right)} \right]$ be the entropy of px
HY=$-\sum \nolimits_{j=1}^{{N_g}} {{\rm{p}}_y}\left( {\rm{j}} \right){\log _2}\left[ {{p_y}\left( j \right)} \right]$ be the entropy of py
Rbio1.1_5_LRHGLE, rbio2.2_5_LRHGLE: Long run high gray level emphasis in Gray Level Run Length Matrix features with the wavelet basis function of rbio1.1, rbio2.2 and the ratio of 2.
| $LRHGLE=\displaystyle\frac{{\mathop \sum \nolimits_{i=1}^{{N_g}} \mathop \sum \nolimits_{j=1}^{{N_r}} p\left( {i,j|\theta } \right){i^2}{j^2}}}{{\mathop \sum \nolimits_{i=1}^{{N_g}} \mathop \sum \nolimits_{j=1}^{{N_r}} \left[ {p\left( {i,j|\theta } \right)} \right]}}$ |
Where p(i,j) is the (i,j)th entry in the given run-length matrix for a given direction θ,
Ng the number of discrete intensity values in the image,
Nr the number of different run lengths,
Np the number of pixels in the image.
db10_2_GLN: Gray level non-uniformity in gray level size zone matrix features with the wavelet basis function of db10 and the ratio of 2/3.
| $GLN=\frac{{\mathop \sum \nolimits_{i=1}^{{N_g}} {{\left( {\mathop \sum \nolimits_{j=1}^{{N_g}} p\left( {i,j} \right)} \right)}^2}}}{{{N_z}}}$ |
Where p(i,j) is the normalized size zone matrix defined as p(i,j)=P(i, j)/Nz
P(i, j) is the size zone matrix.
Nz is the number of zones in the VOI, calculated by $\sum \nolimits_{i=1}^{{N_g}} \sum \nolimits_{j=1}^{{N_g}} P\left( {i,j} \right)$
bior5.5_2_HGZE: High gray-level zone emphasis in gray level size zone matrix features with the wavelet basis function of bior5.5 and the ratio of 2.
| $HGZE=\frac{{ \sum \nolimits_{i=1}^{{N_g}} \sum \nolimits_{j=1}^{{N_g}} P\left( {i,j} \right){i^2}}}{{ \sum \nolimits_{i=1}^{{N_g}} \sum \nolimits_{j=1}^{{N_g}} P\left( {i,j} \right)}}$ |
rbio1.3_5_Busyness: Busyness in neighboring gray tone difference matrix features with the wavelet basis function of rbio1.3 and the ratio of 2.
| $Busyness=\frac{{\mathop \sum \nolimits_{i=1}^{{N_g}} {p_i}{s_i}}}{{\mathop \sum \nolimits_{i=1}^{{N_g}} \mathop \sum \nolimits_{j=1}^{{N_g}} \left| {i{p_i} - j{p_j}} \right|}},{p_i},{p_j} \ne 0$ |
Supplementary Material S2
Radiomics score (Rad-score) calculation formula
Rad-score=0.218+0.252×Max_3D_diam–0.02×Skewness+
0.078×dmey_1_Inv_var–0.06×rbio1.1_1_IDMN–
0.088×db10_2_GLN+0.062×bior5.5_2_HGZE+
0.152×rbio1.1_5_LRHGLE+0.1×rbio1.3_5_Busyness+
0.15×rbio2.2_5_LRHGLE +0.39×rbio3.1_5_IMC1
The histogram (Supplementary Figure S1) of each feature weight in radiomics signature is shown as follows: Y axis shows the features in radiomics signature and X axis shows the weight of features. Red histogram represents negative weights and blue histogram represents positive weights.
References
- Torre LA, Bray F, Siegel RL, et al. Global cancer statistics, 2012. CA Cancer J Clin 2015;65:87–108. [PubMed] DOI:10.3322/caac.21262
- Pennathur A, Gibson MK, Jobe BA, et al. Oesophageal carcinoma. Lancet 2013;381:400–12. [PubMed] DOI:10.1016/s0140-6736(12)60643-6
- Chen W, Zeng H, Chen R, et al. Evaluating efficacy of screening for upper gastrointestinal cancer in China: a study protocol for a randomized controlled trial. Chin J Cancer Res 2017;29:294–302. [PubMed] DOI:10.21147/j.issn.1000-9604.2017.04.02
- Quint LE, Bogot NR. Staging esophageal cancer. Cancer Imaging 2008;8. DOI:10.1102/1470-7330.2008.9007
- Räsänen JV, Sihvo EI, Knuuti MJ, et al. Prospective analysis of accuracy of positron emission tomography, computed tomography, and endoscopic ultrasonography in staging of adenocarcinoma of the esophagus and the esophagogastric junction. Ann Surg Oncol 2003;10:954–60. [PubMed] DOI:10.1245/ASO.2003.12.002
- Rice TW. Clinical staging of esophageal carcinoma. CT, EUS, and PET. Chest Surg Clin N Am 2000;10:471–485. [PubMed]
- Romagnuolo J, Scott J, Hawes RH, et al. Helical CT versus EUS with fine needle aspiration for celiac nodal assessment in patients with esophageal cancer. Gastrointest Endosc 2002;55:648–54. [PubMed] DOI:10.1067/mge.2002.122650
- Aerts HJ, Velazquez ER, Leijenaar RT, et al. Decoding tumour phenotype by noninvasive imaging using a quantitative radiomics approach. Nat Commun 2014;5:4006. [PubMed] DOI:10.1038/ncomms5006
- Gillies RJ, Kinahan PE, Hricak H. Radiomics: Images Are More than Pictures, They Are Data. Radiology 2016;278:563–77. [PubMed] DOI:10.1148/radiol.2015151169
- Chicklore S, Goh V, Siddique M, et al. Quantifying tumour heterogeneity in 18F-FDG PET/CT imaging by texture analysis. Eur J Nucl Med Mol Imaging 2013;40:133–40. [PubMed] DOI:10.1007/s00259-012-2247-0
- Cook GJR, Siddique M, Taylor BP, et al. Radiomics in PET: principles and applications. Clinical & Translational Imaging 2014;2:269–76. [PubMed]
- Huang YQ, Liang CH, He L, et al. Development and validation of a radiomics nomogram for preoperative prediction of lymph node metastasis in colorectal cancer. J Clin Oncol 2016;34:2157–64. [PubMed] DOI:10.1200/jco.2015.65.9128
- Zhang B, Tian J, Dong D, et al. Radiomics features of multiparametric MRI as novel prognostic factors in advanced nasopharyngeal carcinoma. Clin Cancer Res 2017;23:4259–69. [PubMed] DOI:10.1158/1078-0432.CCR-16-2910
- Huang Y, Liu Z, He L, et al. Radiomics signature: a potential biomarker for the prediction of disease-free survival in early-stage (I or II) non-small cell lung cancer. Radiology 2016;281:947–57. [PubMed] DOI:10.1148/radiol.2016152234
- Li R, Chen TW, Hu J, et al. Tumor volume of resectable adenocarcinoma of the esophagogastric junction at multidetector CT: association with regional lymph node metastasis and N stage. Radiology 2013;269:130–8. [PubMed] DOI:10.1148/radiol.13122269
- Ganeshan B, Skogen K, Pressney I, et al. Tumour heterogeneity in oesophageal cancer assessed by CT texture analysis: preliminary evidence of an association with tumour metabolism, stage, and survival. Clin Radiol 2012;67:157–64. [PubMed] DOI:10.1016/j.crad.2011.08.012
- Sloof GW. Response monitoring of neoadjuvant therapy using CT, EUS, and FDG-PET. Best Pract Res Clin Gastroenterol 2006;20:941–57. [PubMed] DOI:10.1016/j.bpg.2006.04.004
- Créhange G, Bosset M, Lorchel F, et al. Tumor volume as outcome determinant in patients treated with chemoradiation for locally advanced esophageal cancer. Am J Clin Oncol 2006;29:583–7. [PubMed] DOI:10.1097/01.coc.0000242346.25229.48
- Rice TW, Ishwaran H, Ferguson MK, et al. Cancer of the esophagus and esophagogastric junction: An eighth edition staging primer. J Thorac Oncol 2017;12:36–42. [PubMed] DOI:10.1016/j.jtho.2016.10.016
- Collewet G, Strzelecki M, Mariette F. Influence of MRI acquisition protocols and image intensity normalization methods on texture classification. Magn Reson Imaging 2004;22:81–91. [PubMed] DOI:10.1016/j.mri.2003.09.001
- Liu J, Mao Y, Li Z, et al. Use of texture analysis based on contrast-enhanced MRI to predict treatment response to chemoradiotherapy in nasopharyngeal carcinoma. J Magn Reson Imaging 2016;44:445–55. [PubMed] DOI:10.1002/jmri.25156
- Tibshirani R. Regression shrinkage and selection via the lasso: a retrospective. J R Stat Soc Series B Stat Methodol 2011;73:273–82. DOI:10.1111/j.1467-9868.2011.00771.x>
- Leening MJ, Vedder MM, Witteman JC, et al. Net reclassification improvement: computation, interpretation, and controversies: a literature review and clinicianos guide. Ann Intern Med 2014;160:122–31. [PubMed] DOI:10.7326/m13-1522
- Peduzzi P, Concato J, Feinstein AR, et al. Importance of events per independent variable in proportional hazards regression analysis. II. Accuracy and precision of regression estimates. J Clin Epidemiol 1995;48:1503–10. [PubMed]
- Peduzzi P, Concato J, Kemper E, et al. A simulation study of the number of events per variable in logistic regression analysis. J Clin Epidemiol 1996;49:1373–9. [PubMed] DOI:10.1016/S0895-4356(96)00236-3
- Lowe VJ, Booya F, Fletcher JG, et al. Comparison of positron emission tomography, computed tomography, and endoscopic ultrasound in the initial staging of patients with esophageal cancer. Mol Imaging Biol 2005;7:422–30. [PubMed] DOI:10.1007/s11307-005-0017-0
- Allum WH, Blazeby JM, Griffin SM, et al. Guidelines for the management of oesophageal and gastric cancer. Gut 2011;60:1449–72. [PubMed] DOI:10.1136/gut.2010.228254
- Hepp T, Schmid M, Gefeller O, et al. Approaches to regularized regression - A comparison between gradient boosting and the lasso. Methods Inf Med 2016;55:422–30. [PubMed] DOI:10.3414/me16-01-0033
- Pulay AJ, Réthelyi JM. Multimarker analysis suggests the involvement of BDNF signaling and microRNA biosynthesis in suicidal behavior. Am J Med Genet B Neuropsychiatr Genet 2016;171:763–76. [PubMed] DOI:10.1002/ajmg.b.32433
- Kubisch I, de Albuquerque A, Schuppan D, et al. Prognostic role of a multimarker analysis of circulating tumor cells in advanced gastric and gastroesophageal adenocarcinomas. Oncology 2015;89:294–303. [PubMed] DOI:10.1159/000437373
- Grabowski P, Maaser K, Hanski C, et al. Prognostic value of multimarker analysis in stage III colorectal cancer: one step forward towards an individualized therapy decision. Onkologie 2005;28:399–403. [PubMed] DOI:10.1159/000086514
- Parmar C, Leijenaar RT, Grossmann P, et al. Radiomic feature clusters and prognostic signatures specific for Lung and Head & Neck cancer. Sci Rep 2015;5:11044. [PubMed] DOI:10.1038/srep11044
- Liang C, Huang Y, He L, et al. The development and validation of a CT-based radiomics signature for the preoperative discrimination of stage I−II and stage III−IV colorectal cancer. Oncotarget 2016;7:31401–12. [PubMed] DOI:10.18632/oncotarget.8919
- Kienle P, Buhl K, Kuntz C, et al. Prospective comparison of endoscopy, endosonography and computed tomography for staging of tumours of the oesophagus and gastric cardia. Digestion 2002;66:230–6. [PubMed] DOI:10.1159/000068360
- Dong X, Xing L, Wu P, et al. Three-dimensional positron emission tomography image texture analysis of esophageal squamous cell carcinoma: relationship between tumor 18F-fluorodeoxyglucose uptake heterogeneity, maximum standardized uptake value, and tumor stage. Nucl Med Commun 2013;34:40–6. [PubMed] DOI:10.1097/MNM.0b013e32835ae50c
- Liu S, Zheng H, Pan X, et al. Texture analysis of CT imaging for assessment of esophageal squamous cancer aggressiveness. J Thorac Dis 2017;9:4724–32. [PubMed] DOI:10.21037/jtd.2017.06.46
- Xu Q, Zhu SC, Liu ZK, et al. Exploration of the classification of gross tumor volume and pathological staging of esophageal carcinoma. Zhonghua Zhong Liu Za Zhi (in Chinese) 2010;32:432–5. [PubMed]
- Chen Y, Zhang Z, Jiang G, et al. Gross tumor volume is the prognostic factor for squamous cell esophageal cancer patients treated with definitive radiotherapy. J Thorac Dis 2016;8:1155–61. [PubMed] DOI:10.21037/jtd.2016.04.08
- Chen CZ, Chen JZ, Li DR, et al. Long-term outcomes and prognostic factors for patients with esophageal cancer following radiotherapy. World J Gastroenterol 2013;19:1639–44. [PubMed] DOI:10.3748/wjg.v19.i10.1639
- Zhao B, Tan Y, Tsai WY, et al. Reproducibility of radiomics for deciphering tumor phenotype with imaging. Sci Rep 2016;6:23428. [PubMed] DOI:10.1038/srep23428
- Zeybek A, Erdoğan A, Gülkesen KH, et al. Significance of tumor length as prognostic factor for esophageal cancer. Int Surg 2013;98:234–40. [PubMed] DOI:10.9738/INTSURG-D-13-00075.1