
Computed tomography-based radiomics for prediction of neoadjuvant chemotherapy outcomes in locally advanced gastric cancer: A pilot study
Introduction
Among males and females across the world, gastric cancer is the fourth and fifth most common malignant tumor and the third and fifth leading cause of cancer-related death, respectively (1), while in China, it is the second most common cancer and the third leading cause of cancer death (2). The high mortality rate is partially because of late diagnosis at locally advanced stages (3). Therefore, many attempts have been made to improve patients’ survival, such as tailoring the extent of surgery and adopting neoadjuvant and/or adjuvant therapy. Previous studies have indicated that perioperative radio-chemotherapy or chemotherapy regimens had more favorable effects on increasing curative resection rates, disease-free survival, and overall survival (3-9). As a result, the standard treatment for patients with locally advanced gastric cancer no longer relies on surgery alone but also on perioperative radio-chemotherapy or chemotherapy since the 2000s (10).
For patients with locally advanced gastric cancer, perioperative radio-chemotherapy or chemotherapy can improve the overall and progression-free survival, but the rate of good response (GR) to neoadjuvant therapy varies between 30% and 80%, depending on which evaluation methods are used (3-9). This means that at least 20% of the patients receiving neoadjuvant therapy cannot benefit from perioperative radio-chemotherapy or chemotherapy, and are described as non-good response (non-GR). For these patients, neoadjuvant therapy not only increases the cost of medical care, but also weakens their immune system and delays surgery. Therefore, it is important that radiologists provide accurate information to physicians by identifying non-GR by non-invasive approaches so that alternative treatment, such as direct surgery can be adopted. Therefore, it is necessary to develop a predictive indicator or model for the treatment response to neoadjuvant therapy for gastric cancer, which offers guidance on whether performing neoadjuvant chemotherapy is necessary to avoid additional toxicity, improve patients’ quality of life, and reduce unnecessary morbidity and cost.
Previous studies have highlighted several indicators and their correlations to the treatment response for locally advanced gastric cancer, including peripheral venous blood neutrophil-to-lymphocyte ratio (NLR), C-reactive protein and albumin levels, modified Glasgow prognostic score (mGPS) and computed tomography (CT) perfusion (11-13). However, the majority of the previous works focusing on the correlations did not clearly describe the predictive value of the indicators, with the excepting of CT perfusion. Due to the moderate sensitivity (69%) and specificity (58%) of a cut-off value of >25% reduction in tumor permeability for predicting the clinical response of preoperative chemotherapy, CT perfusion is insufficient to support a clinical decision (13).
Radiomics – the high-throughput extraction of quantitative imaging features characterizing the spatial relationships and consistency of signal intensities – within the tumor region has demonstrated the ability to predict treatment response across a range of cancer types and imaging modalities (14). In the realm of gastric cancer, radiomics of CT has been verified as a potential preoperative prognostic biomarker in gastric cancer (15); pre-treatment CT texture analysis can potentially provide important information regarding the response rate to neoadjuvant therapy for gastric cancer, thereby improving risk stratification (16). Therefore, radiomics may be used as a crucial marker for the response to neoadjuvant therapy in locally advanced gastric cancer.
In this study, we investigated the ability of the radiomics of pre-treatment CT for prediction of non-GR in locally advanced gastric cancer with preoperative chemotherapy using 32 combinations of four feature-selection methods and eight classifier models.
Materials and methods
This is a single-center, retrospective study that follows the Declaration of Helsinki and good clinical practice guidelines, and was approved by the Ethics Committee of the Yunnan Cancer Hospital, Kunming, China. The committee waived the need for informed consent to be obtained because this case series is a retrospective study, and patients could not be contacted after discharge from hospital. The medical records and data accessed in the study contained no personal or identifying information.
Patients
Forty-seven consecutive patients with CT-staged II/III gastric cancer treated with neoadjuvant chemotherapy between December 2014 and March 2017 were enrolled. As recommended to the literature (17), the inclusion criteria were as follows: 1) histologically proven adenocarcinoma of the stomach with the following diagnosis: (a) stage IIA−IIIC, i.e., T3−T4 and/or N+, according to the American Joint Committee on Cancer (AJCC) 8th edition (18), and (b) considered operable following initial staging investigations (surgeon believes that an R0 resection can be achieved); 2) aged 18 years or older; 3) Eastern Cooperative Oncology Group (ECOG) performance status 0−1; 4) adequate organ function defined as follows: Bone marrow, hemoglobin ≥90 g/L, absolute neutrophil count (ANC) ≥1.5×10⁹/L, white blood cell count ≥3×10⁹/L, platelet count ≥100×109/L. Hepatic function, serum bilirubin ≤1.5× upper limit of normal value (ULN), aspartate aminotransferase (AST) and/or alanine aminotransferase (ALT) ≤3.0×ULN. Renal function, serum creatinine ≤0.150 mmol/L, and calculated creatinine clearance ≥50 mL/min; and 5) patients with a history of ischemic heart disease and abnormal electrocardiograph (ECG), or who were over 60 years of age were required to undergo a pre-treatment evaluation of cardiac function with a multiple-gated acquisition (MUGA) scan or echocardiogram and a left ventricular ejection fraction ≥50%. Exclusion criteria were as follows: 1) patients who refused surgery (n=8); 2) patients with peritoneal carcinosis confirmed by surgery and pathological evidence (n=2); 3) patients with serious complications, such as intestinal obstruction, active bleeding, enterobrosis, or obvious infections (n=4); or 4) patients with poor clinical conditions, such as deterioration before chemotherapy started (one), the necessity for immediate surgery due to other disease (one), and worsening coexisting disease (one) (n=3).
CT protocols
The CT examination was performed with a 128-slice CT scanner (SOMATOM Definition AS+, Siemens Medical Solutions, Forchheim, Germany).
Before the examination, patients received 400−600 mL water orally to distend the stomach. A nonionic contrast agent (Ultravist 300, Bayer Schering Pharma AG, Berlin, Germany) was injected with antecubital venous access at a rate of 3.5 mL/s. A total of 80−100 mL (1.5 mL per kg of body weight) was injected with a CT-compatible power injector (Bracco ACIST EZEM, EmpowerCTA) followed by a 20-mL saline flush at the same rate.
The CT scanning parameters were 64 detector rows; beam collimation 128×0.6 mm; pitch 0.6; 0.5 s/rotation; kVp/effective mA 120/200; display field of view (DFOV) 42 cm2; 512×512 matrix; slice thickness 1 mm; gap 1 mm.
As recommended by the literature (19), unenhanced, late arterial phase (AP, 40 s after injection) and portal venous phase (PP, 70 s after injection) of the upper abdomen scans were acquired for all patients.
Treatment protocols
The treatment protocol followed the National Comprehensive Cancer Network (NCCN) guidelines (20). Neoadjuvant chemotherapy was administered preoperatively for three cycles. Each 3-week cycle consisted of epirubicin (50 mg per m2 of body-surface area) by intravenous bolus on d 1, oxaliplatin (130 mg/m2) was administered by intravenous infusion in 500 mL of 5% glucose over a period of 2 h on d 1, and capecitabine (1,250 mg/m2, twice daily) from d 1 to d 21.
Treatment response evaluation
The pathological staging served as the reference standard and was determined according to the tumor-node-metastasis (TNM) classification system recommended by AJCC, eighth edition (18). The resection specimens were evaluated by a dedicated gastrointestinal pathologist (Reader 1, with 10 years of experience), blinded to the CT data. Patients were separated into different response groups as GR versus non-GR according to the NCCN (20) and modified tumor regression grade (TRG) based on Ryan’s definition (21). The GR patients included those exhibiting a complete response with no viable cancer cells (TRG 0) and moderate response with only a small cluster or isolated cancer cells remaining (TRG 1). The non-GR included TRG 2: a minimal response with residual cancer remaining but with predominant fibrosis and TRG 3: a poor response with minimal or no tumor death and extensive residue cancer.
Radiomics feature extraction
All images were reviewed using dedicated software for image analysis (3-D Slicer, Version 4.6) by a single experienced rectal CT radiologist (Reader 2, with 9 years of experience). In the late AP, each gastric tumor was manually outlined as a region of interest (ROI) slice by slice, because this is the effective phase for identifying the mucosal enhancement of early gastric cancers (19). In the PP, the late AP image was used as a reference. After marking the ROIs to the corresponding images, a volume of interest (VOI) was built. Next, 3-D radiomics features were extracted from the VOI using in-house software built by MATLAB 2013a (Mathworks, Natick, MA, USA). These radiomics features included four groups: 1) first order statistics; 2) shape- and size-based features; 3) texture features; and 4) wavelet features. To extract wavelet features, 53 types of default wavelets built in Matlab were applied to the origin images. In total, 19,985 radiomics features were extracted in AP and PP for each patient.
Radiomics feature selection and radiomics classifier building
Before selecting features, the redundant features were removed. When the Pearson correlation coefficient of any two features was >0.90, one of them was selected at random, and the rest could be treated in the same manner (22). After that, z-score standardization for standardizing all features was adopted. There were four methods used in feature selection, including recursive features elimination based on random forest (RFE-RF), recursive features elimination based on Naive Bayes (RFE-NB) (23), selection by a filter based on linear discriminant analysis (SBF-LDA) (24), and least absolute shrinkage and selection operator (lasso) (25). The methods selected here were representatives of the three main methods frequently used in feature selection (wrapped, filtered and embedded methods) (26).
In the process of building the classifier model, eight methods were adopted: RF, linear discriminant analysis (LDA), support vector machines with radial kernel (svmRadial), Linear-SVM (svmLinear), neural networks (nnet), K-nearest neighborhood (KNN), Naive Bayes (NB), lasso. The methods were implemented by R (Version 3.4.0) packages including caret (Version 6.0-76). The Leave-one-out Cross Validation (LOOCV) was used in resampling of training and evaluating models in the area under the receiver operator characteristic (ROC) curve.
Radiomics feature selection and radiomics classifier building of AP and PP were analyzed separately, but based on the same methods (including features’ extraction, selection and model building).
Evaluation of radiomics classifier performance
The feature selection methods and classifier model were all evaluated in one sample (n=30). A combination of the selection and classifications was generated, and a comparison was performed to find a better model. Because only 30 patients were involved, analysis of a single training cohort was applied. To evaluate the model, the average area under the curve (AUC) was used in resampling; meanwhile, accuracy, sensitivity and specificity were also measured based on the training cohort. Since the number of patients was limited, the AP and PP were compared to enhance the conviction of our model, and were analyzed separately using the same methods (features’ extraction, selection and model building).
Statistical analysis
The statistical analyses were performed with R software (Version 3.4.0; R Foundation for Statistical Computing, Vienna, Austria) (http://www.R-project.org). x±s is provided for normally distributed variables. Frequencies are provided for categorical data. Individual variables were analyzed for significant differences using a t-test and the Mann-Whitney-Wilcoxon test for non-normally distributed parameters. The consistency of different ROC was examined by the DeLong test. A group difference comparison with a two-sided P-value of <0.05 was considered significant. The following R packages were used for feature selection methods: “caret” (rfe), “randomforest” (rf), “e1071” (nb), “MASS” (LDA), “glmnet” (lasso). The following packages were used for classification methods: “randomforest” (rf), “MASS” (LDA), “kernlab” (svmLinear), “kernlab” (svmRadial), “nnet” (nnet), “class” (knn), “e1071” (nb), “glmnet” (lasso).
Results
Patient Characteristics
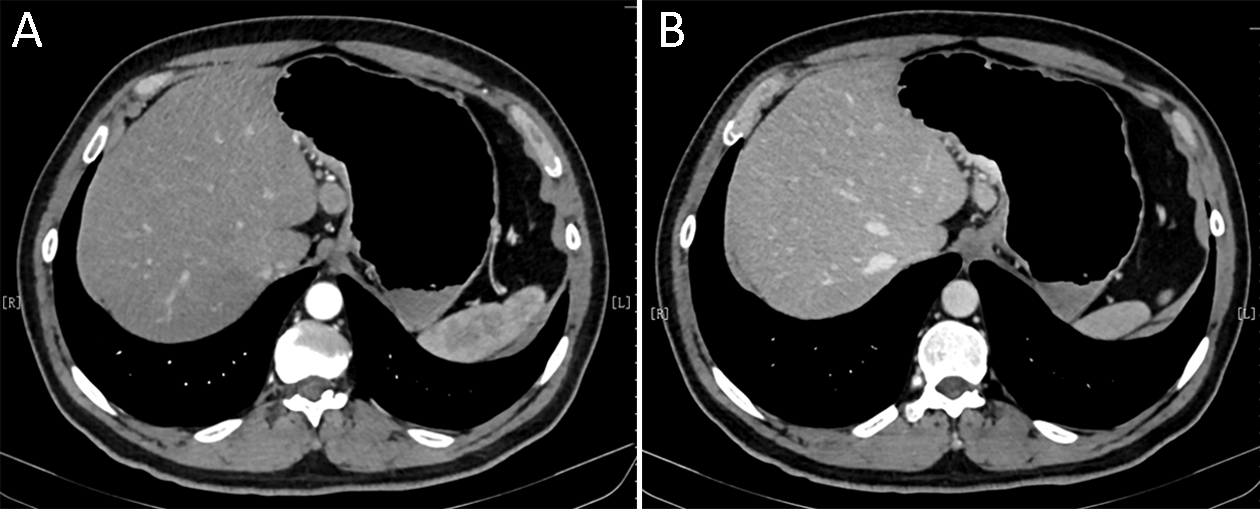
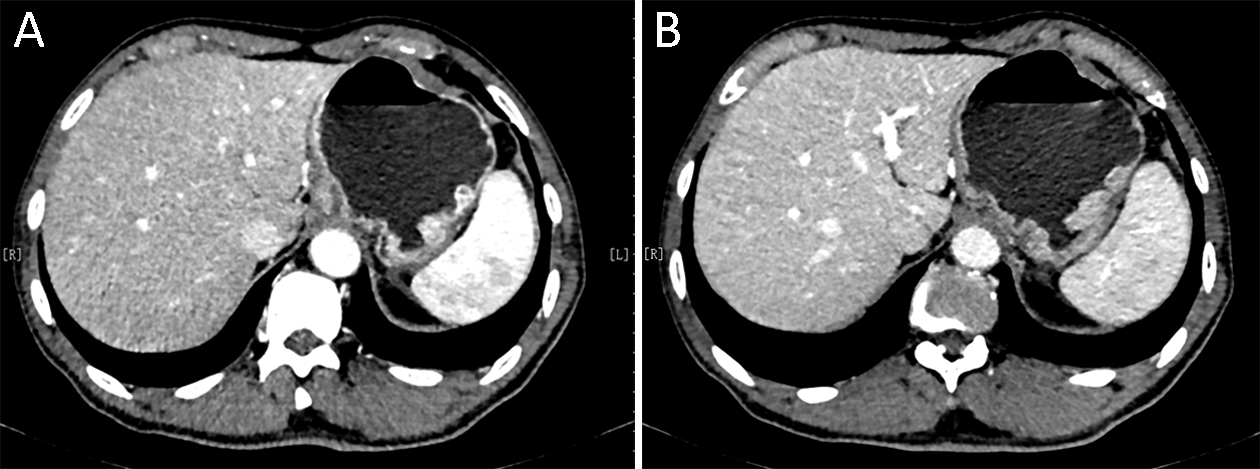
A total of 30 patients (aged 59.9±8.9 years) were involved in the study. Among these patients, 36.7% (11/30) were GR (TRG 0−1,Figure 1) and 63.3% (19/30) were non-GR (TRG 2−3,Figure 2). The detailed clinical characteristics are listed in Table 1. There were no statistical differences between GR versus non-GR groups concerning age, primary tumor site and pre-treatment clinical TNM stage, with the exception of gender (P=0.012) and post-treatment pathological stage (P<0.001) (Table 1).

Full table
Predictive performance of radiomics classifier
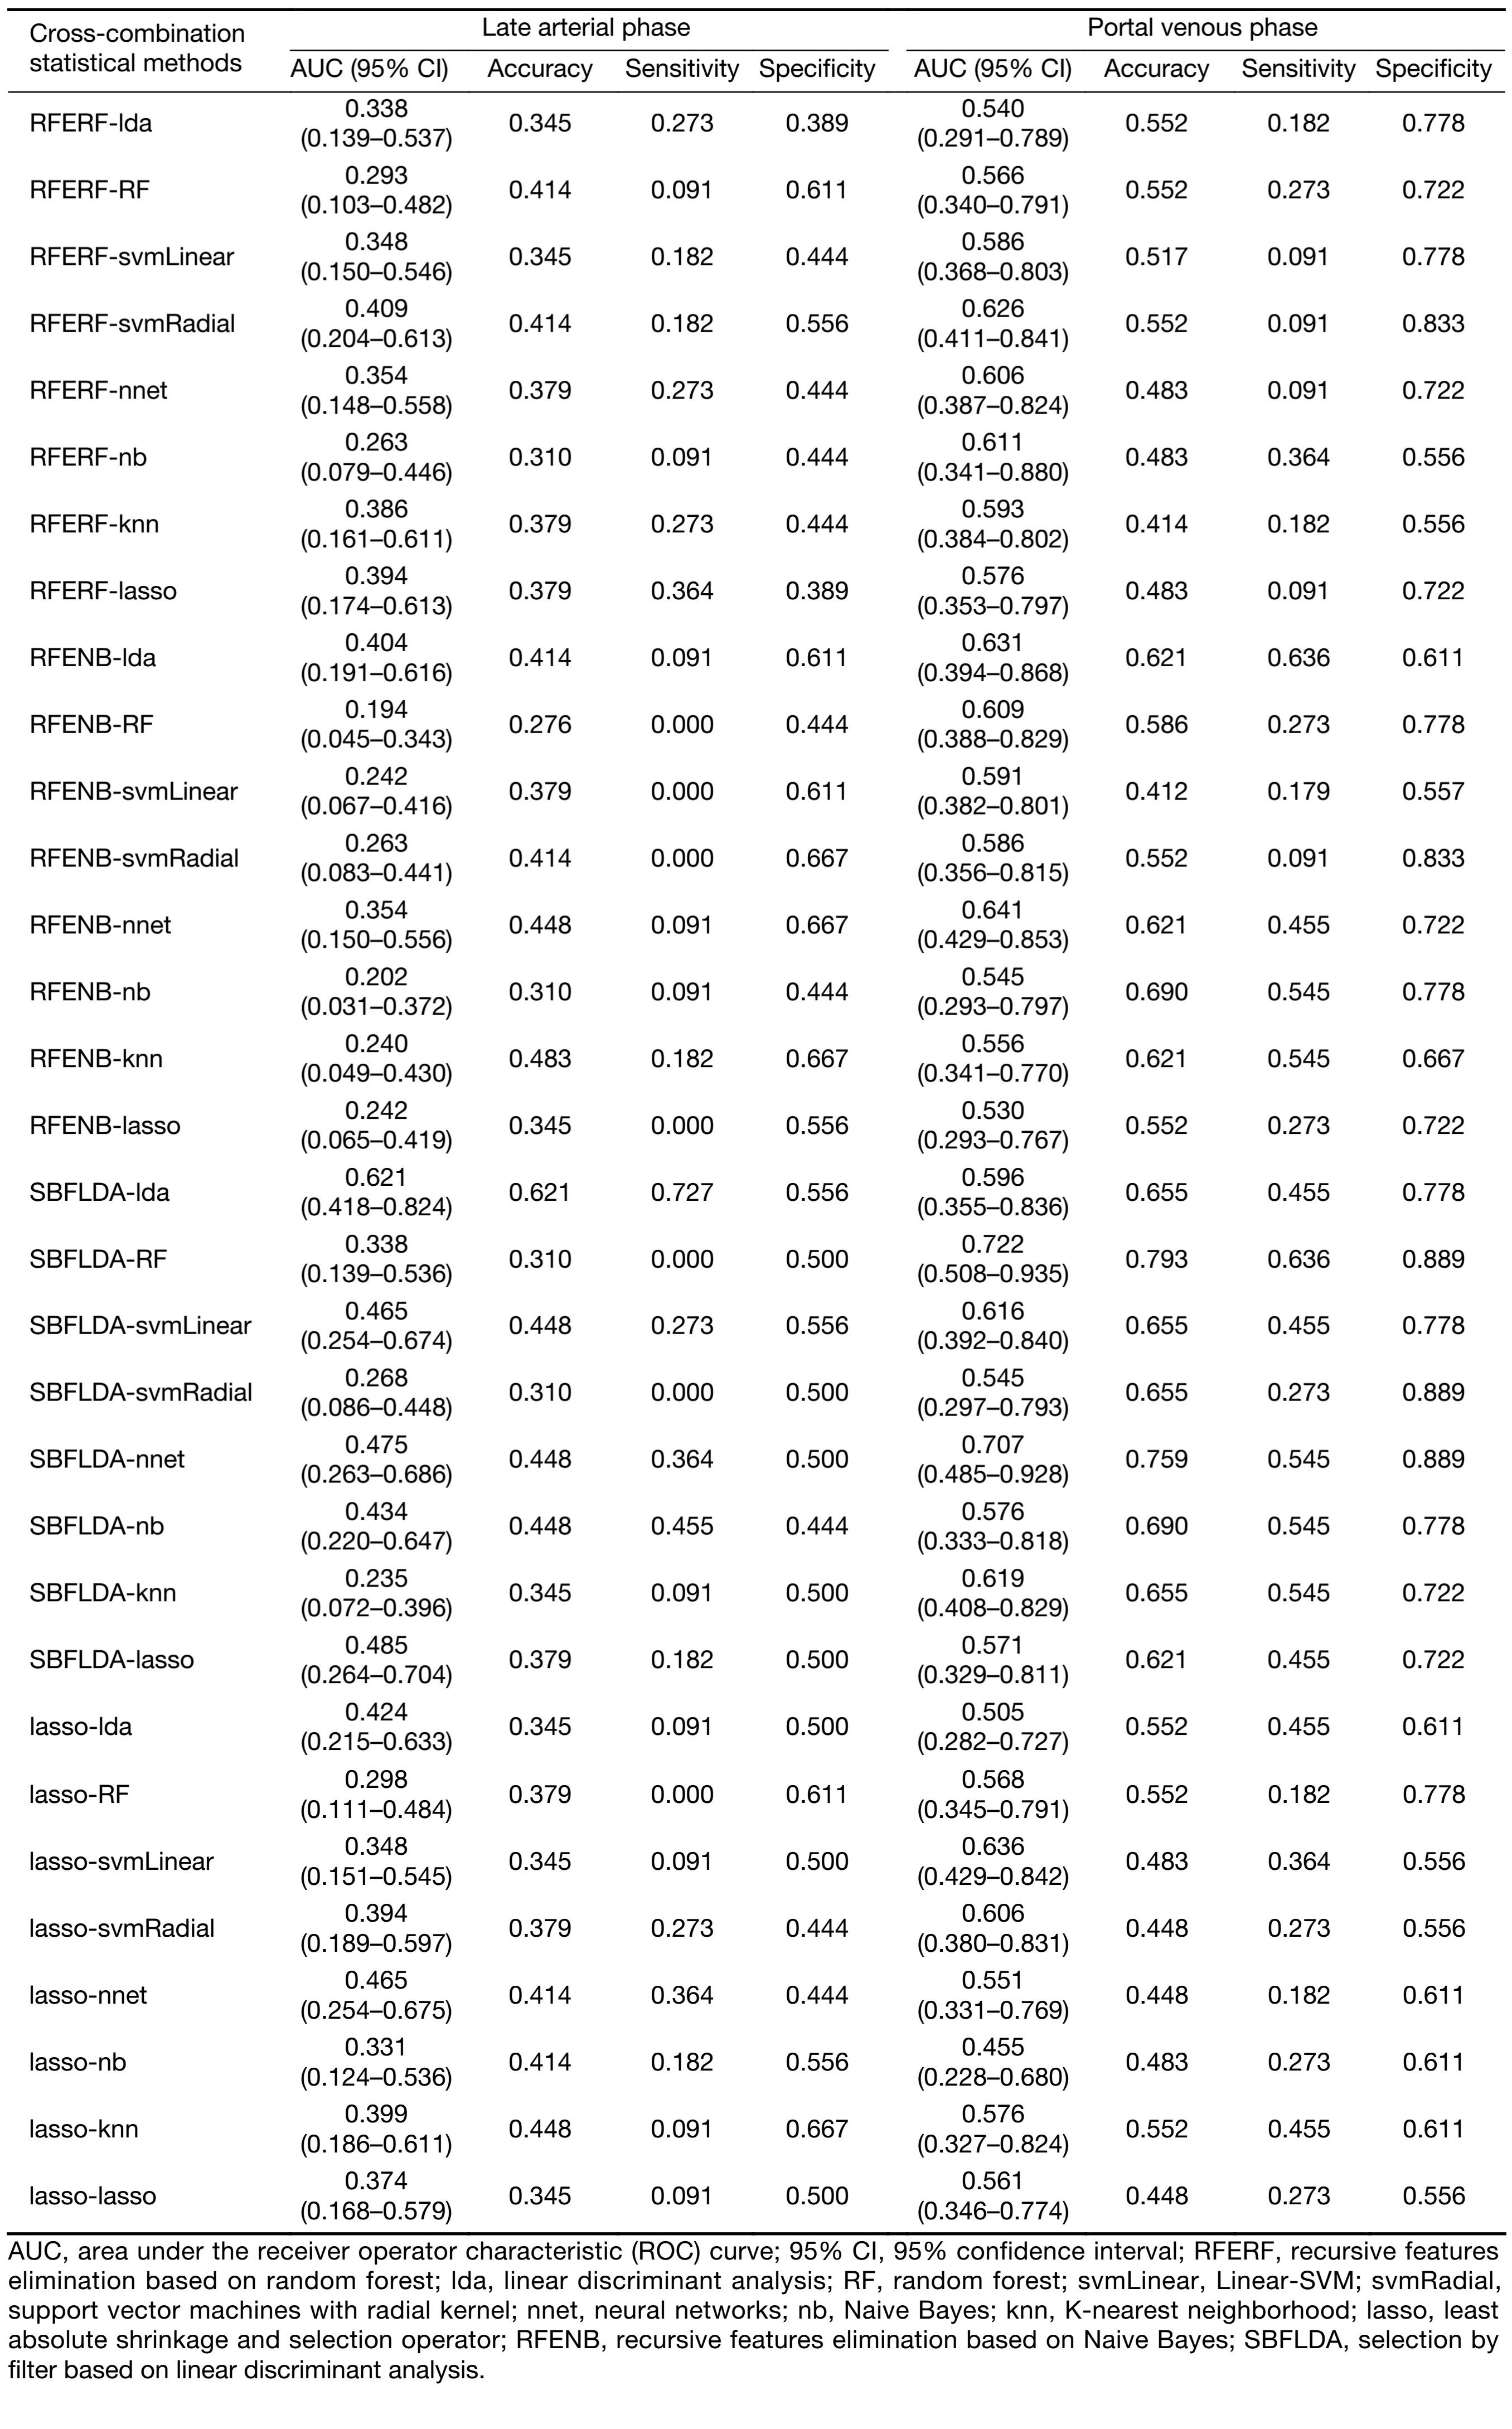
The AUC was used to quantify the prognostic performance of different crossed-feature selection and classification methods in predicting non-GR. In the present study, 32 combinations of feature selection and classification methods were examined. The mean AUC, accuracy, sensitivity and specificity of the different cross-combination machine-learning methods in AP and PP are presented in
Supplementary Table S1.
Full table
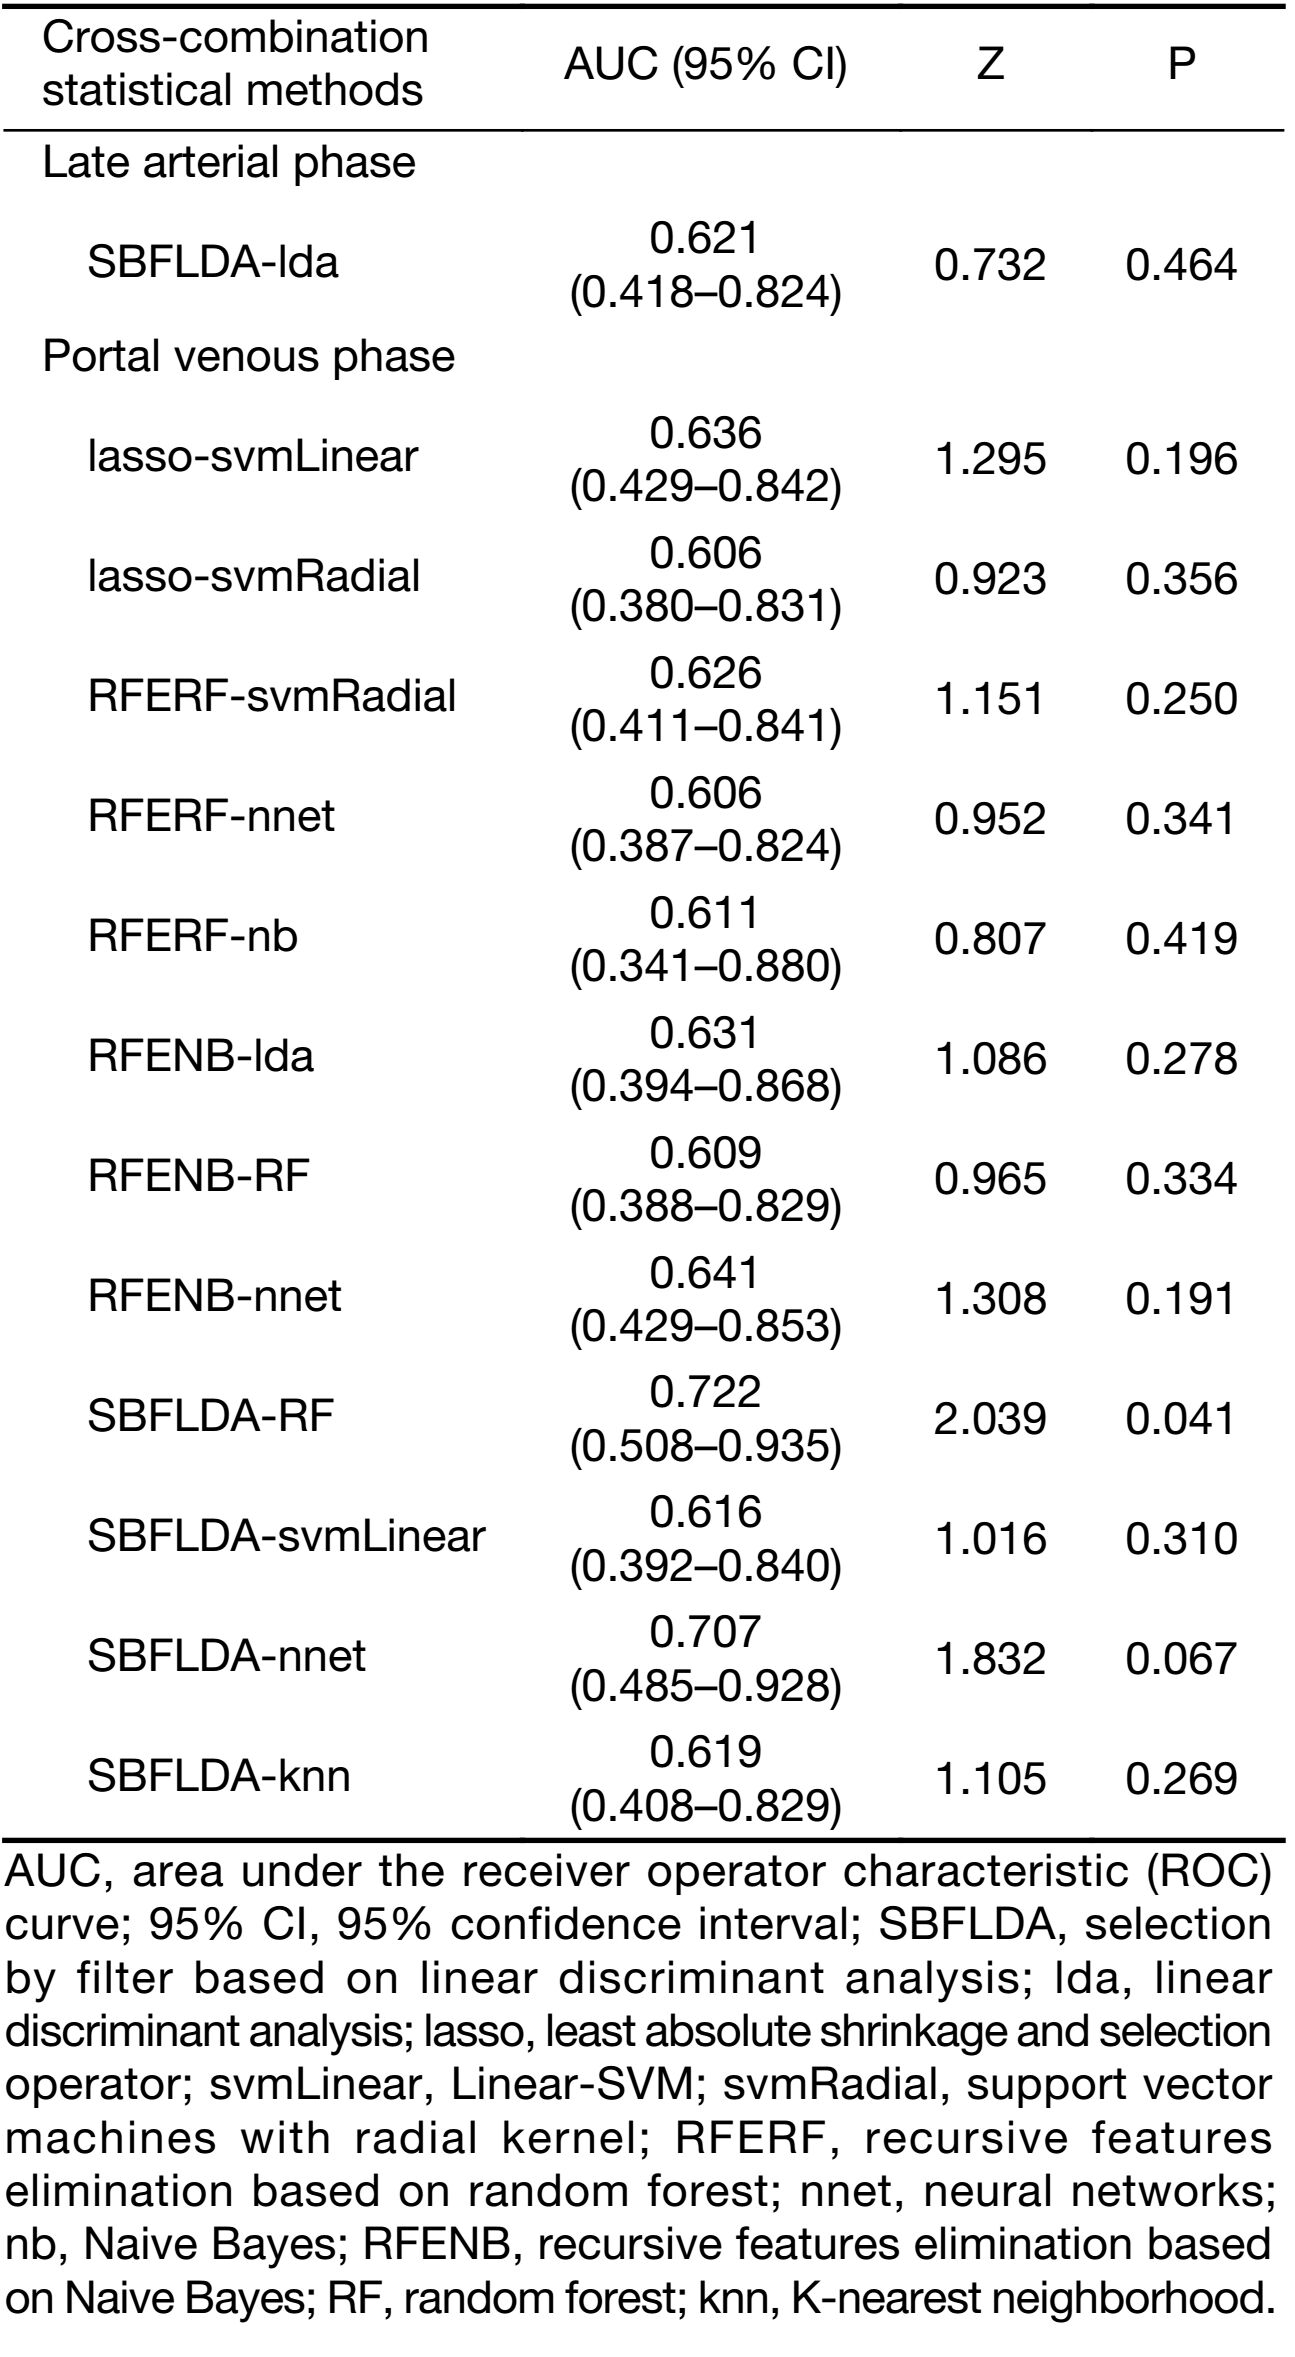
The mean AUC ranged from 0.194 to 0.621 in AP, and from 0.455 to 0.722 in PP. The accuracy was within the range of 0.276 to 0.621 in AP, and 0.412 to 0.793 in PP. The sensitivity was in the range of 0.000 to 0.727 in AP, and 0.091 to 0.636 in PP. The range of specificity was 0.389 to 0.667 in AP, and 0.556 to 0.889 in PP.
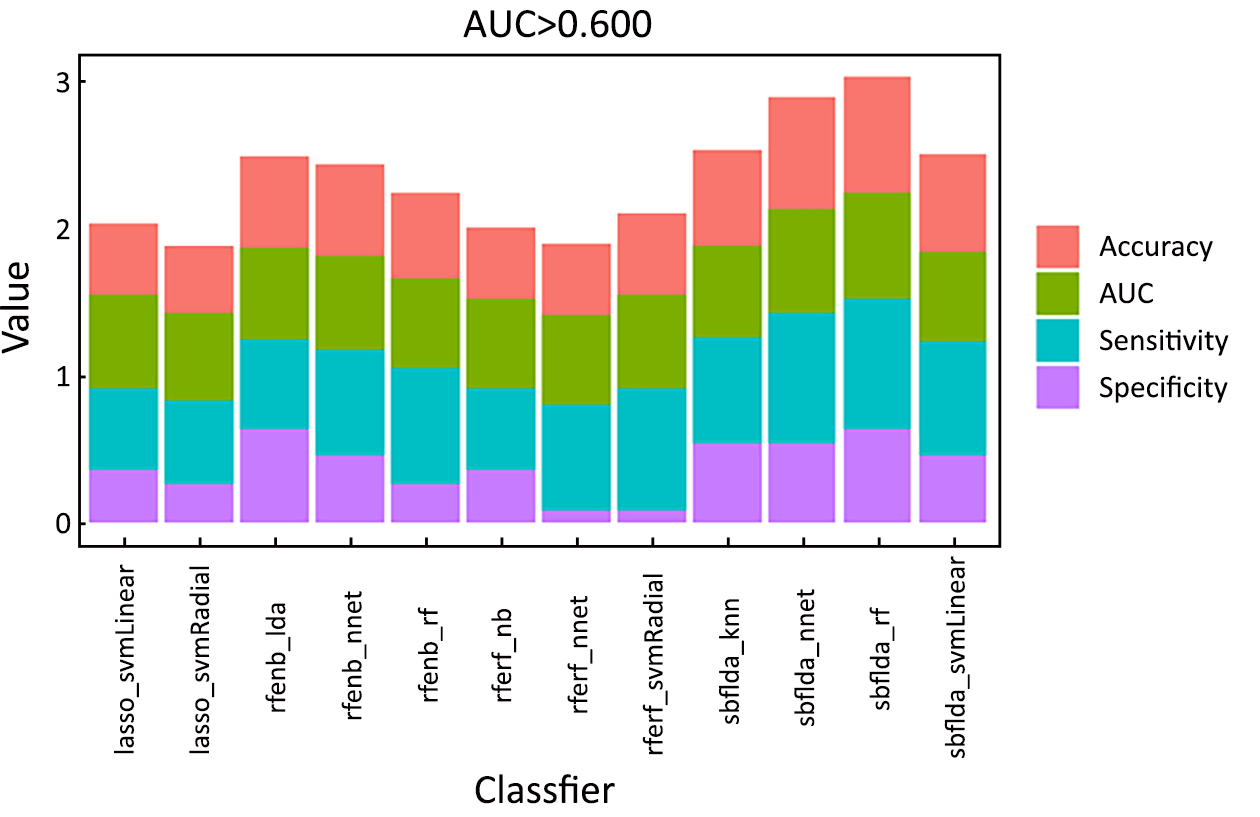
There was only one cross-combination machine-learning method indicating a relatively higher AUC (>0.600) in AP, while 12 cross-combination machine-learning methods presented relatively higher AUCs (all >0.600) in PP. Figure 3 depicts the mean AUC, accuracy, sensitivity and specificity of the above 12 crossed methods in PP.
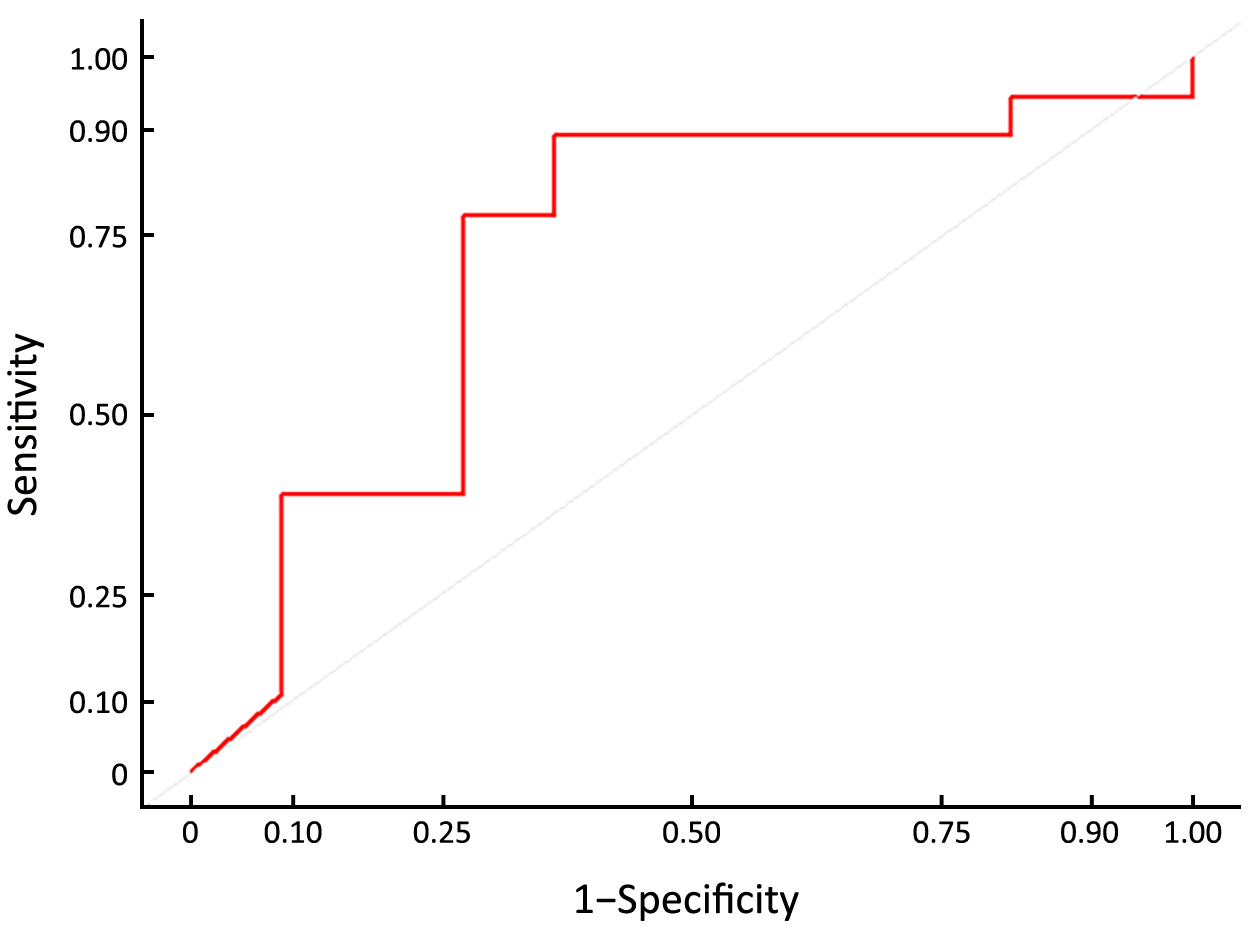
Interestingly, the feature selection method of SBFLDA + classifier of RF in PP was only one cross-combination machine-learning method, achieving a significantly prognostic performance (Supplementary Table S2). Figure 4 shows the ROC curves for the feature selection method of SBFLDA + classifier of RF, which achieved the highest prognostic performance in PP (AUC, 0.722±0.108; accuracy, 0.793; sensitivity, 0.636; specificity, 0.889; Z=2.039; P=0.041) (Figure 4).
Full table
Discussion
The main finding of this study was that the pre-treatment CT-based radiomics classifier was a crucial marker of the response to neoadjuvant therapy in locally advanced gastric cancer. We found that the feature selection method SBFLDA + classifier RF of pre-treatment CT imaging in PP could predict non-GR in locally advanced gastric cancer with preoperative chemotherapy with an AUC of 0.722.
Currently, pathological evaluation of the surgical specimen is the only reliable surrogate marker that correlates with long-term oncological outcome (27). However, such data are available only after completion of all preoperative treatment and surgery, which therefore cannot be used as guidance for adjusting the therapeutic approach. Accordingly, the development of non-invasive biomarkers which have the potential to provide pre-therapy prediction is essential. Such biomarkers would aid in identifying those patients who are less likely to benefit from the current therapies for alternative treatment or intensive follow-up regimens. Furthermore, the biomarkers would also offer guidance for clinicians to decide whether to perform neoadjuvant chemotherapy, in order to avoid additional toxicity, improve the patients’ quality of life and reduce unnecessary morbidity and cost (28). Therefore, the development of a pre-treatment model which is accurate and predictive of the efficacy of neoadjuvant chemotherapy is important for patients with locally advanced gastric cancers.
Many gastric cancers are well visualized with CT (13,15,19,29), and CT is a routinely used and easily accessible source of information in clinical oncology (15). Radiomics is a rapidly growing field that converts medical images into high-dimensional, mineable and quantitative data, with the ultimate goal of generating imaging biomarkers to improve evidence-based support of decisions in clinical practice (30-33). Quantitative radiomics has tremendous potential to improve cancer care by enhancing the understanding of tumor physiology and aiding in the implementation of personalized medicine (34). As a noninvasive and cost-effective method of assessing the tumor in its entirety, radiomics allows for the evaluation of tumor characteristics such as spatial-temporal heterogeneity, which is often considered as an important biomarker in oncology (13,35). Therefore, it is possible to predict the response to neoadjuvant chemotherapy in locally advanced gastric cancers with CT-based radiomics.
Previous studies have demonstrated the importance of radiomics in the realm of the gastric cancer (36-38). Ba-Ssalamah et al. (36) reported that the texture-based lesion classification on arterial-phase scans was highly successful in differentiating between gastric adenocarcinoma and lymphoma, and gastrointestinal stromal tumors and lymphoma, with misclassification rates of 3.1% and 0% respectively. Yoon et al. (37) verified that heterogeneous texture features on CT images were associated with increased survival rates in patients with HER2-positive advanced gastric cancer who received trastuzumab-based treatment. Liu et al. (38) stated that some texture features including mean attenuation, maximum attenuation, all percentiles and mode derived from portal venous CT images correlated significantly with the differentiation degree and Lauren classification of gastric cancers (r, −0.231−−0.324, 0.228−0.321, respectively). In addition, several studies have demonstrated the importance of radiomics in predicting the neoadjuvant therapy outcome for tumors (16,28,30,39). Giganti et al. (16) illustrated that the following texture parameters could identify non-responders after preoperative chemo-radiation therapy in locally advanced gastric cancer by multivariate analysis: entropy, range and root mean square, and entropy had an AUC of 0.74 for GR prediction. Cha et al. (28) explained that an AUC ranging from 0.69 to 0.77 was used to predict T0 stage after neoadjuvant chemotherapy by three radiomics models in bladder cancer. Nie et al. (30) reported an AUC of 0.89 of radiomics model for GR prediction after preoperative chemo-radiation therapy in locally advanced rectal cancer. Braman et al. (39) claimed that a combined intratumoral and peritumoral radiomics feature set yielded a maximum AUC of 0.78 within the training set and 0.74 within the independent testing set for pathological-complete-response prediction after neoadjuvant chemotherapy in breast cancer. Our present study also found that the radiomics classifier of pre-treatment CT imaging provided a maximum AUC of 0.722 in PP to predict non-GR according to different combinations of feature selection and classification methods, which is similar to the results of previous studies (16,28,39), but the figure was lower than that of Nie’s study (30).
Due to the small sample size, 32 cross-combinations of feature selection and classification methods were used to investigate the wealth of radiomics for pre-treatment CT in prediction of non-GR in this study. The four feature selections and eight classification methods used in this analysis were chosen because of their simplicity, efficiency and popularity in the field of machine-learning. In this study, different combinations of feature selection and classifications method were found to exhibit distinctive prognostic performances, and the combination of the SBF-LDA feature selection method and RF classification method indicated higher prognostic performance than the other crossed methods for radiomics-based prediction of the pathological response to neoadjuvant chemotherapy in locally advanced gastric cancers. In other words, SBFLDA is the optimal feature selection method, while RF is the optimal classification method in this study. This possibly results from the advantage of SBFLDA and RF. SBFLDA is most commonly used as a pre-processing step to reduce the dimensionality for pattern-classification. The goal of SBFLDA is to project a dataset onto a lower-dimensional space with good class-separability in order to avoid overfitting and reduce computational costs (40). RF is a fairly efficient model-free method both in the classification and in representing higher predictive performance in previous studies (41,42). It is known that RF can identify not only the variables that have a linear effect on the response, but also the nonlinear ones. It has the ability to discover the hidden relationship between the response and the variables (41).
However, this research does have some limitations.
Firstly, the sample size was small compared to the large number of predictors. Seventeen patients were excluded from our initial population owing to our restrictive criteria, resulting in a small but homogeneous population treated with the same treatment protocol. It should be noted that some studies on radiomics analysis with respect to the response to neoadjuvant therapy have been performed while following different treatment protocols (15,30). Furthermore, due to the limited sample size, AUC, accuracy, sensitivity and specificity were measured based on the training cohort but not on the testing cohort. To enhance the conviction of our model, LOOCV was used as an internal validation technique in order to avoid overfitting.
Secondly, the radiomics parameter was analyzed by the only one type of voxel size. However, the stability of the radiomics parameter may be related to the voxel size. In the future, different voxel sizes should be used to improve the accuracy of quantitative analysis.
Thirdly, no pharmacological precautions were taken such as hyoscine butylbromide or similar drugs to avoid stomach movements, and the water distention technique was used rather than the gas distention technique, which is superior in lesions detection. The CT images of all patients were reviewed carefully and respectively to avoid significant image misalignments.
Conclusions
As a pilot study, our results provide initial evidence that it is possible to predict non-GR after neoadjuvant chemotherapy in locally advanced gastric cancers based on the radiomics of CT. Radiomics may represent a promising and non-invasive prognostic tool for the response to neoadjuvant chemotherapy in locally advanced gastric cancers, and it deserves further study.
Acknowledgements
This work was supported by the National Key Research and Development Program of China (No. 2017YFC1309100), the National Natural Scientific Foundation of China (No. 81771912) and the Applied Basic Research Projects of Yunnan Province, China [No. 2015FB071 and No. 2017FE467-084]. We would like to thank Xirui Cai from Department of Foreign Languages, Kunming Medical University for editing the English text of this manuscript.
Footnote
Conflicts of Interest: The authors have no conflicts of interest to declare.
References
- Torre LA, Bray F, Siegel RL, et al. Global cancer statistics, 2012. CA Cancer J Clin 2015;65:87–108. [PubMed] DOI:10.3322/caac.21262
- Chen W, Zheng R, Zhang S, et al. Cancer incidence and mortality in China in 2013: an analysis based on urbanization level. Chin J Cancer Res 2017;29:1–10. [PubMed] DOI:10.21147/j.issn.1000-9604.2017.01.01
- Cunningham D, Allum WH, Stenning SP, et al. Perioperative chemotherapy versus surgery alone for resectable gastroesophageal cancer. N Engl J Med 2006;355:11–20. [PubMed] DOI:10.1056/NEJMoa055531
- Ychou M, Boige V, Pignon JP, et al. Perioperative chemotherapy compared with surgery alone for resectable gastroesophageal adenocarcinoma: an FNCLCC and FFCD multicenter phase III trial. J Clin Oncol 2011;29:1715–21. [PubMed] DOI:10.1200/JCO.2010.33.0597
- Inoue T, Yachida S, Usuki H, et al. Pilot feasibility study of neoadjuvant chemoradiotherapy with S-1 in patients with locally advanced gastric cancer featuring adjacent tissue invasion or JGCA bulky N2 lymph node metastases. Ann Surg Oncol 2012;19:2937–45. [PubMed] DOI:10.1245/s10434-012-2332-4
- Michel P, Breysacher G, Mornex F, et al. Feasibility of preoperative and postoperative chemoradiotherapy in gastric adenocarcinoma. Two phase II studies done in parallel. Federation Francophone de Cancerologie Digestive 0308. Eur J Cancer 2014;50:1076–83. [PubMed] DOI:10.1016/j.ejca.2013.12.009
- Oki E, Emi Y, Kusumoto T, et al. Phase II study of docetaxel and S-1(DS) as neoadjuvant chemotherapy for clinical stage III resectable gastric cancer. Ann Surg Oncol 2014;21:2340–6. [PubMed] DOI:10.1245/s10434-014-3594-9
- Fiteni F, Paget-Bailly S, Messager M, et al. Docetaxel, cisplatin, and 5-fluorouracil as perioperative chemotherapy compared with surgery alone for resectable gastroesophageal adenocarcinoma. Cancer Med 2016;5:3085–93. [PubMed] DOI:10.1002/cam4.885
- Yoshikawa T, Sasako M, Yamamoto S, et al. Phase II study of neoadjuvant chemotherapy and extended surgery for locally advanced gastric cancer. Br J Surg 2009;96:1015–22. [PubMed] DOI:10.1002/bjs.6665
- Biondi A, Lirosi MC, D’Ugo D, et al. Neo-adjuvant chemo(radio)therapy in gastric cancer: Current status and future perspectives. World J Gastrointest Oncol 2015;7:389–400. [PubMed] DOI:10.4251/wjgo.v7.i12.389
- Chen L, Zuo Y, Zhu L, et al. Peripheral venous blood neutrophil-to-lymphocyte ratio predicts survival in patients with advanced gastric cancer treated with neoadjuvant chemotherapy. Onco Targets Ther 2017;10:2569–80. [PubMed] DOI:10.2147/OTT.S134716
- Proctor MJ, Horgan PG, Talwar D, et al. Optimization of the systemic inflammation-based Glasgow Prognostic Score. Cancer 2013;119:2325–32. [PubMed] DOI:10.1002/cncr.28018
- Lundsgaard Hansen M, Fallentin E, Lauridsen C, et al. Computed tomography (CT) perfusion as an early predictive marker for treatment response to neoadjuvant chemotherapy in gastroesophageal junction cancer and gastric cancer - a prospective study. PLoS one 2014;9:e97605. [PubMed] DOI:10.1371/journal.pone.0097605
- Yip SS, Aerts HJ. Applications and limitations of radiomics. Phys Med Biol 2016;61:R150–66. [PubMed] DOI:10.1088/0031-9155/61/13/R150
- Giganti F, Antunes S, Salerno A, et al. Gastric cancer: texture analysis from multidetector computed tomography as a potential preoperative prognostic biomarker. Eur Radiol 2017;27:1831–9. [PubMed] DOI:10.1007/s00330-016-4540-y
- Giganti F, Marra P, Ambrosi A, et al. Pre-treatment MDCT-based texture analysis for therapy response prediction in gastric cancer: Comparison with tumour regression grade at final histology. Eur J Radiol 2017;90:129–37. [PubMed] DOI:10.1016/j.ejrad.2017.02.043
- Leong T, Smithers BM, Michael M, et al. TOPGEAR: a randomised phase III trial of perioperative ECF chemotherapy versus preoperative chemoradiation plus perioperative ECF chemotherapy for resectable gastric cancer (an international, intergroup trial of the AGITG/TROG/EORTC/NCIC CTG). BMC Cancer 2015;15:532. [PubMed] DOI:10.1186/s12885-015-1529-x
- Amin MB, Edge S, Greene F, et al. AJCC Cancer Staging Manual. 8th edition. New York: Springer, 2016.
- Chen CY, Hsu JS, Wu DC, et al. Gastric cancer: preoperative local staging with 3D multi-detector row CT - correlation with surgical and histopathologic results. Radiology 2007;242:472–82. [PubMed] DOI:10.1148/radiol.2422051557
- National Comprehensive Cancer Network. NCCN Clinical Practice Guidelines in Oncology: Gastric Cancer. Fort Washington, PA: National Comprehensive Cancer Network, 2017. Available online: https://www.nccn.org/professionals/physician_gls/pdf/gastric.pdf
- Ryan R, Gibbons D, Hyland JM, et al. Pathological response following long-course neoadjuvant chemoradiotherapy for locally advanced rectal cancer. Histopathology 2005;47:141–6. [PubMed] DOI:10.1111/j.1365-2559.2005.02176.x
- Yu L, Liu H. Feature selection for high-dimensional data: a fast correlation-based filter solution, the Twentieth International Conference on International Conference on Machine Learning. Washington: AAAI Press, 2003:856–63.
- Lal TN, Chapelle O, Weston J, et al. Embedded Methods. In: Guyon I, Nikravesh M, Gunn S, et al. eds. Feature Extraction. Studies in Fuzziness and Soft Computing, Vol 207. Berlin: Springer, 2006:137-65.
- Balakrishnama S, Ganapathiraju A. Linear discriminant analysis – a brief tutorial. Institute for Signal and information Processing Mississippi State University;Starkville 1998:1–8.
- Osborne MR, Presnell B, Turlach BA. On the LASSO and its dual. Journal of Computational & Graphical Statistics 2000;9:319–37. [PubMed] DOI:10.2307/1390657>
- Saeys Y, Inza I, Larrañaga P. A review of feature selection techniques in bioinformatics. Bioinformatics 2007;23:2507–17. [PubMed] DOI:10.1093/bioinformatics/btm344
- Neves Filho EH, de Sant’Ana RO, Nunes LV, et al. Histopathological regression of gastric adenocarcinoma after neoadjuvant therapy: a critical review. APMIS 2017;125:79–84. [PubMed] DOI:10.1111/apm.12642
- Cha KH, Hadjiiski L, Chan HP, et al. Bladder cancer treatment response assessment in CT using radiomics with deep-learning. Sci Rep 2017;7:8738. [PubMed] DOI:10.1038/s41598-017-09315-w
- Kim SH, Kim SH, Kim MA, et al. CT differentiation of poorly-differentiated gastric neuroendocrine tumours from well-differentiated neuroendocrine tumours and gastric adenocarcinomas. Eur Radiol 2015;25:1946–57. [PubMed] DOI:10.1007/s00330-015-3600-z
- Nie K, Shi L, Chen Q, et al. Rectal cancer: assessment of neoadjuvant chemoradiation outcome based on radiomics of multiparametric MRI. Clin Cancer Res 2016;22:5256–64. [PubMed] DOI:10.1158/1078-0432.CCR-15-2997
- Lambin P, Rios-Velazquez E, Leijenaar R, et al. Radiomics: extracting more information from medical images using advanced feature analysis. Eur J Cancer 2012;48:441–6. [PubMed] DOI:10.1016/j.ejca.2011.11.036
- Limkin EJ, Sun R, Dercle L, et al. Promises and challenges for the implementation of computational medical imaging (radiomics) in oncology. Ann Oncol 2017;28:1191–206. [PubMed] DOI:10.1093/annonc/mdx034
- Huang YQ, Liang CH, He L, et al. Development and validation of a radiomics nomogram for preoperative prediction of lymph node metastasis in colorectal cancer. J Clin Oncol 2016;34:2157–64. [PubMed] DOI:10.1200/JCO.2015.65.9128
- Choi ER, Lee HY, Jeong JY, et al. Quantitative image variables reflect the intratumoral pathologic heterogeneity of lung adenocarcinoma. Oncotarget 2016;7:67302–13. [PubMed] DOI:10.18632/oncotarget.11693
- Sala E, Mema E, Himoto Y, et al. Unravelling tumour heterogeneity using next-generation imaging: radiomics, radiogenomics, and habitat imaging. Clin Radiol 2017;72:3–10. [PubMed] DOI:10.1016/j.crad.2016.09.013
- Ba-Ssalamah A, Muin D, Schernthaner R, et al. Texture-based classification of different gastric tumors at contrast-enhanced CT. Eur J Radiol 2013;82:e537–43. [PubMed] DOI:10.1016/j.ejrad.2013.06.024
- Yoon SH, Kim YH, Lee YJ, et al. Tumor heterogeneity in human epidermal growth factor receptor 2(HER2)-positive advanced gastric cancer assessed by CT texture analysis: association with survival after trastuzumab treatment. PLoS One 2016;11:e0161278. [PubMed] DOI:10.1371/journal.pone.0161278
- Liu S, Liu S, Ji C, et al. Application of CT texture analysis in predicting histopathological characteristics of gastric cancers. Eur Radiol 2017;27:4951–9. [PubMed] DOI:10.1007/s00330-017-4881-1
- Braman NM, Etesami M, Prasanna P, et al. Intratumoral and peritumoral radiomics for the pretreatment prediction of pathological complete response to neoadjuvant chemotherapy based on breast DCE-MRI. Breast Cancer Res 2017;19:57. [PubMed] DOI:10.1186/s13058-017-0846-1
- Zhao J, Shi L, Zhu J. Two-stage regularized linear discriminant analysis for 2-D data. IEEE Trans Neural Netw Learn Syst 2015;26:1669–81. [PubMed] DOI:10.1109/tnnls.2014.2350993
- Zhang B, He X, Ouyang F, et al. Radiomic machine-learning classifiers for prognostic biomarkers of advanced nasopharyngeal carcinoma. Cancer Lett 2017;403:21–7. [PubMed] DOI:10.1016/j.canlet.2017.06.004
- Parmar C, Grossmann P, Bussink J, et al. Machine learning methods for quantitative radiomic biomarkers. Sci Rep 2015;5:13087. [PubMed] DOI:10.1038/srep13087