
Radiomic analysis of pulmonary ground-glass opacity nodules for distinction of preinvasive lesions, invasive pulmonary adenocarcinoma and minimally invasive adenocarcinoma based on quantitative texture analysis of CT
Introduction
Lung cancer is the leading cause of cancer-related deaths in the world (1), and adenocarcinomas as the most common histological subtype were divided into preinvasive lesions, minimally invasive adenocarcinomas (MIAs) and invasive pulmonary adenocarcinomas (IPAs) collectively by the joint of International Association for the Study of Lung Cancer, the American Thoracic Society and the European Respiratory Society (2) in 2011.
Preinvasive lesions include atypical adenomatous hyperplasia (AAH) and adenocarcinoma in situ (AIS). AAH characteristically appears as a very small and pure ground-glass opacity lesion (GGO) (3-6). AIS usually presents as a pure GGO but sometimes is partly solid or occasionally is a solid nodule (4,7-9). The imaging presentations of MIAs and IPAs can be pure GGOs or partly-solid nodules or even a solid nodule (9-14).
It can be seen that all of them could present as GGOs during CT examinations. Previous studies have shown that preinvasive lesions can be followed up for a long time and MIAs have either 100% or near 100% 5-year disease-free survival (DFS) after complete resection (2,11). In contrast, the 5-year DFS of an IPA of the pathological stage IA is 74.6% (15). Therefore, early diagnosis and exact discrimination of these diseases that presents as GGOs on CT are of great importance.
Previous studies regarding the identification of benign/malignant nodules among GGOs usually focused on lesion size (3-14), the appearance of the solid component (16), the detection of growth or the density change of GGOs (17). Many studies have suggested that the GGOs lesion sizes were significantly different among AIS, MIAs and IPAs (18-20), and the solid component size within GGO lesions could also discriminate IPAs from both MIAs and AIS (21). Changes in the size and density of GGOs were found in follow-up studies; however, they did not significantly help in differentiating preinvasive lesions and MIAs from IPAs (21-23).
However, now, except for these morphologic features, there are still no generally accepted quantitative guidelines that have been issued for GGO diagnosis. Radiomic analysis, as a more systematic approach, may provide more information regarding the discrimination of preinvasive lesions from IPAs or MIAs, as it is able to identify voxel-level changes within GGOs. Thus, our study presents the hypothesis that there may be some radiomic features that can be used to discriminate GGOs. The present study aims to find the differences among GGOs in CT images with pathological diagnoses in the IPAs, MIAs, and preinvasive lesion categories using radiomic analysis.
Materials and methods
The study was approved by the Medical Research Ethics Committee and the Institutional Review Board of Tianjin Medical University Cancer Institute & Hospital.
Patient population
The inclusion criteria for the lung cancer patients in our study were as follows: 1) patients with a pathological diagnosis of cancer; 2) diagnostic CT scans before surgery; 3) CT images with a slice thickness of 2.5 mm or less; and 4) a single GGO. Patients were excluded if the lesions were either very small (<5 mm) or very large (>5 cm). Ultimately, there were 109 patients (mean age, 57.1 years; range, 38−77 years) qualified for our study.
Thirty-two (29.4%) of the patients had preinvasive lesions (including 22 patients who were diagnosed with AAH and 10 patients who were diagnosed with AIS), 37 (33.9%) had MIAs, and 40 (36.7%) had IPAs.
CT examinations
In our study, all the CT examinations were performed without contrast enhancement using a high-definition CT system (Discovery CT750HD, GE Healthcare, Milwaukee, Wisconsin, USA), and the scanning parameters were as follows: DFOV = 40 cm; tube voltage = 120 kVp; slice thickness = 1.25 mm; reconstruction interval = 1.25 mm; gantry rotation speed = 0.8 s; and a scanning range from the apex of the lung to the base to lung.
Delineation of ROI
The ROI in the present study was manually delineated and segmented slice-by-slice on the CT images. The ROI covered the whole lesion, and the large vessels and arteries in the ROI were excluded. Finally, the seed ROI was checked slice-by-slice in every subject by another radiologist to ensure that the ROI in each subject satisfied the lesion boundary definition.
Computerized texture analysis based on ROI
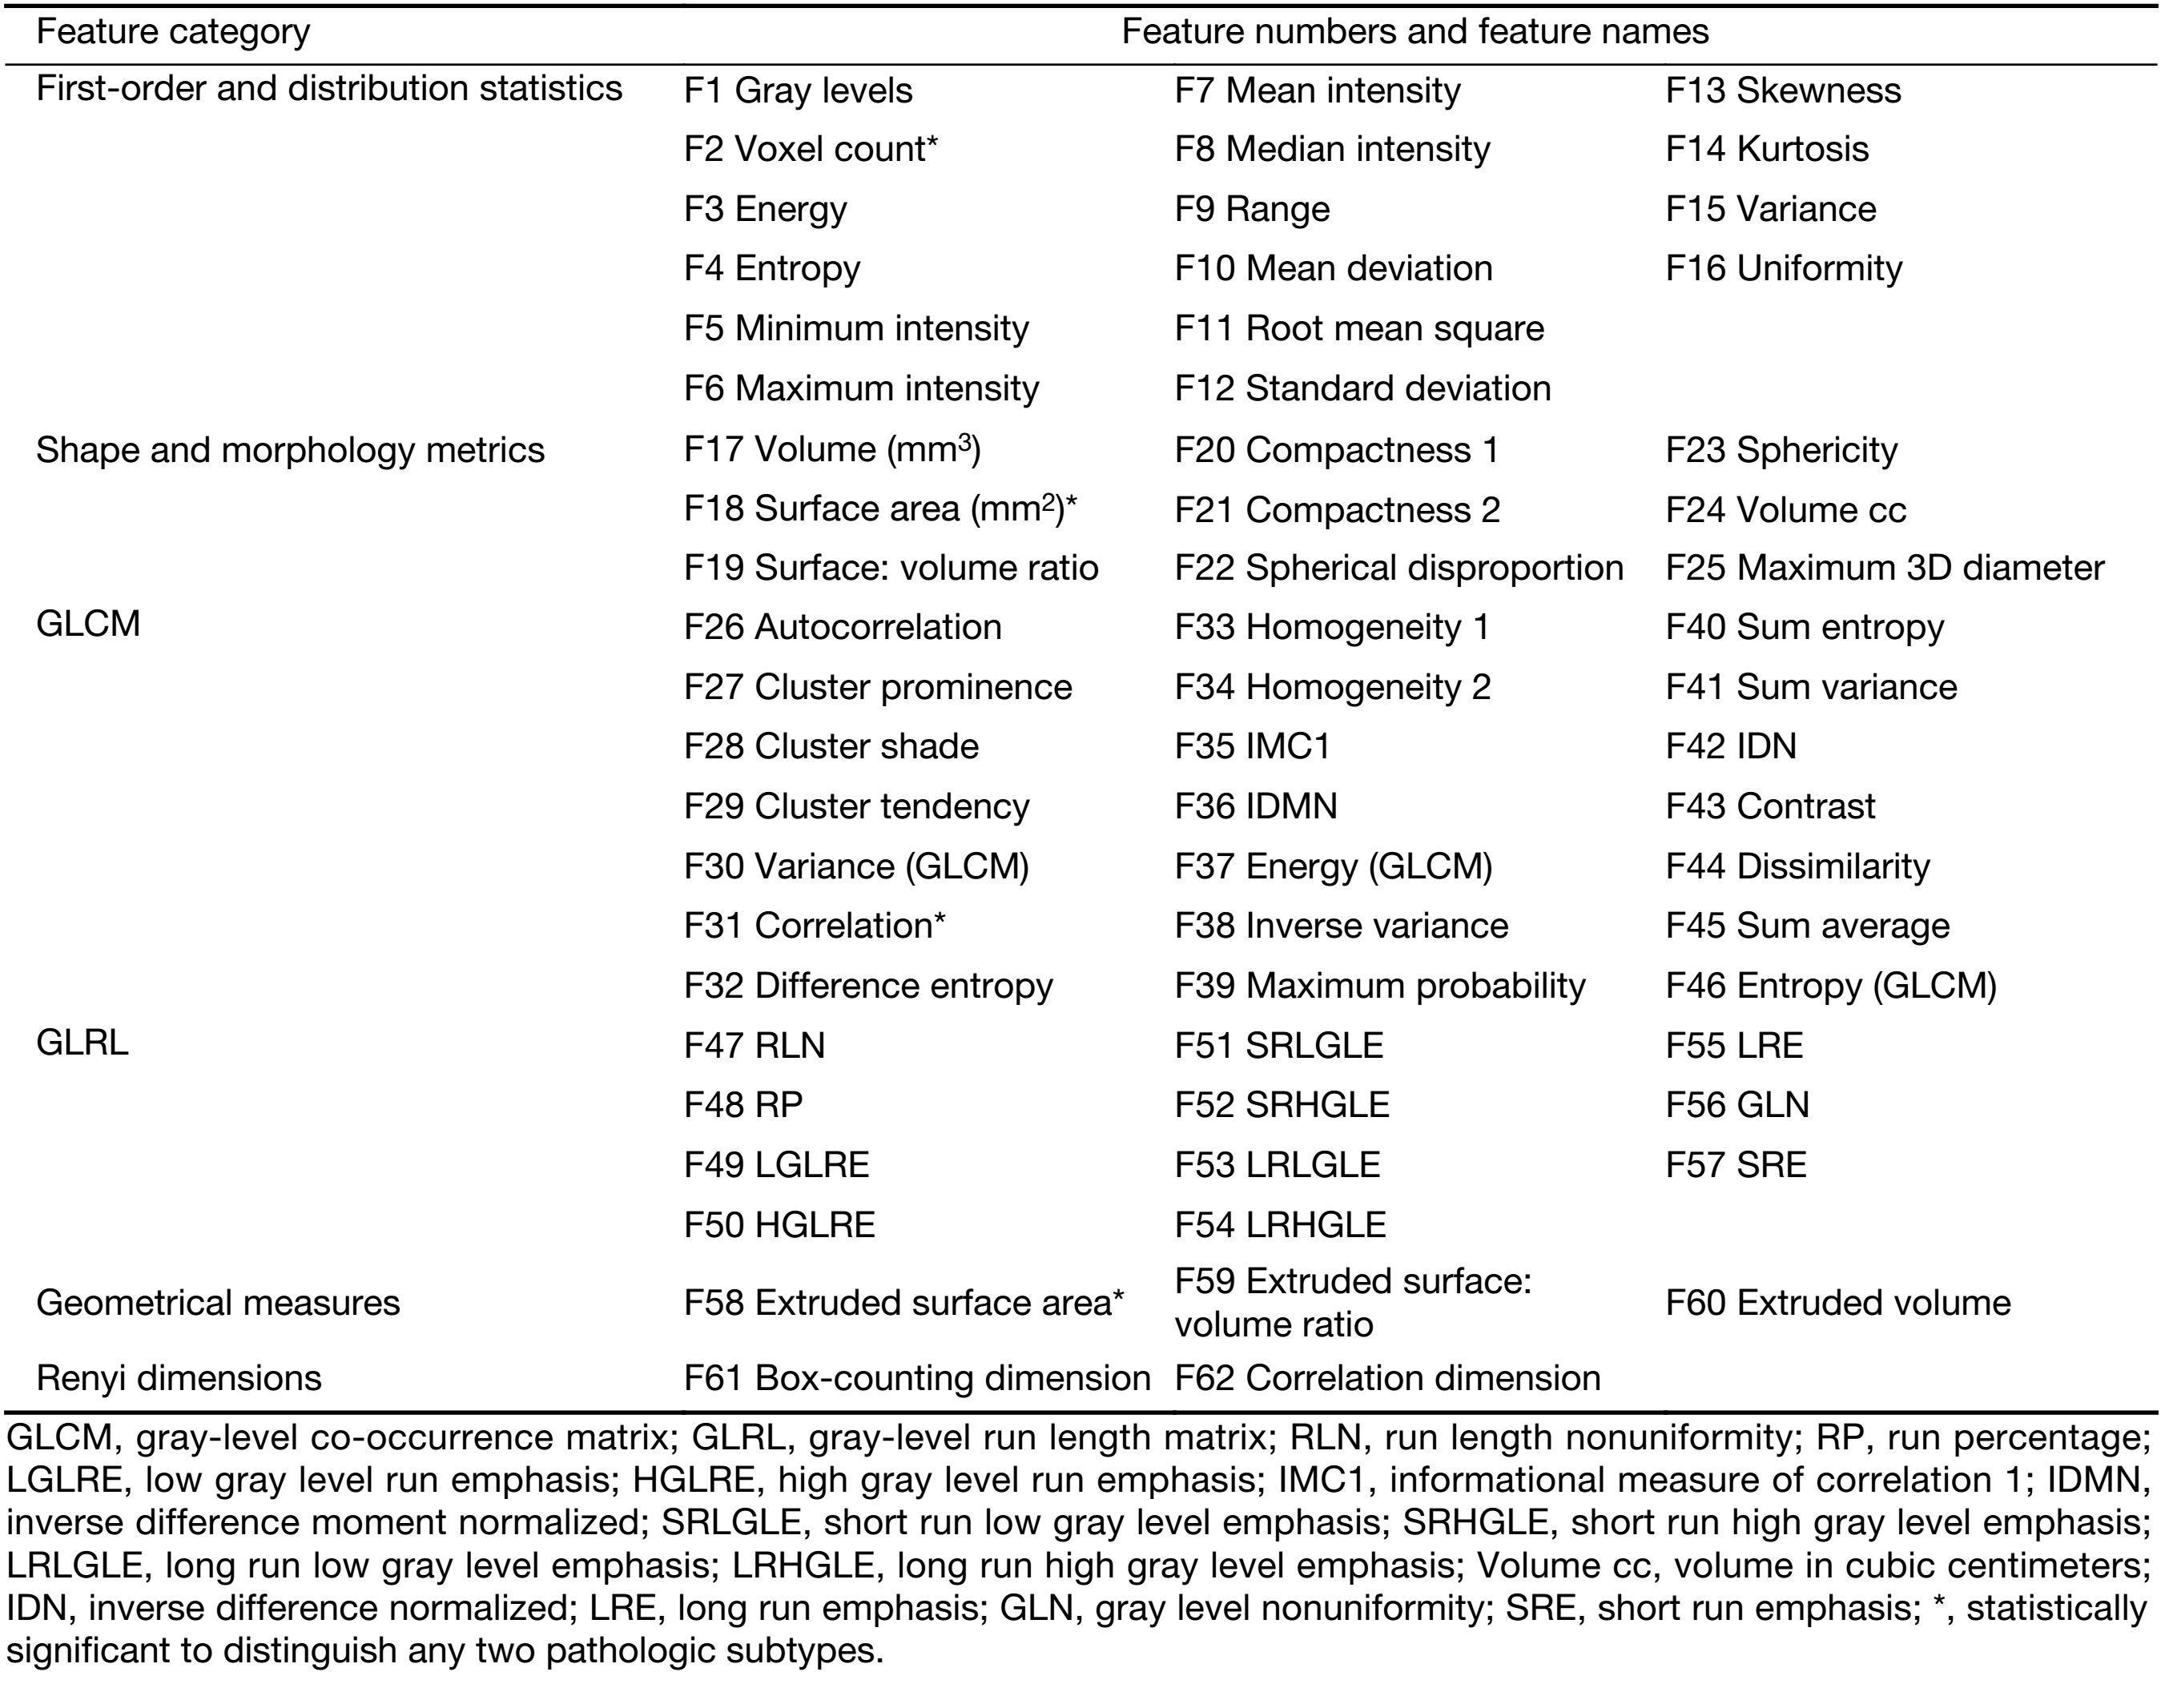
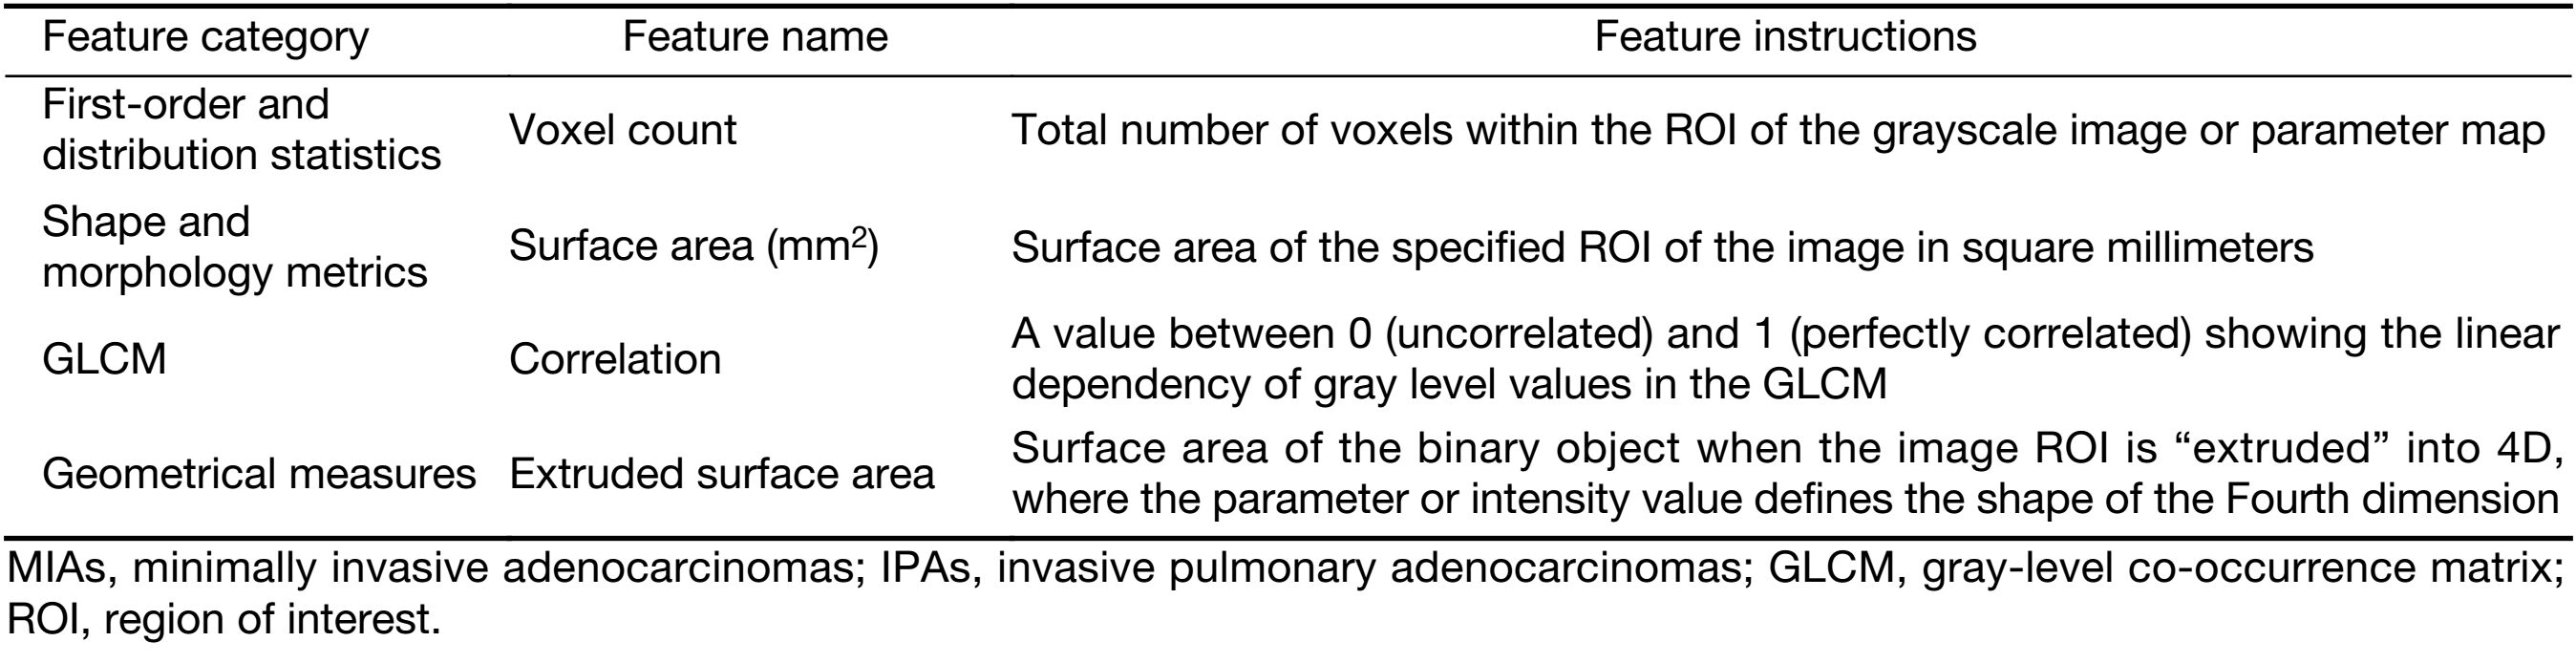
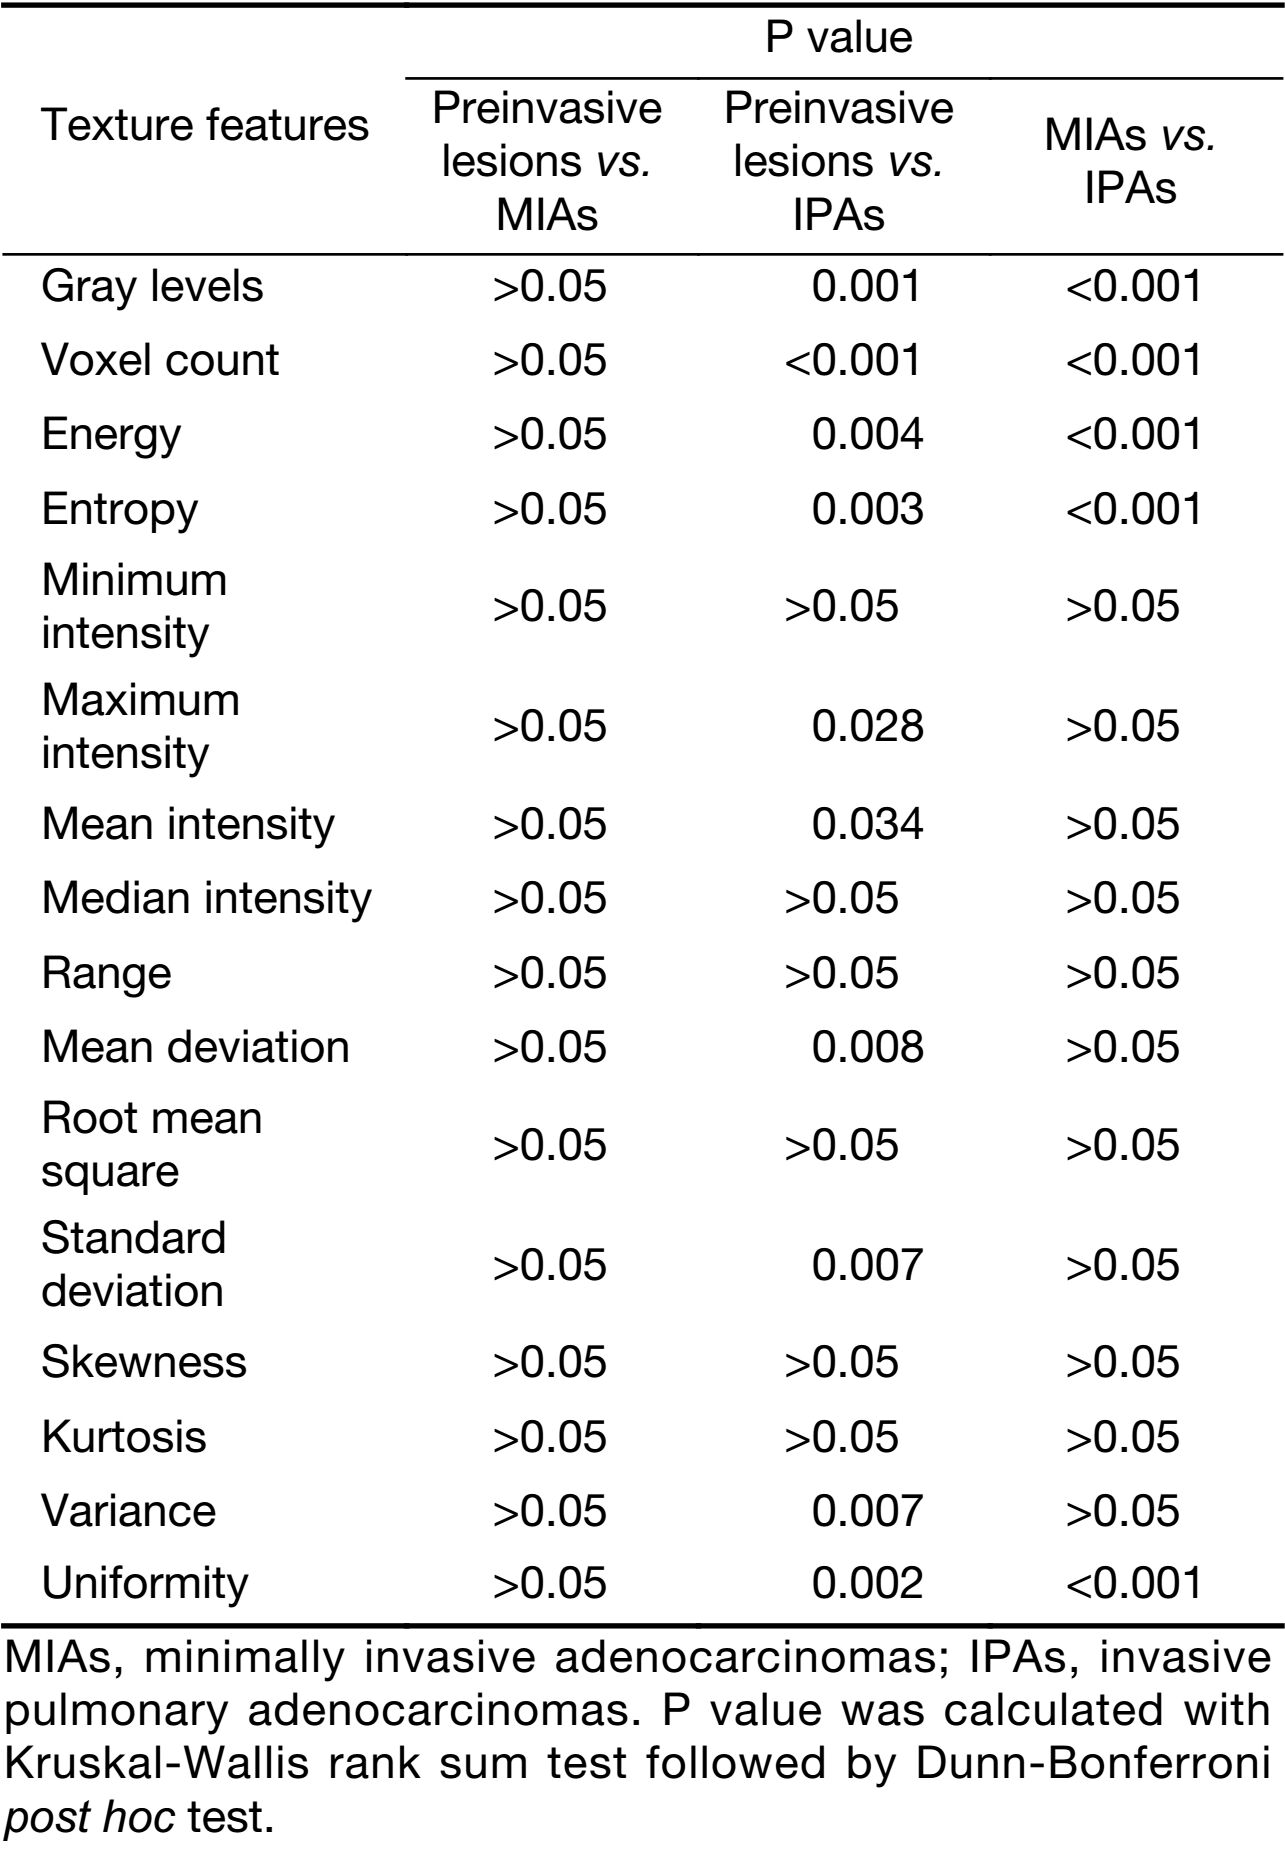
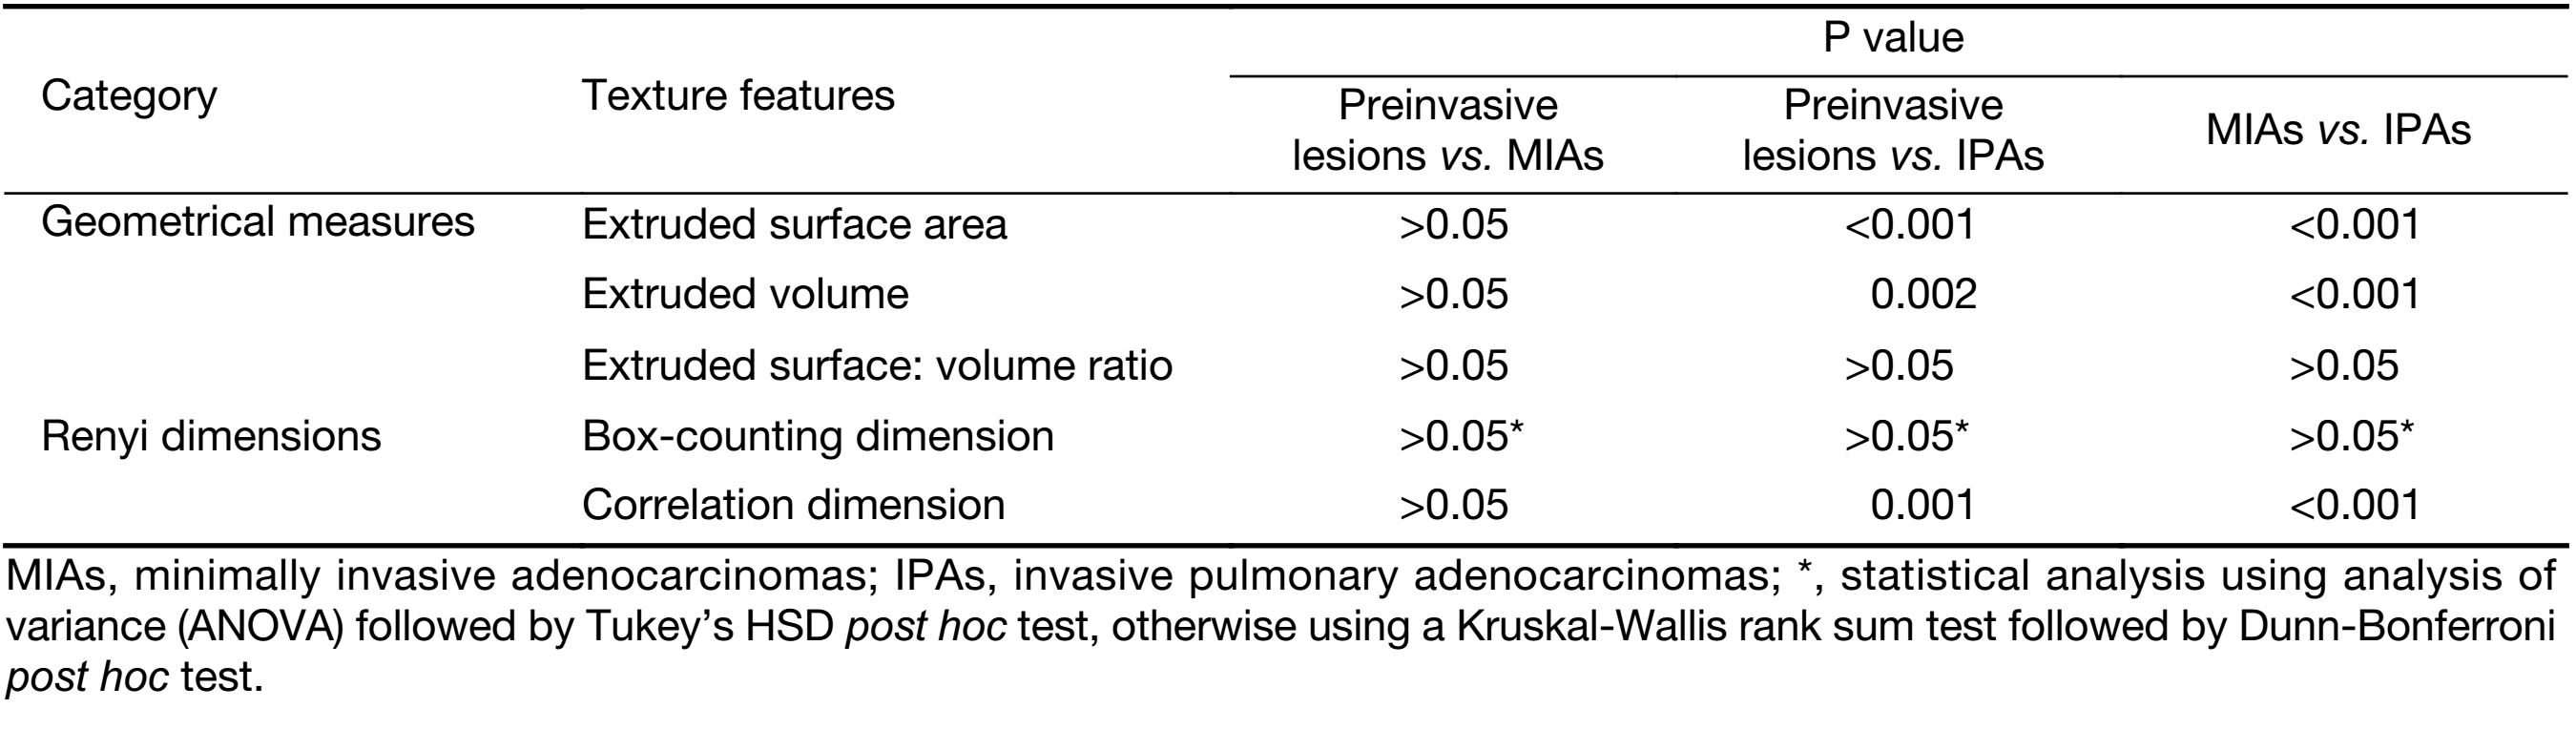
Radiomic analysis was performed using the 3D slicer software (Version 4.6.2; Surgical Planning Laboratory, Brigham and Women’s Hospital, MA, USA; http://www.slicer.org) (24). Then, the texture features were calculated and extracted automatically using the module called “Heterogeneity CAD”. The radiomic features (a total of 62 features; Supplementary Table S1) were divided into six categories, including: 1) first-order and distribution statistics; 2) shape and morphology metrics; 3) Renyi dimensions; 4) geometrical measures; 5) the gray-level co-occurrence matrix (GLCM); and 6) the gray-level run length matrix (GLRL). The details of the significantly different features that were found to distinguish any two pathologic subtypes in the present study are shown in Table 1 and all other feature instructions can be found in the 3D slicer software (https://www.slicer.org/wiki/Documentation/Nightly/Modules/HeterogeneityCAD).
Full table
Full table
The overall procedure of this analytical scheme was performed by two radiologists with more than 3 years of experience in chest CT imaging. Finally, we computed the means of each of the CT texture feature values measured by the two independent observers. The interobserver agreement regarding the texture features of the GGO ROIs was calculated using the interclass correlation coefficient analysis (ICC) with SPSS software.
Statistical analysis
Features of the study population were reported as means followed by standard deviations or medians followed by ranges in light of their normality for the continuous variables, and as frequencies for the categorical variables. Initially, Shapiro-Wilk tests and Bartlett’s tests were performed to confirm the normality and variance homogeneity of the data regarding the features. Subsequently, a Kruskal-Wallis rank sum test followed by Dunn-Bonferroni post hoc test or an analysis of variance (ANOVA) followed by Tukey’s HSD post hoc test where appropriate, was used to indicate the significant differences among the three groups. The data were corrected by Bonferroni’s approach (P<0.05) with two-sided to control for the type-1 errors.
Logistic regression analysis was conducted to find better predictors in distinguishing any two of the pathologic subtypes. Features with P<0.05 in univariable model were entered into the multiple logistic regression analysis. The stepwise model selection that mixed both forward and backward methods of variable selection using Akaike’s information criterion (AIC) was used to select the final predictive model, and feature with P>0.05 was eliminated. Receiver operating characteristic (ROC) curves for each model were constructed. AUC and its 95% confidence interval (95% CI) estimated using DeLong’s method were calculated to evaluate the performances of the regressive models. P<0.05 was considered statistically significant.
All statistical analyses were conducted with Microsoft R Open (version 3.2.2; https://mran.microsoft.com/) in Microsoft Visual Studio Professional 2015 (version 14.0.25431.01 Update 3), and with IBM SPSS Statistics (Version 21.0; IBM Corp., New York, USA).
Results
Basic characteristics of patients and texture features of GGOs
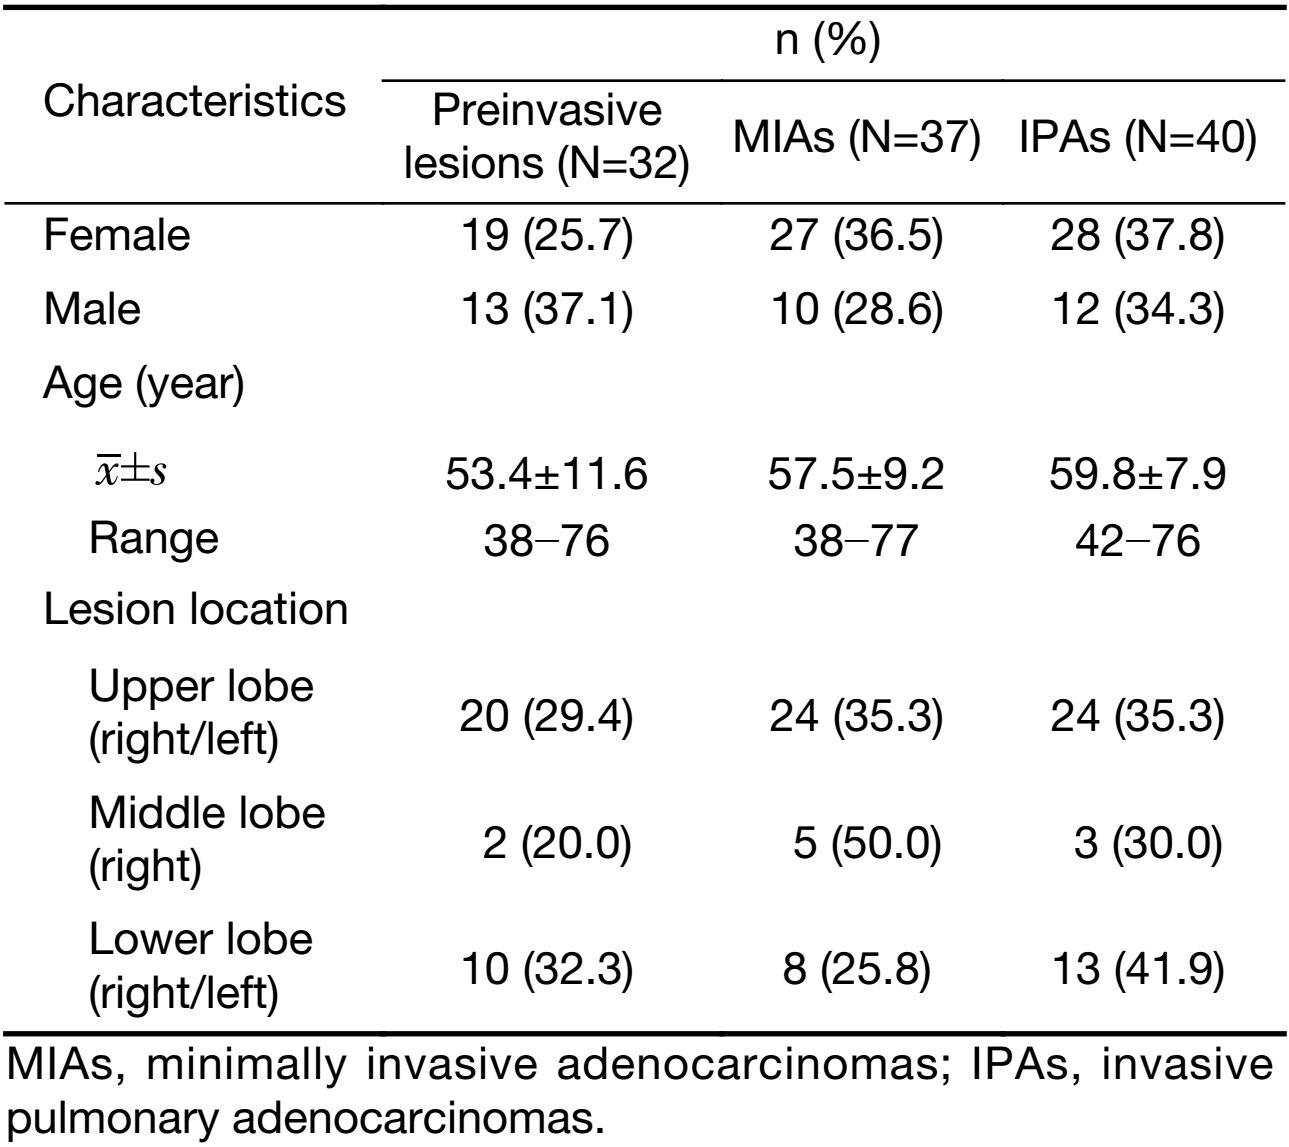
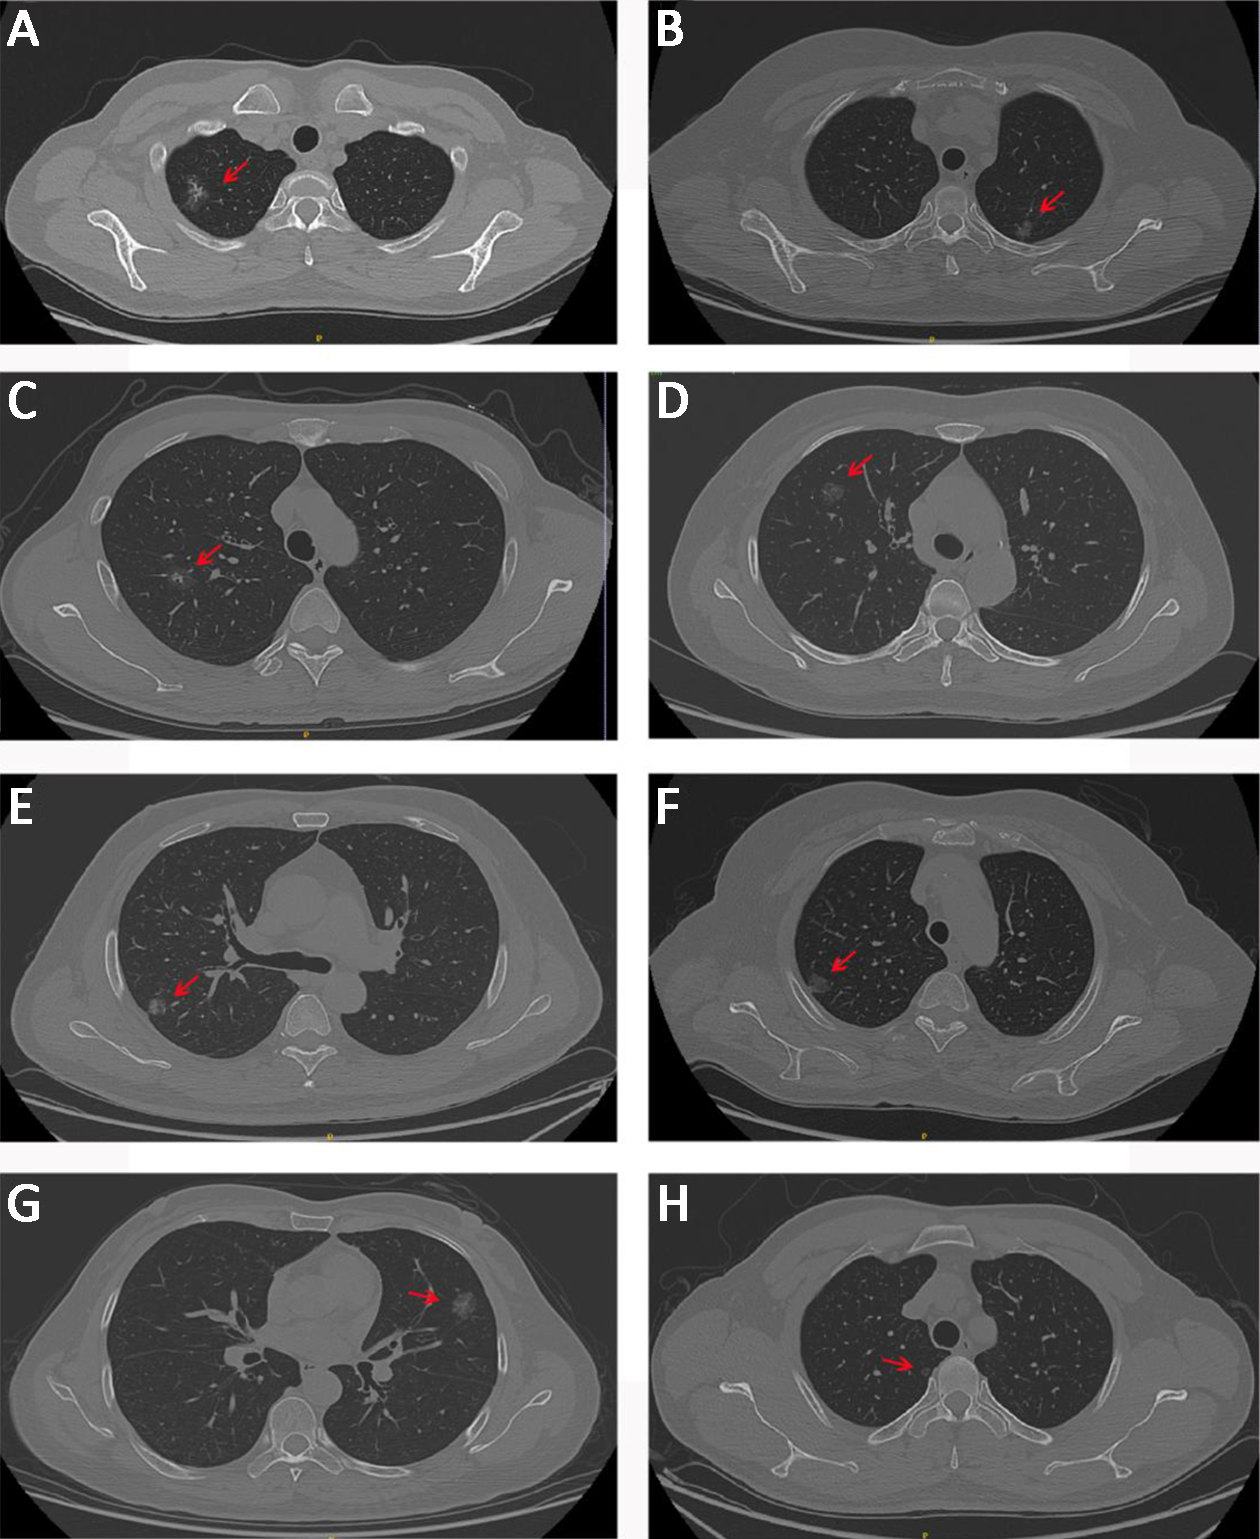
Patients’ basic characteristics and lesion information are shown in Table 2 and Supplementary Figure S1. The interobserver agreement regarding the texture features of the GGO ROI was generally acceptable (the value ranged from 0.417 to 0.999) (Supplementary Table S2).
Full table

Full table
Differences between preinvasive lesions and IPAs
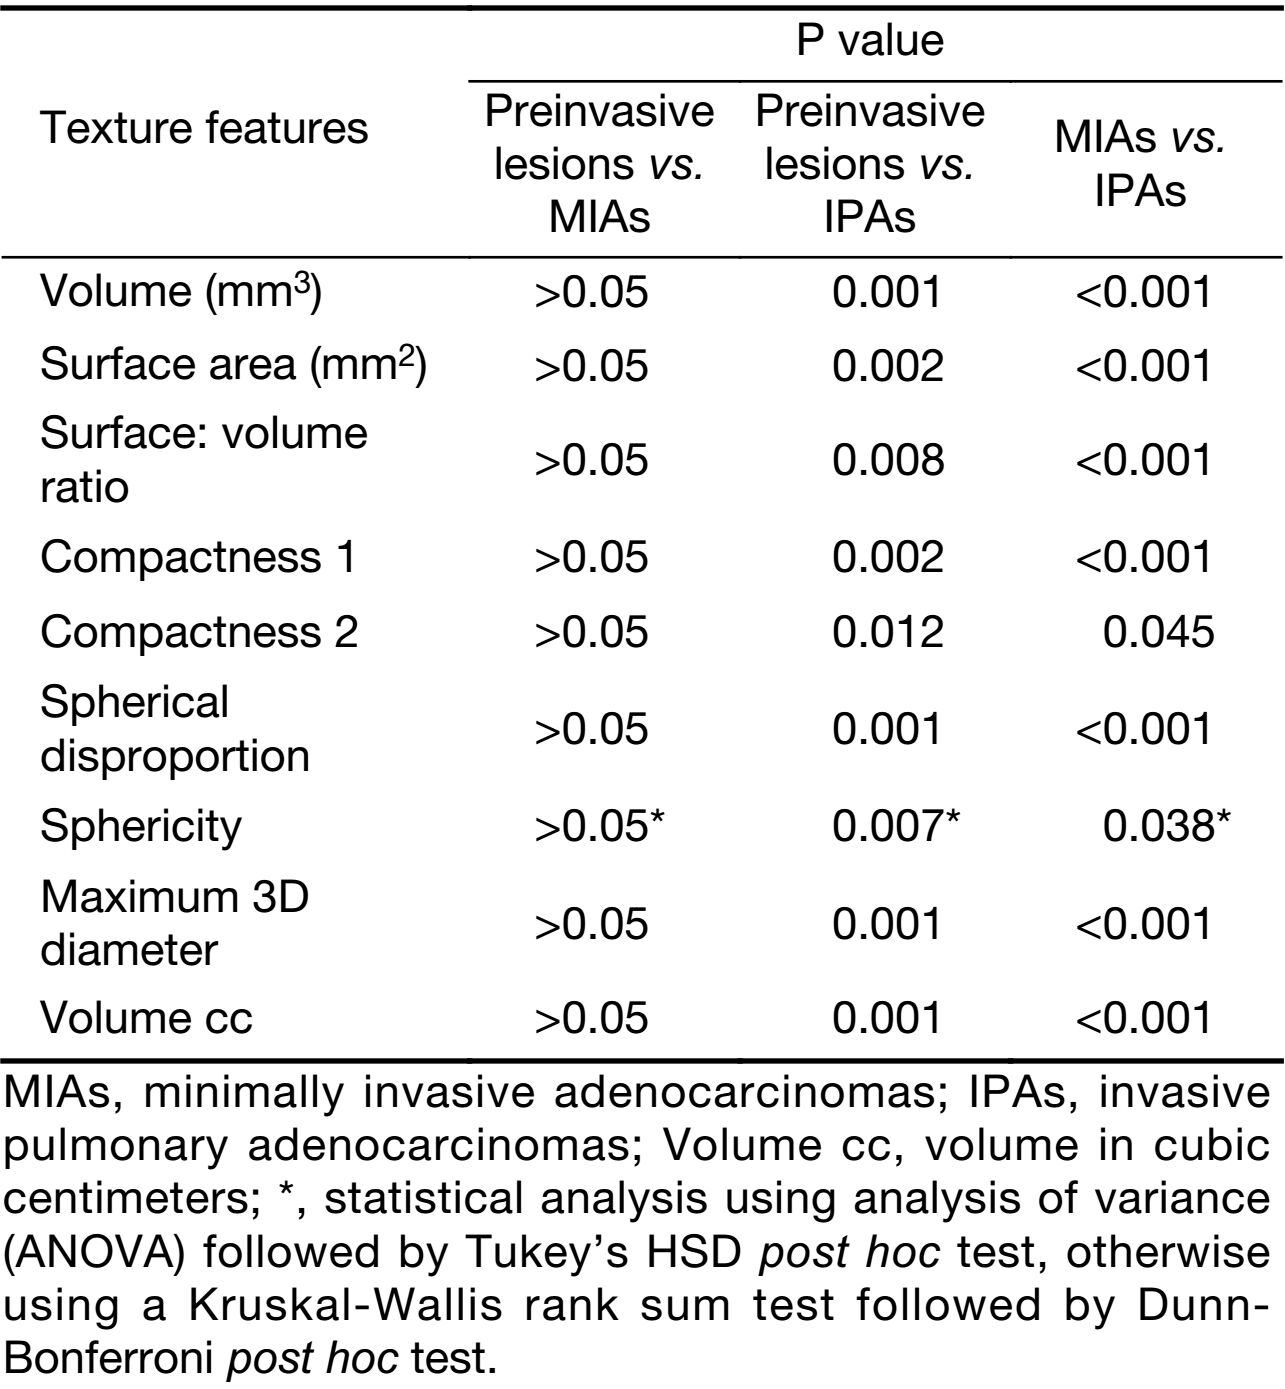
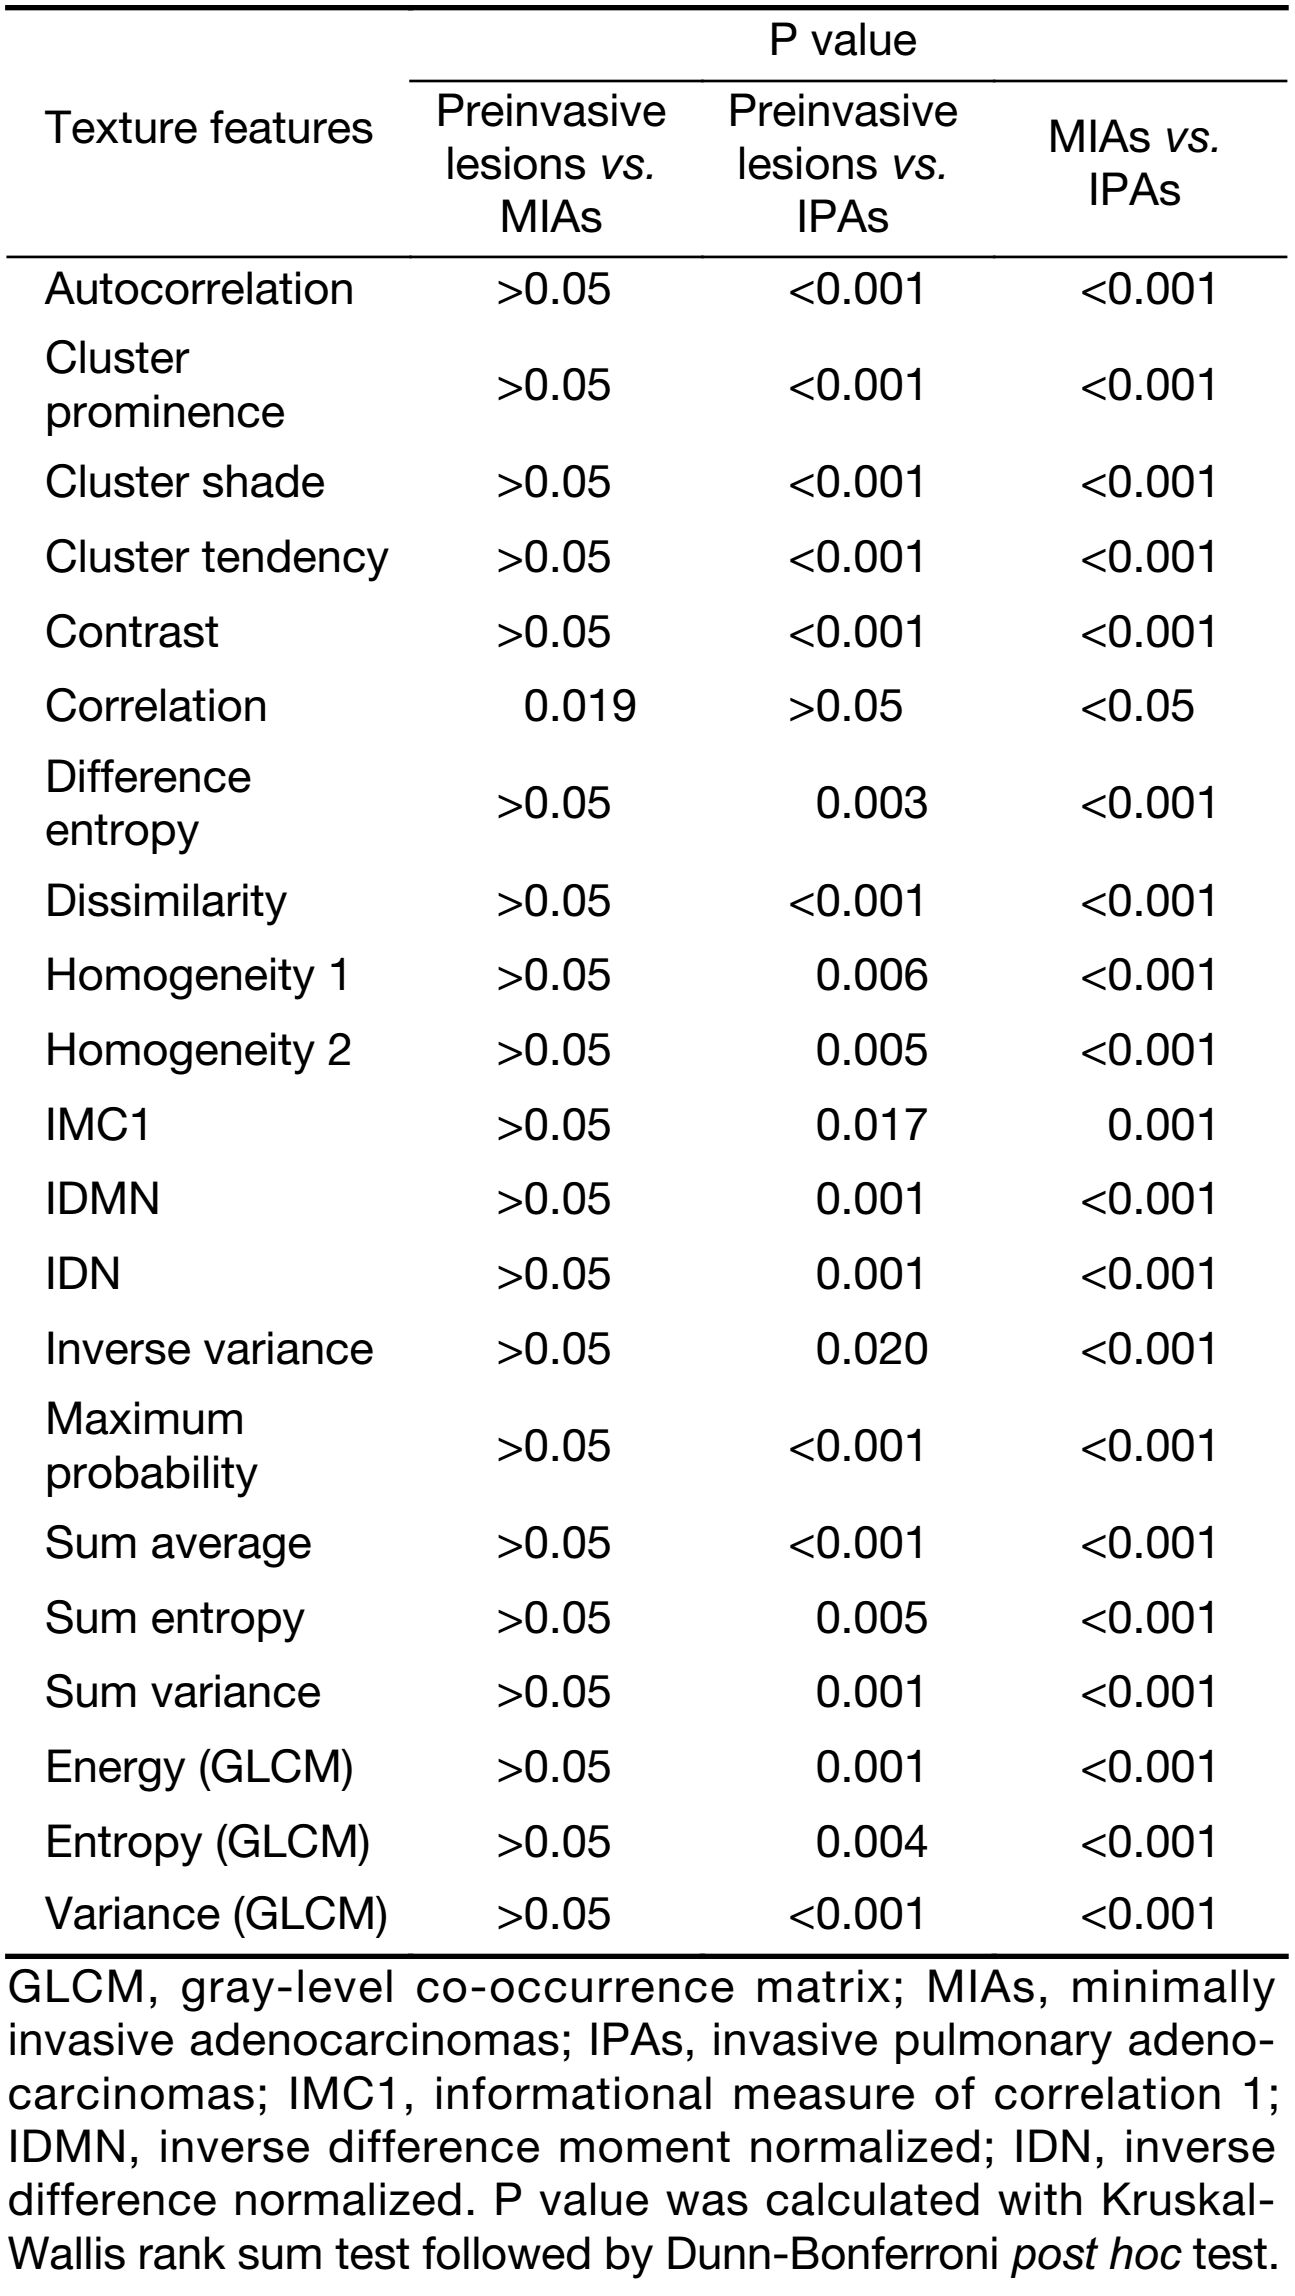
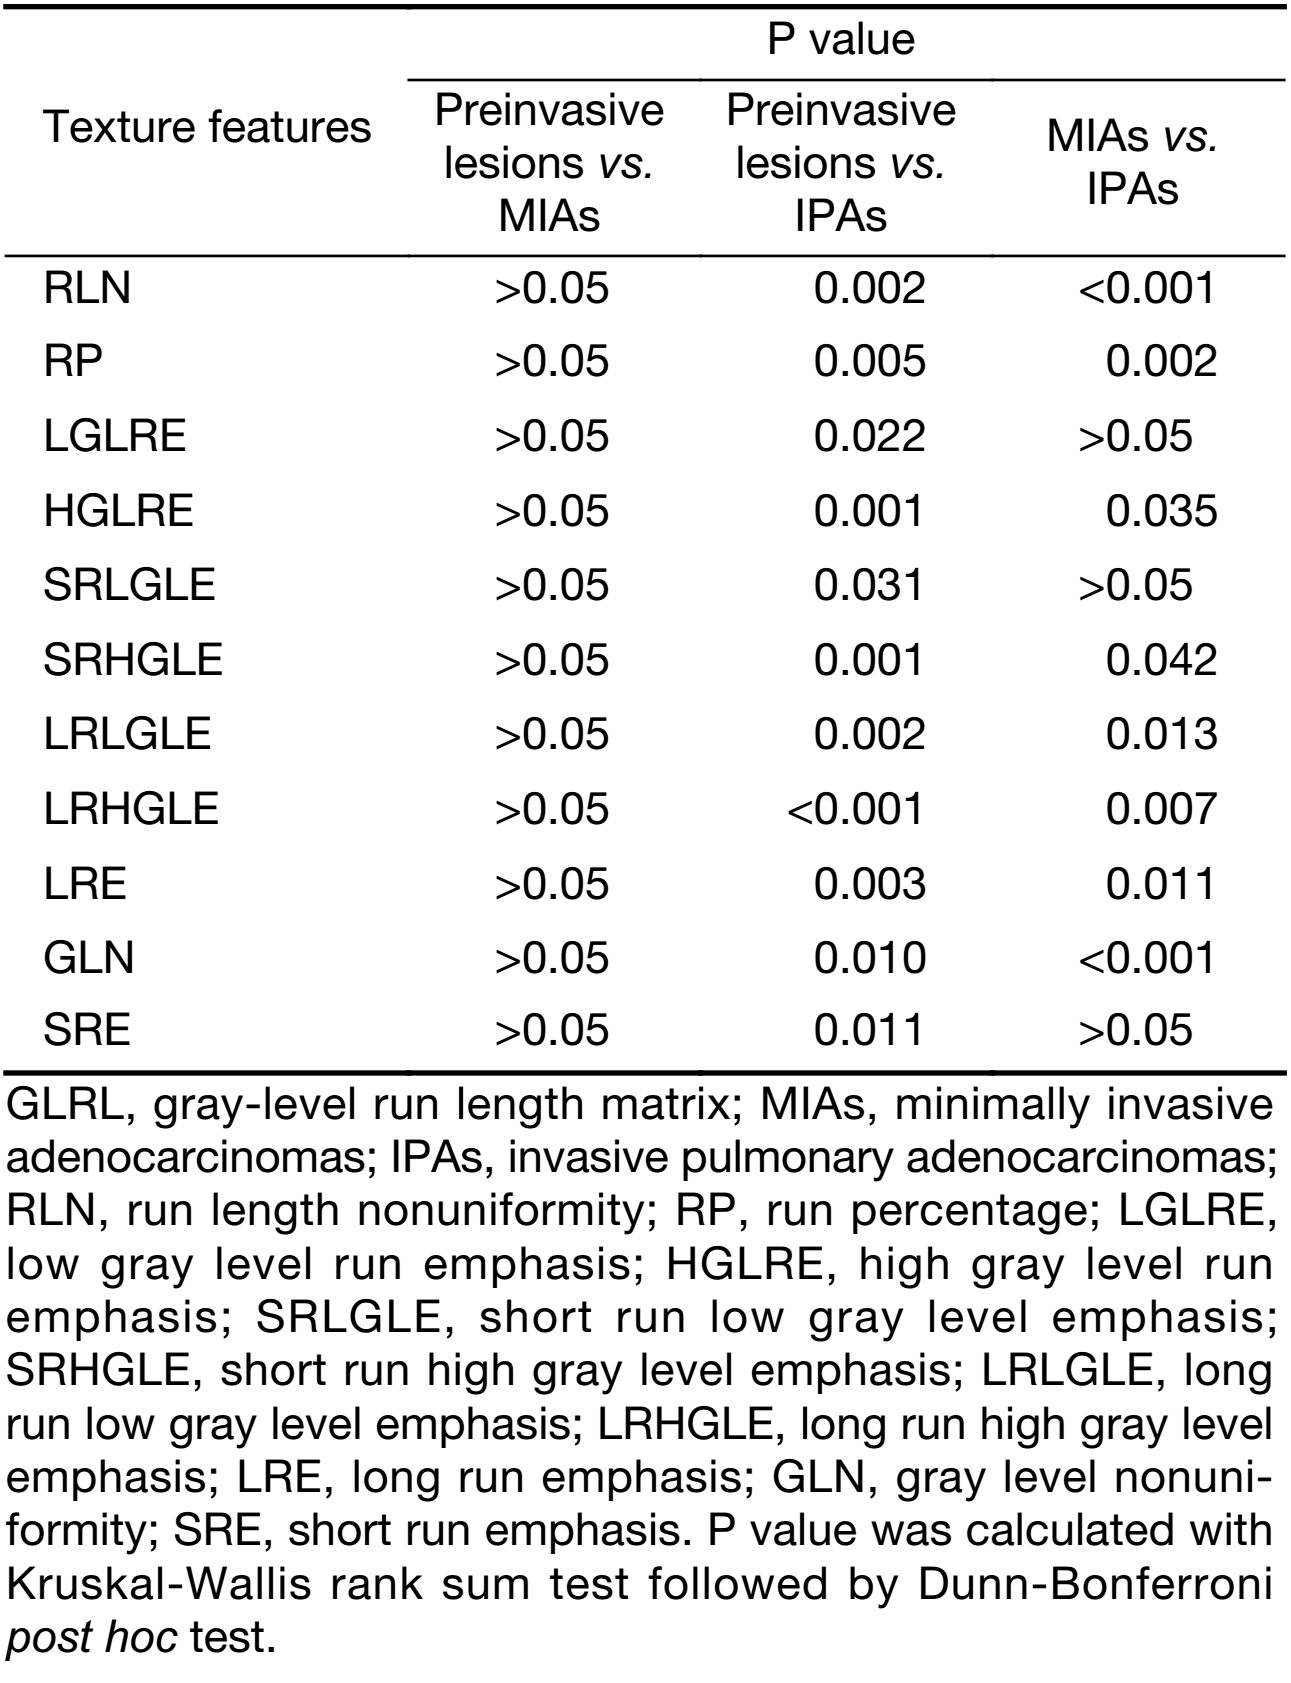
Significant differences between the preinvasive lesions (including AAH and AIS) and the IPAs appeared in most of the texture features of the first category (first-order and distribution statistics) (Table 3), the second category (shape and morphology metrics) (Table 4) and the texture matrix categories, such as the GLCM (Table 5), the GLRL (Table 6), and other categories (Table 7).
Full table
Full table
Full table
Full table
Full table
Differences between IPAs and MIAs
Similarly, there were also significant differences between the IPAs and MIAs in terms of many of the texture features of the GGOs, which were found in the first category (first-order and distribution statistics) (Table 3), the second category (shape and morphology metrics)
(Table 4) and the texture matrix categories, such as the GLCM (Table 5), the GLRL (Table 6) and other categories (Table 7).
Differences between preinvasive lesions and MIAs
Among the GGOs, the differences between the preinvasive lesions and MIAs in terms of the texture features were only found in the correlation feature of the GLCM category (Table 5).
Logistic regression analysis
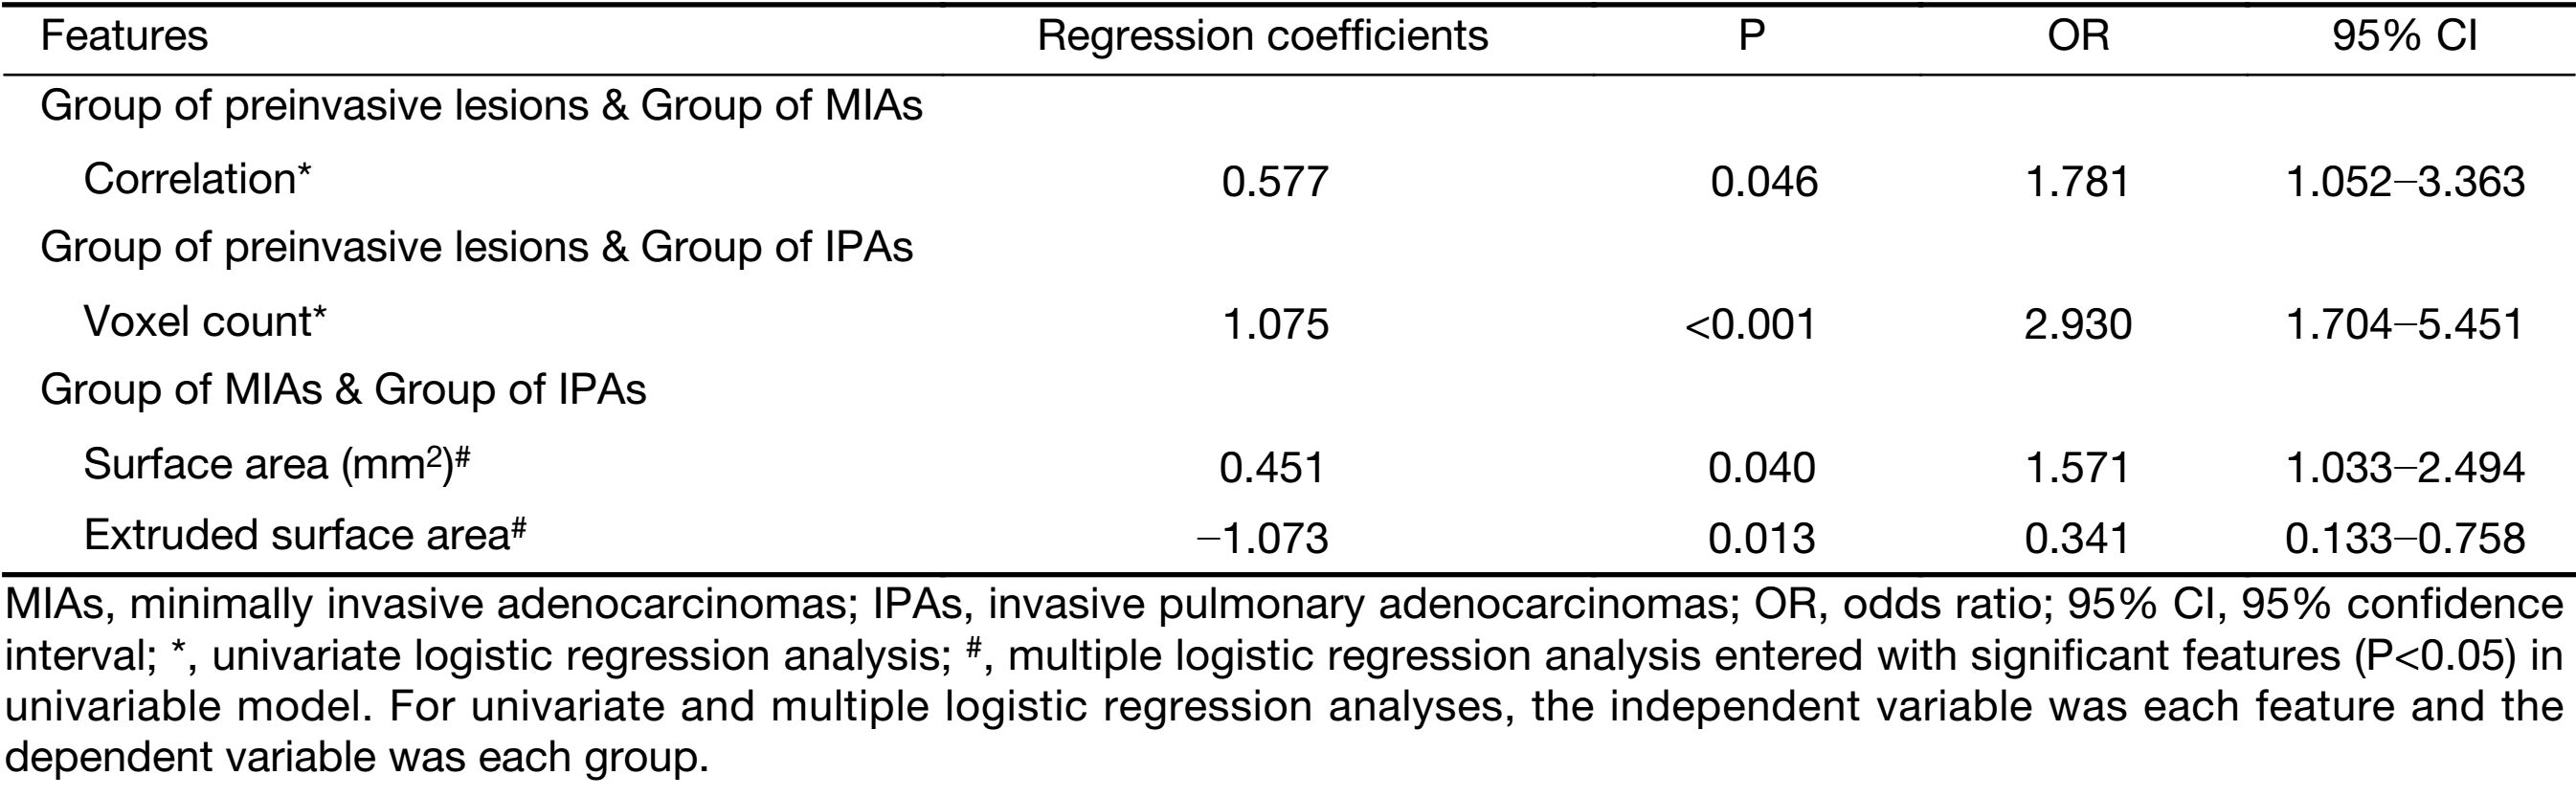
Univariate logistic regression analysis revealed that the voxel count feature (P<0.001) of the first category (first-order and distribution statistics) was a predictor of preinvasive lesions compared with IPAs (Table 8). For the preinvasive lesions and the MIAs, the correlation feature (P=0.046) of the GLCM category was the only independent predictors (Table 8). Between the MIAs and IPAs, the multiple logistic regression analysis showed that the surface area feature (P=0.040) of the secondary category (shape and morphology metrics) and the extruded surface area feature (P=0.013) of the fourth category (geometrical measures) were independent predictors. (Table 8)
Full table
ROC analysis
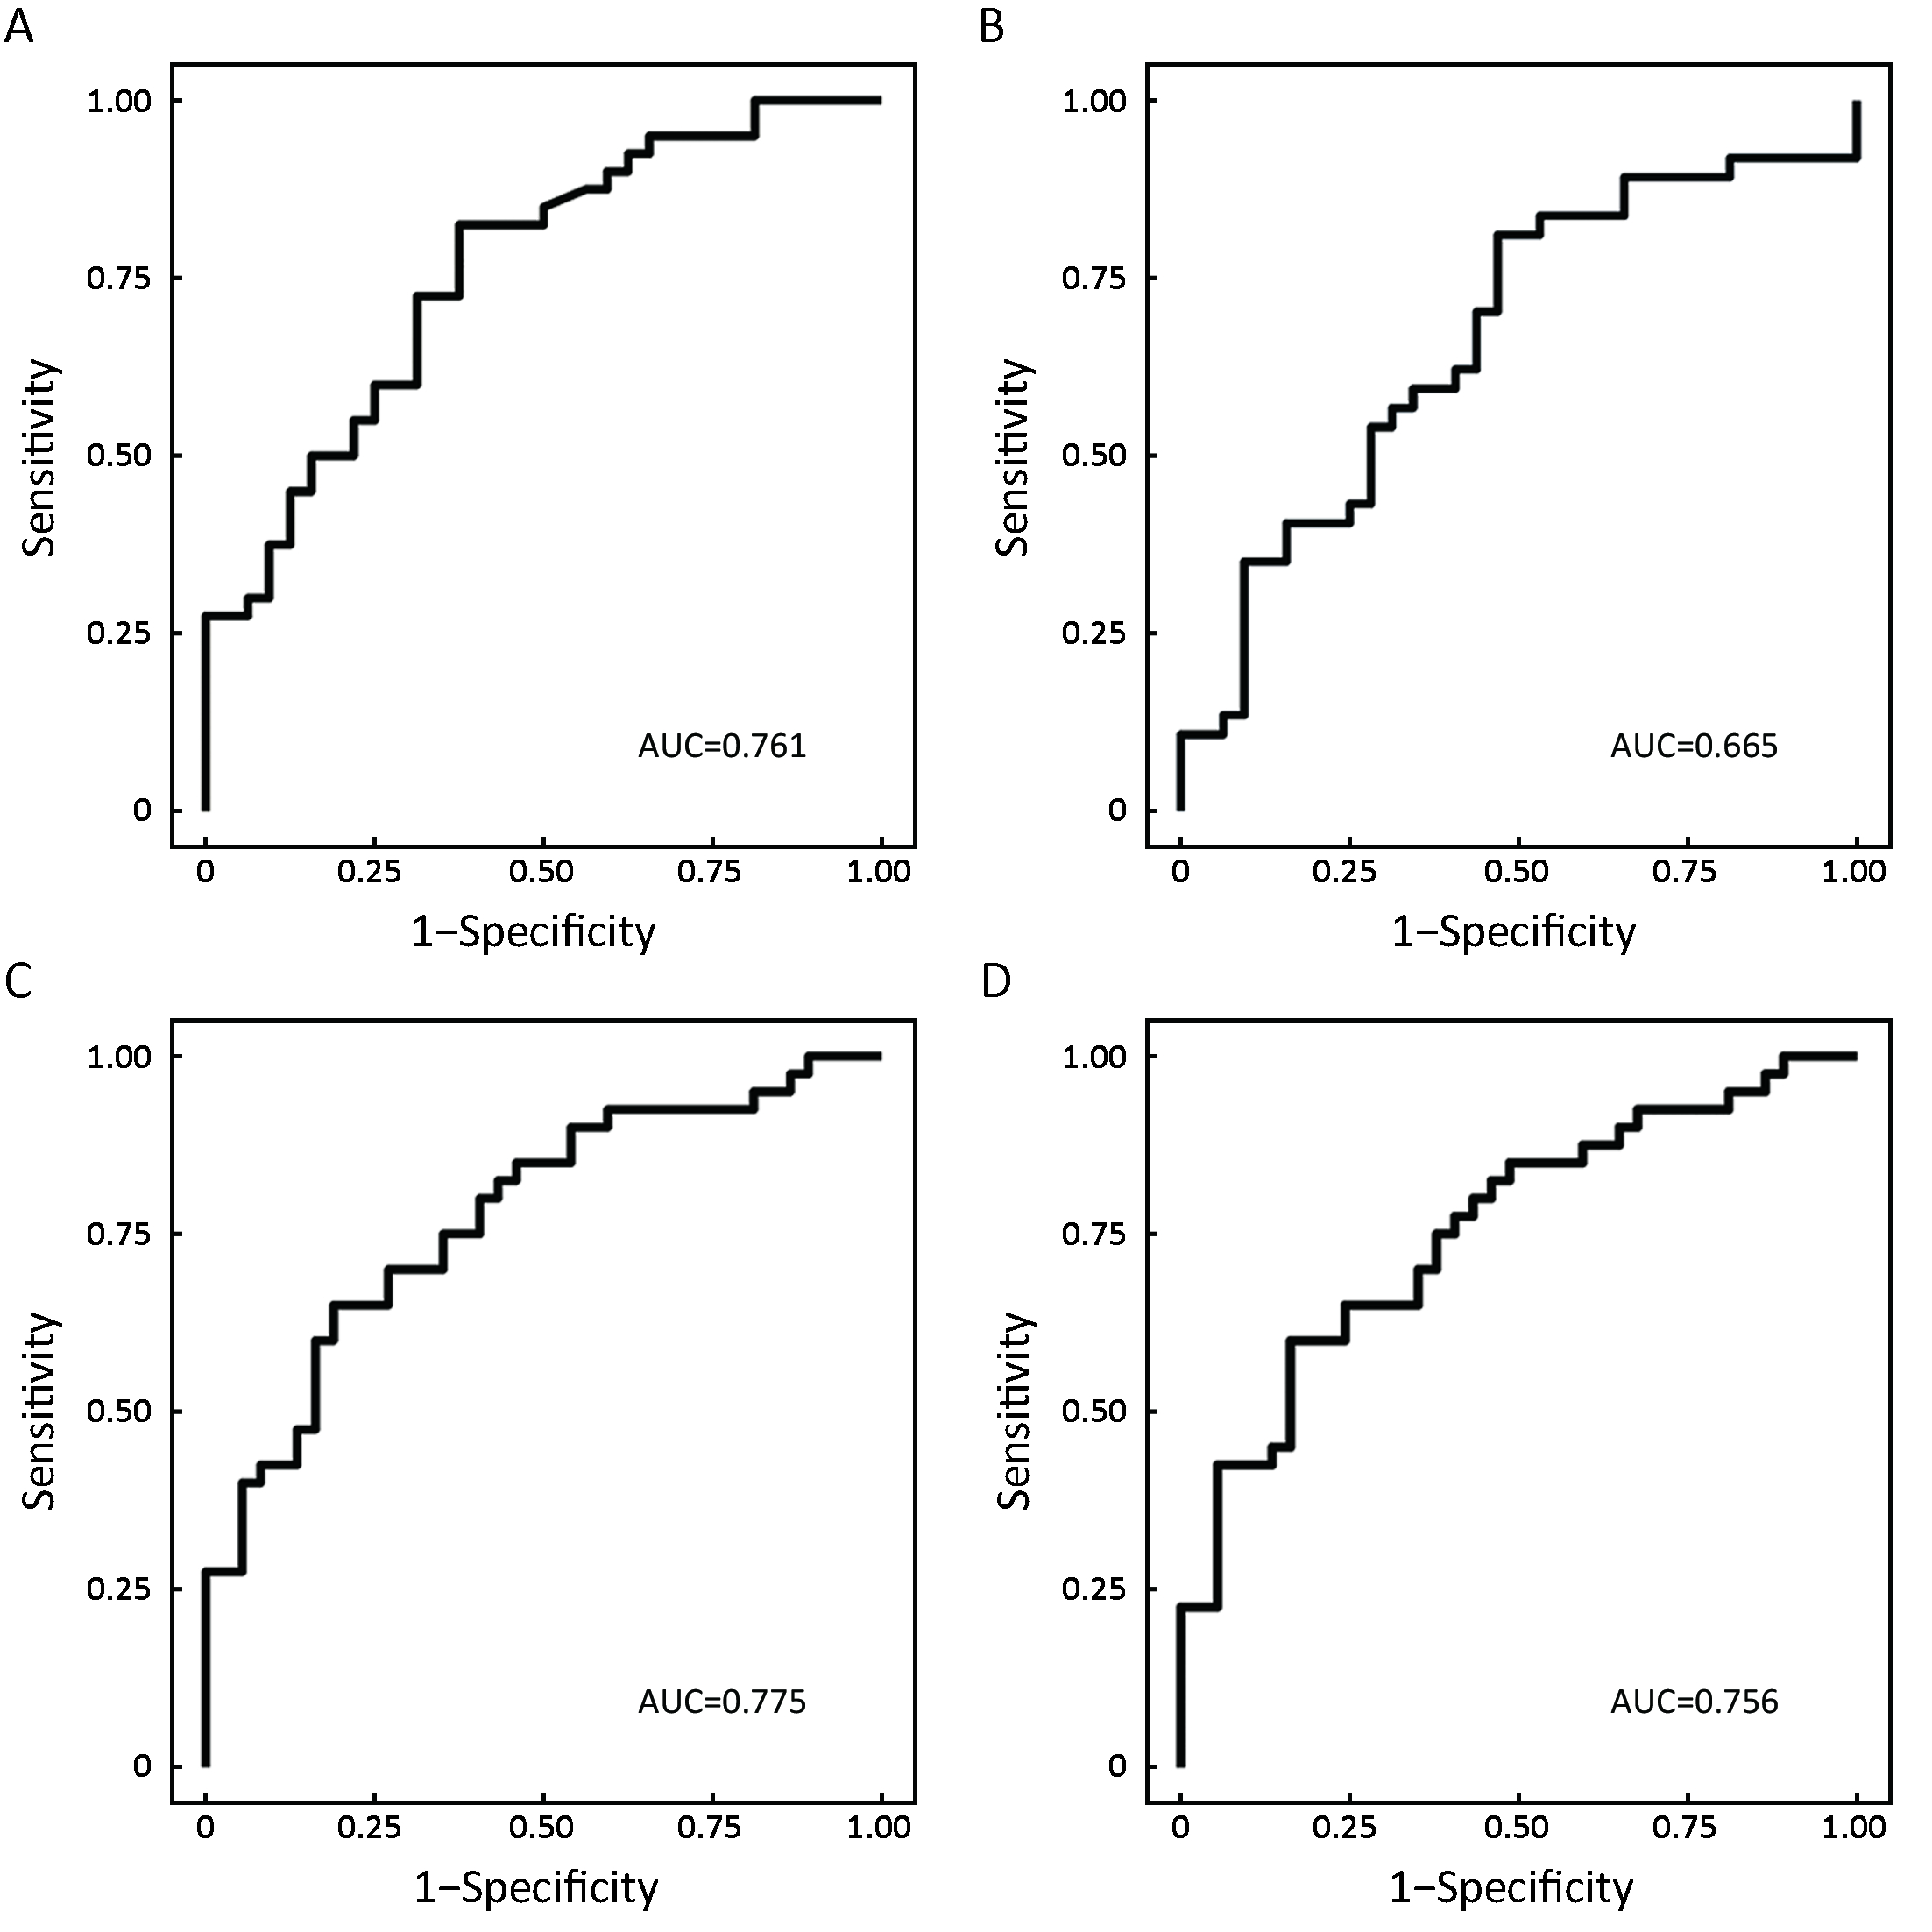
Based on the univariate and multiple logistic regression analyses, we investigated whether the features could accurately distinguish IPAs from MIAs or preinvasive lesions. The results showed that the voxel count feature was significantly different between the IPAs and preinvasive lesions, exhibiting 82.5% sensitivity and 62.5% specificity (95% CI: 0.650, 0.871; Figure 1A). The correlation feature could predict preinvasive lesions and MIAs better, with a sensitivity and specificity of 81.1% and 53.1%, respectively (95% CI: 0.533, 0.795;
Figure 1B). The surface area feature (95% CI: 0.671, 0.878) and the extruded surface area feature (95% CI: 0.648, 0.863) both achieved a sensitivity and specificity of more than 60% and 80%, respectively, in distinguishing IPAs from MIAs (Figure 1C, D). However, when incorporating the two features as regression variables in predicting the pathological subgroup jointly, the corresponding ROC analysis showed higher sensitivity and specificity of 67.5% and 86.5%, respectively.
Discussion
IPAs, MIAs and preinvasive lesions (including AAH and AIS) can all appear as GGO lesions on CT scans. We used radiomic analysis to investigate the differences among these three diseases in the present study. We ultimately found that the extruded surface area feature and the surface area feature could be used to predict IPAs compared with MIAs. We also found that the correlation feature could distinguish the MIAs from the preinvasive lesions, and the voxel count feature could distinguish preinvasive lesions from IPAs better.
For a long time, the study of the assessment of GGOs using CT particularly used visual features such as lesion size and the presence of pleural retraction (25), the proportion of the solid component, the shape and size of the lesion, and the window width (26). However, it was not an easy or accurate method for identifying the different diseases. To improve the diagnoses of the three diseases and to address the challenge of differential diagnoses, many studies have adopted quantitative methodological analyses to evaluate GGOs. Texture features provide a more comprehensive assessment of GGOs. Some features have been found to be especially sensitive in the detection of tumor heterogeneity.
In recent years, several studies have applied texture analysis of GGOs. One study (27) found that higher kurtosis and smaller mass are significant differentiators of preinvasive lesions from IPAs; however, they only focused on partly-solid GGOs and few texture features, such as histogram features, volumetric features, and morphological features. Son et al.(28) studied nodule size, volume, density, mass, skewness/kurtosis, and the CT attenuation values of the histograms, in addition to the texture features (uniformity and entropy) of ground-glass opacity nodules with little or no solid component using CT. That study found that the CT attenuation values and entropy could be used as independent predictors of invasive adenocarcinomas. Quantitative analyses of preoperative CT imaging metrics can help to distinguish invasive adenocarcinomas from preinvasive lesions or MIAs.
Based on the preceding studies, the present studies focused on GGOs and obtained more than 50 texture features, including not only morphology but also matrix information regarding the GGOs. In our study, we focused on not only partly-solid GGO lesions but also many of the texture features. We found that many texture features, including morphology and the matrix information, were significantly different between each pair of the groups of preinvasive lesions, MIAs and IPAs; however, we did not find that the kurtosis (27) or entropy (28) were significant predictors of preinvasive lesions, MIAs or IPAs. This may have been due to the different sample sizes and categories of lesions.
In our study, we found that the voxel count feature was a significant differentiator of preinvasive lesions from IPAs. The voxel count is the total number of voxels within an ROI, therefore, the voxel count feature reflects the size and mass of GGOs. We found that a larger voxel count increased the probability of IPAs. Therefore, it could be suggested that preinvasive lesions have smaller voxels; in others words, they have smaller sizes or masses. In fact, many previous studies (20) involving the morphological assessment of GGOs revealed that preinvasive lesions could be distinguished from IPAs with smaller lesion sizes. In turn, the GGOs of larger sizes or with larger solid components had a higher likelihood of being invasive adenocarcinomas (MIAs and IPAs) (29,30). A study based on texture analysis of partly solid GGOs found that the preinvasive lesions had significantly smaller volumes and masses than IPAs (27). The findings of our study corresponded to the findings of previous studies well.
We also found that the correlation feature was a significant differentiator of preinvasive lesions from MIAs. Correlation is a value that shows the linear dependency of gray level values in the GLCM. This feature reflects the correlation of the gray level in part of the images; its value reflects the contrast of the gray levels in the GLCM. The greater the mean of the gray level value of the GLCM is, the greater the value of the correlation is. In other words, when the gray level value of the GLCM is different, the value of the correlation is smaller. In our study, we found that a higher correlation was a significant differentiator of MIAs from preinvasive lesions. Several studies have suggested that increased heterogeneity is associated with malignant lung cancer (31) in GGOs and the solid portion within the lesion tends to be found in invasive lesions (32). Heterogeneous changes in the ROIs in our study may have been reflected by the gray level values and even by the correlation feature, which is the reflection of gray level values in the GLCM.
MIAs and IPAs are both invasive lesions, and in our study, we found that the surface area feature and the extruded surface area feature were both differentiators of IPAs from MIAs. The extruded surface area feature is the measurement of the surface area when the image ROI is “extruded” into 4D space, in which the feature or intensity value defines the shape of the fourth dimension. The surface area feature measures the area of ROI two-dimensionally. In other words, the surface area feature and the extruded surface area feature both reflect the macroscopic size and shape of the ROI mass. IPAs are more malignant than MIAs in terms of pathology and disease recovery. Many studies of GGO morphology have suggested that IPAs have greater diameters than MIAs [5 mm or less (10,11) in diameter (4,9,10,12-14)]. In our study, we focused on the texture features of GGOs. The surface area feature and the extruded surface area feature reflected more global information regarding the size and shape of the ROI; and thus we believe that the surface area feature and the extruded surface area feature are more suitable for the revaluation of GGOs than the diameter of a nodule. More importantly, these features could reflect the homogeneity of ROIs using visualized data, and then be used to distinguish IPAs from MIAs.
However, our study still had several limitations. First, the sample size of this study was not big enough. In future studies, we will enlarge the sample size and do some prospective research. Second, the manual delineation of the ROI may have been bound to have had some errors. In future studies, when the sample size is big enough, it will be necessary to consider automatic segmentation of the ROI and then manual correction slice-by-slice. Third, the texture features in this study did not cover a large scale of features within the GGOs. In future studies, more detailed information hidden in the lesion images needs to be obtained.
Conclusions
In our study based on texture features analyses of GGOs, the voxel count feature was a significant differentiator of preinvasive lesions from IPAs. The preinvasive lesions can be differentiated from MIAs using the correlation feature. The differences between MIAs and IPAs could be accurately reflected by the surface area feature and the extruded surface area feature. Further details and proper explanations of the texture features require more studies.
Acknowledgements
This work was supported by the Special Fund of Pharmacy, Radiology and Ecsomatics of Tianjin Medical University Cancer Institute & Hospital (No. Y1507).
Footnote
Conflicts of Interest: The authors have no conflicts of interest to declare.
References
- Chen W, Zheng R, Zhang S, et al. Cancer incidence and mortality in China in 2013: an analysis based on urbanization level. Chin J Cancer Res 2017;29:1–10. [PubMed] DOI:10.21147/j.issn.1000-9604.2017.01.01
- Travis WD, Brambilla E, Noguchi M, et al. International Association for the Study of Lung Cancer/American Thoracic Society/European Respiratory Society: international multidisciplinary classification of lung adenocarcinoma. Proc Am Thorac Soc 2011;8:381–5. [PubMed] DOI:10.1513/pats.201107-042ST
- Ikeda K, Awai K, Mori T, et al. Differential diagnosis of ground-glass opacity nodules: CT number analysis by three-dimensional computerized quantification. Chest 2007;132:984–90. [PubMed] DOI:10.1378/chest.07-0793
- Aoki T, Tomoda Y, Watanabe H, et al. Peripheral lung adenocarcinoma: correlation of thin-section CT findings with histologic prognostic factors and survival. Radiology 2001;220(3):803–9. [PubMed] DOI:10.1148/radiol.2203001701
- Kim HY, Shim YM, Lee KS, et al. Persistent pulmonary nodular ground-glass opacity at thin-section CT: histopathologic comparisons. Radiology 2007;245:267–75. [PubMed] DOI:10.1148/radiol.2451061682
- Kim TJ, Goo JM, Lee KW, et al. Clinical, pathological and thin-section CT features of persistent multiple ground-glass opacity nodules: comparison with solitary ground-glass opacity nodule. Lung Cancer 2009;64:171–8. [PubMed] DOI:10.1016/j.lungcan.2008.08.002
- Takashima S, Maruyama Y, Hasegawa M, et al. CT findings and progression of small peripheral lung neoplasms having a replacement growth pattern. AJR Am J Roentgenol 2003;180:817–26. [PubMed] DOI:10.2214/ajr.180.3.1800817
- Gould MK, Fletcher J, Iannettoni MD, et al. Evaluation of patients with pulmonary nodules: when is it lung cancer?: ACCP evidence-based clinical practice guidelines (2nd edition). Chest 2007;132 Suppl 3:108S–130S. DOI:10.1378/chest.07-1353
- Nakazono T, Sakao Y, Yamaguchi K, et al. Subtypes of peripheral adenocarcinoma of the lung: differentiation by thin-section CT. Eur Radiol 2005;15:1563–8. [PubMed] DOI:10.1007/s00330-004-2595-7
- Travis WD, Garg K, Franklin WA, et al. Evolving concepts in the pathology and computed tomography imaging of lung adenocarcinoma and bronchioloralveolar carcinoma. J Clin Oncol 2005;23:3279–87. [PubMed] DOI:10.1200/JCO.2005.15.776
- Borczuk AC, Qian F, Kazeros A, et al. Invasive size is an independent predictor of survival in pulmonary adenocarcinoma. Am J Surg Pathol 2009;33:462–9. [PubMed] DOI:10.1097/PAS.0b013e318190157c
- Lim HJ, Ahn S, Lee KS, et al. Persistent pure ground-glass opacity lung nodules ≥10 mm in diameter at CT scan: histopathologic comparisons and prognostic implications. Chest 2013;144:1291–9. [PubMed] DOI:10.1378/chest.12-2987
- Lee HY, Lee KS, Han J, et al. Mucinous versus nonmucinous solitary pulmonary nodular bronchioloalveolar carcinoma: CT and FDG PET findings and pathologic comparisons. Lung Cancer 2009;65:170–5. [PubMed] DOI:10.1016/j.lungcan.2008.11.009
- Zwirewich CV, Vedal S, Miller RR, et al. Solitary pulmonary nodule: high-resolution CT and radiologic-pathologic correlation. Radiology 1991;179:469–76. DOI:10.1148/radiology.179.2.2014294
-
Zhang J, Wu J, Tan Q, et al. Why do pathological stage IA lung adenocarcinomas vary from prognosis?: a clinicopathologic study of 176 patients with pathological stage IA lung adenocarcinoma based on the IASLC/ATS/ERS classification. J Thorac Oncol 2013;8:1196–202.
[PubMed]
DOI:10.1097/JTO.0b013e31829f09a7>
- Yang ZG, Sone S, Takashima S, et al. High-resolution CT analysis of small peripheral lung adenocarcinomas revealed on screening helical CT. AJR Am J Roentgenol 2001;176:1399–407. [PubMed] DOI:10.2214/ajr.176.6.1761399
- Aoki T. Growth of pure ground-glass lung nodule detected at computed tomography. J Thorac Dis 2015;7:E326–8. [PubMed] DOI:10.3978/j.issn.2072-1439.2015.08.27
- Si MJ, Tao XF, Du GY, et al. Thin-section computed tomography-histopathologic comparisons of pulmonary focal interstitial fibrosis, atypical adenomatous hyperplasia, adenocarcinomain situ, and minimally invasive adenocarcinoma with pure ground-glass opacity . Eur J Radiol 2016;85:1708–15. [PubMed] DOI:10.1016/j.ejrad.2016.07.012
-
Li Q, Fan L, Cao ET, et al. Quantitative CT analysis of pulmonary pure ground-glass nodule predicts histological invasiveness. Eur J Radiol 2017;89:67–71.
[PubMed]
DOI:10.1016/j.ejrad.2017.01.024>
- Lee SM, Park CM, Goo JM, et al. Invasive pulmonary adenocarcinomas versus preinvasive lesions appearing as ground-glass nodules: differentiation by using CT features. Radiology 2013;268:265–73. [PubMed] DOI:10.1148/radiol.13120949
- Cohen JG, Reymond E, Lederlin M, et al. Differentiating pre- and minimally invasive from invasive adenocarcinoma using CT-features in persistent pulmonary part-solid nodules in Caucasian patients. Eur J Radiol 2015;84:738–44. [PubMed] DOI:10.1016/j.ejrad.2014.12.031
-
Felix L, Serra-Tosio G, Lantuejoul S, et al. CT characteristics of resolving ground-glass opacities in a lung cancer screening programme. Eur J Radiol 2011;77:410–6.
[PubMed]
DOI:10.1016/j.ejrad.2009.09.008>
- Seok Y, Cho S, Kim K, et al. Partly solid pulmonary nodules: waiting for change or surgery outright?. Interact Cardiovasc Thoracic Surg 2014;19:556–60. [PubMed] DOI:10.1093/icvts/ivu205
- Fedorov A, Beichel R, Kalpathy-Cramer J, et al. 3D Slicer as an image computing platform for the Quantitative Imaging Network. Magn Reson Imaging 2012;30:1323–41. [PubMed] DOI:10.1016/j.mri.2012.05.001
- Moon Y, Sung SW, Lee KY, et al. Pure ground-glass opacity on chest computed tomography: predictive factors for invasive adenocarcinoma. J Thorac Dis 2016;8:1561–70. [PubMed] DOI:10.21037/jtd.2016.06.34
- Mao H, Labh K, Han F, et al. Diagnosis of the invasiveness of lung adenocarcinoma manifesting as ground glass opacities on high-resolution computed tomography. Thorac cancer 2016;7:129–35. [PubMed] DOI:10.1111/1759-7714.12269
- Chae HD, Park CM, Park SJ, et al. Computerized texture analysis of persistent part-solid ground-glass nodules: differentiation of preinvasive lesions from invasive pulmonary adenocarcinomas. Radiology 2014;273:285–93. [PubMed] DOI:10.1148/radiol.14132187
- Son JY, Lee HY, Lee KS, et al. Quantitative CT analysis of pulmonary ground-glass opacity nodules for the distinction of invasive adenocarcinoma from pre-invasive or minimally invasive adenocarcinoma. PloS One 2014;9:e104066. [PubMed] DOI:10.1371/journal.pone.0104066
- Naidich DP, Bankier AA, MacMahon H, et al. Recommendations for the management of subsolid pulmonary nodules detected at CT: a statement from the Fleischner Society. Radiology 2013;266:304–17. [PubMed] DOI:10.1148/radiol.12120628
- Kim EA, Johkoh T, Lee KS, et al. Quantification of ground-glass opacity on high-resolution CT of small peripheral adenocarcinoma of the lung: pathologic and prognostic implications. AJR Am J Roentgenol 2001;177:1417–22. [PubMed] DOI:10.2214/ajr.177.6.1771417
- Ganeshan B, Abaleke S, Young RC, et al. Texture analysis of non-small cell lung cancer on unenhanced computed tomography: initial evidence for a relationship with tumour glucose metabolism and stage. Cancer Imaging 2010;10:137–43. [PubMed] DOI:10.1102/1470-7330.2010.0021
- Min JH, Lee HY, Lee KS, et al. Stepwise evolution from a focal pure pulmonary ground-glass opacity nodule into an invasive lung adenocarcinoma: an observation for more than 10 years. Lung Cancer 2010;69:123–6. [PubMed] DOI:10.1016/j.lungcan.2010.04.022