
A radiomic nomogram based on an apparent diffusion coefficient map for differential diagnosis of suspicious breast findings
Introduction
Breast cancer has become a global threat to women’s lives (1). The morbidity and mortality rank first and fifth, respectively, among tumors in Chinese women (2). Breast dynamic contrast-enhanced magnetic resonance imaging (DCE-MRI) has become increasingly important for the diagnosis of breast diseases (3). The Breast Imaging Reporting and Data System (BI-RADS) is the evaluation standard for breast lesions (4,5). Lesions classified as MRI BI-RADS 4 are suspicious, with a probability of malignancy ranging from 2% to 95% (the final probability depends on biopsy or other invasive methods). The great uncertainty of malignancy in BI-RADS 4 lesions and the subsequent invasive examinations increase the patient’s physiological and psychological burden (6). Improving noninvasive differentiation between benign and malignant breast MRI BI-RADS 4 suspected lesions has become a key problem in oncology.
Although not included in the MRI BI-RADS, diffusion-weighted imaging (DWI) and apparent diffusion coefficient (ADC) values are important for breast lesion diagnosis (7,8). Radiomic data are used to extract a large amount of feature information from the image by mining and analyzing the acquired feature data to establish an accurate diagnosis of the disease. Radiomic features can help to differentiate malignant from benign lesions; to predict the pathological type, early metastasis and prognosis of the tumor; and to generate an effective treatment plan (9-11). Researchers suggested that texture features extracted from DCE-MRI are effective for differentiation of malignant and benign, differentiation of pathological type and early prediction of breast cancer response to neoadjuvant chemotherapy (12-14). Compared to DCE-MRI radiomics alone, the combination of DCE-MRI radiomics with the ADC can be more effective in differentiating benign and malignant breast disease (15). However, no study has focused on the efficiency of DWI or ADC radiomic features in breast lesions classified as BI-RADS 4. In this paper, we developed a differential prediction model based on ADC radiomic features and then produced a visualized differential nomogram based on ADC radiomic features, pharmacokinetics and clinical features, including the morphology and ADC value, of breast MRI BI-RADS 4 lesions.
Materials and methods
Patients
This study was approved by the Institutional Review Board of the First Affiliated Hospital of China Medical University with a waiver of informed consent. Eighty-eight patients [mean age: 44±10 (range: 13−82) years] with biopsy-proven breast disease (52 malignant and 36 benign lesions), who underwent a pre-operative breast MRI examination between December 2014 and December 2015, were retrospectively included in this study. The inclusion criteria were as follows: 1) female; 2) diagnosed BI-RADS 4 lesion; 3) biopsy or surgery performed within one week after MRI; and 4) complete imaging and pathological data. We excluded patients who underwent breast cancer treatment before the MRI examination (e.g., surgery, biopsy, chemotherapy or radiation therapy). The malignant lesions consisted of 42 (80.8%) non-special-type invasive carcinomas, 7 (13.5%) ductal carcinomasin situ and 3 (5.7%) special-type invasive carcinomas. The benign tumors included 21 (58.3%) adenoses, 4 (11.1%) fibroadenomas, 5 (13.9%) intraductal papillomas and 6 (16.7%) others.
MRI examination
All preoperative breast MRI scans were performed on a 3.0 T scanner (MagnetomVerio, Siemens, Germany) equipped with a dedicated breast coil with the patient in the prone position. In each scan, a series of routine MRI sequences were performed, including 1) axial pre-contrast T1-weighted imaging; 2) axial pre-contrast T2-weighted imaging; 3) ADC mapping: a diffusion-weighted image was acquired with b=50, 400 and 800 s/mm2, time of repetition/time of echo (TR/TE) 9,300 ms/76 ms, image matrix 168 × 168, field of view (FOV) 32 cm × 32 cm, and slice thickness 4.0 mm; this image was reconstructed as an ADC map; 4) DCE imaging with the following sequence: TR/TE 4.67 ms/1.66 ms, image matrix 384 × 296, FOV 36 cm × 36 cm, slice thickness 2.5 mm; 0.1 mmol/kg of Gd-DTPA-BMA (Omni-Scan, GE Healthcare) was injected at a rate of 3 mL/s after the first dynamic phase, followed by flushing with 20 mL of saline. The continuous contrast-enhanced scans consisting of 9 phases lasted for 541 s in total.
Clinicopathologic and imaging data
Baseline clinicopathologic and imaging data, including the BI-RADS 4 sub-classification, ADC value and vascular permeability parameter Ktrans (rate of contrast agent uptake into the tumor from the blood), were derived from medical records and DCE and ADC sequences. Two breast radiologists with 11 and 13 years of experience, who were blinded to the pathological results, reviewed the images and classified them as BI-RADS 4A, 4B or 4C according to the BI-RADS guidelines (4,5) and MRI enhancement characteristics (6) until they reached a consensus. The ADC value was derived from a Siemens workstation on which regions of interest (ROIs) were delineated around the tumor outline for the largest cross-sectional area on T2-weighted and DCE images. The vascular permeability parameter Ktrans was calculated using Omni Kinetics software (GE Healthcare, China), in which the reference region model was used instead of the Tofts model due to the low time resolution.
Radiomic signature
Feature extraction
All feature extraction was performed using Artificial Intelligence Kit software (A.K. software; GE Healthcare, China). A total of 369 texture features, including tumor size, shape, first-order statistics of descriptor values (e.g., histogram features) and high-order texture features (e.g., gray level co-occurrence matrix and gray level run length) were extracted from the ADC map.
Feature selection
Sixty-three patients were randomly selected as the training cohort to build the model, and the other 25 patients were included in the testing cohort to test the model (Figure 1). A two-step feature selection technique was used to reduce the dimensions. First, the Kolmogorov-Smirnov test was applied to examine the normality of the variable distribution. A t-test was used to determine whether the feature was significantly different between the two groups (benign and malignant) for normally distributed features; otherwise, the Mann-Whitney test was used. P-values less than 0.05 were considered statistically significant. Then, an inter-feature coefficient was used to eliminate high-dimensional feature redundancy, and |r|>0.9 was set as the cutoff for strong relationships.

Radiomic signature model
Logistic linear regression was performed via a linear combination of selected features weighted by their respective coefficients, using 10-fold cross-validation, and repeated 10 times, which resulted in the radiomic score (Rad score). The performance is expressed as the sensitivity, specificity and area under the receiver operating characteristic (ROC) curve (AUC).
Nomogram
Multivariable logistic regression analysis was conducted with the Rad score and the following clinicopathologic candidate predictors: sub-classification, ADC value and Ktrans value. A nomogram was built based on this multivariable logistic analysis in the training cohort to provide a quantitative tool to predict benignancy and malignancy. Decision curve analysis was used to measure the benefit of the radiomic signature.
Statistical analysis
All statistical analyses were performed using the RStudio Server (Version 1.0.143; RStudio, Inc., Boston, MA, USA). Kolmogorov-Smirnov test was applied to examine the normality of the variable distribution. A Student's t-test was used to determine whether the feature was significantly different between the two groups (benign and malignant) for normally distributed features; otherwise, the Mann-Whitney test was used. A significance threshold of P<0.05 was set. Spearman correlation test was used to eliminate high-dimensional feature redundancy, and |r|>0.9 was set as the cutoff for strong relationships. Logistic linear regression was performed to link the selected features. Multivariable logistic regression was represented as a nomogram. ROC and Decision curve was plotted to evaluate the diagnostic efficiency of the model.
Results
Clinicopathologic characteristics
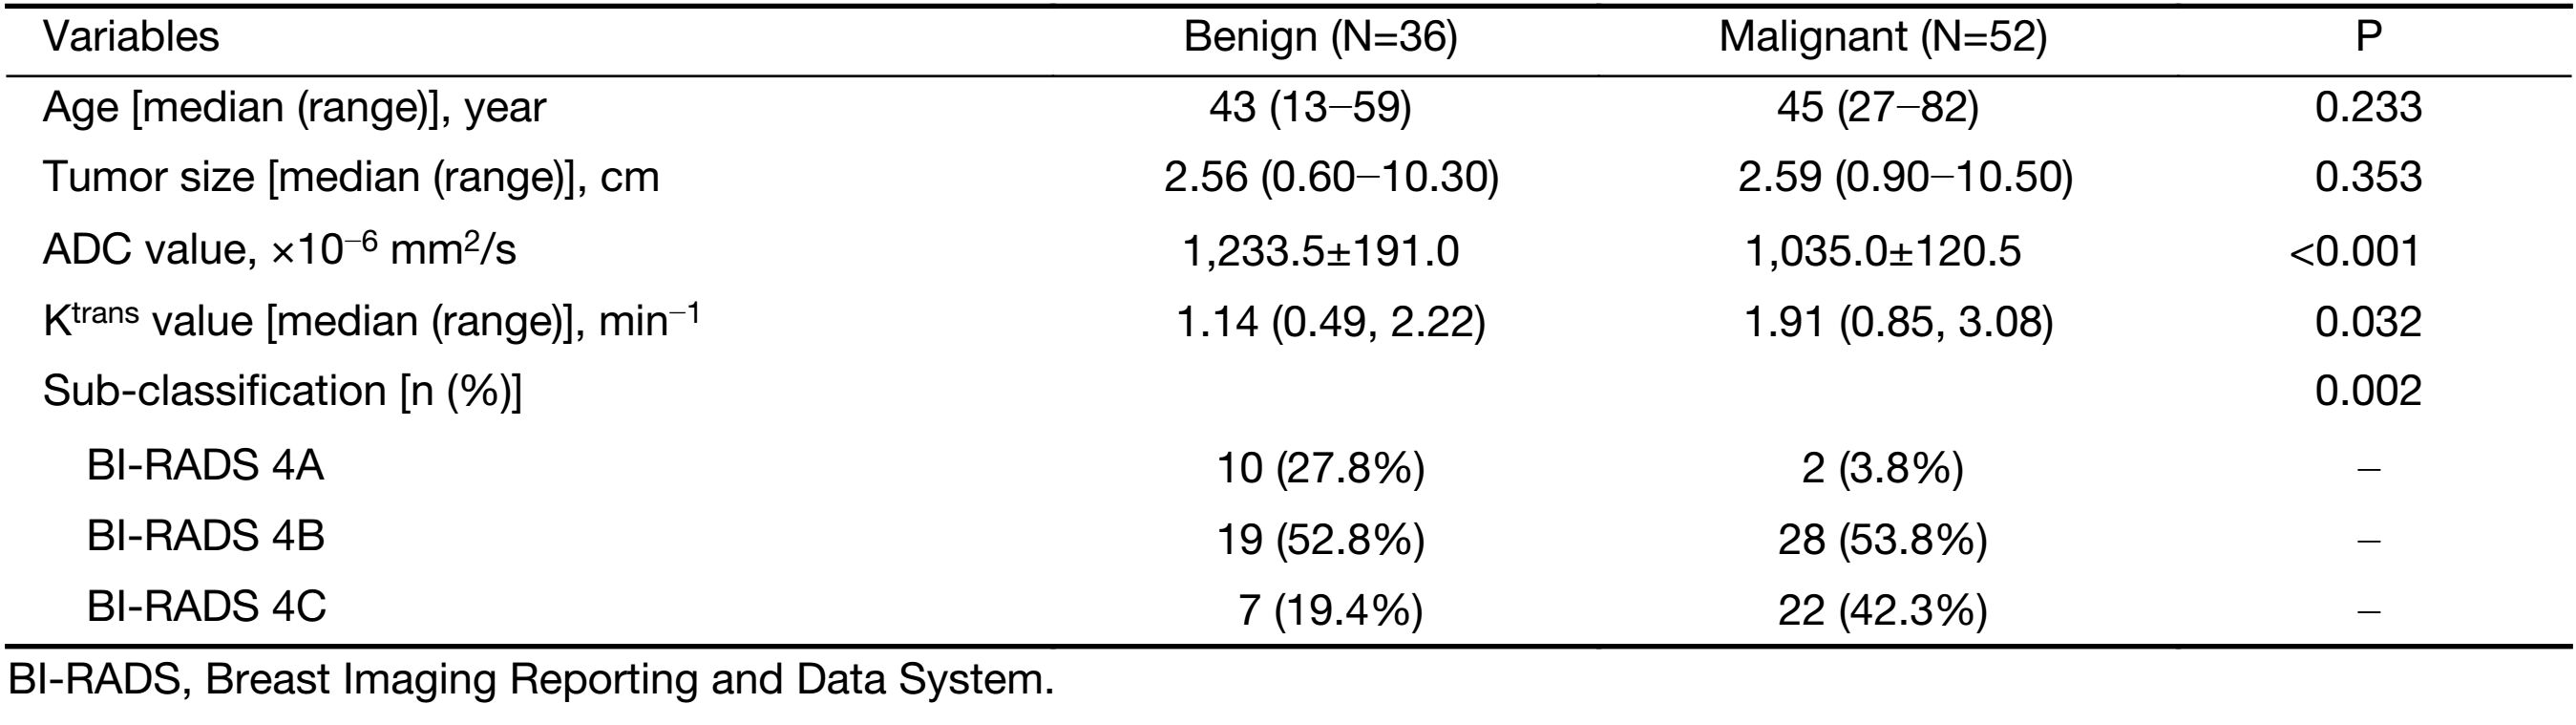
A total of 88 patients with biopsy-proven breast disease were enrolled in this retrospective study. Of the 88 tumors, 36 were benign and 52 were malignant. Information for the malignant and benign cohorts is included in Table 1. The age and tumor size were not significantly different between the groups.The positive predictive values (PPVs) of the sub-classification of tumors as BI-RADS 4A, BI-RADS 4B and BI-RADS 4C were 16.7%, 59.6% and 75.9%, respectively. The sub-classifications were significantly different (P=0.002, Table 1) between the benign and malignant lesions. The AUC was 0.68, and the sensitivity and specificity for diagnosis were 76.7% and 43.1%, respectively (Figure 2).
Full table
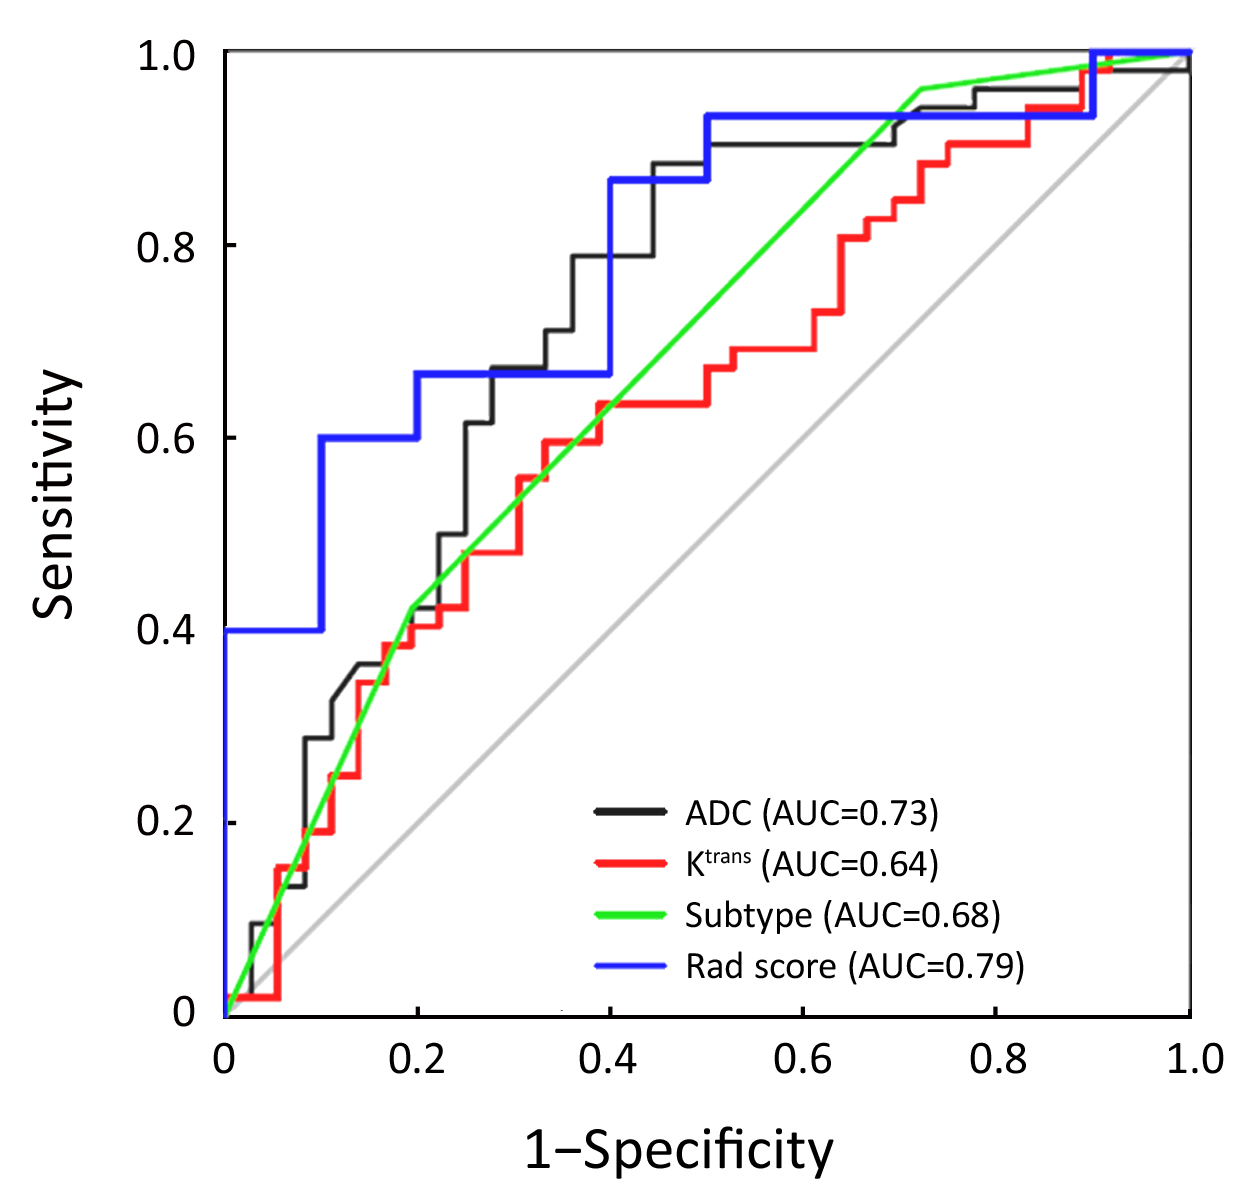
ADC value was significantly different (P<0.001,Table 1) between the benign [(1,233.5±191.0)×10–6 mm2/s] and malignant lesions [(1,035.0±120.5)×10–6 mm2/s]. The AUC was 0.73, and the sensitivity and specificity for diagnosis were 88.5% and 55.6%, respectively (Figure 2).
The Ktrans value was significantly different (P=0.032, Table 1) between the benign group [1.14 (0.49, 2.22) min–1] and malignant group [1.91 (0.85, 3.08) min–1]. The AUC was 0.64, and the sensitivity and specificity for diagnosis were 59.6% and 66.7%, respectively (Figure 2).
Radiomic score
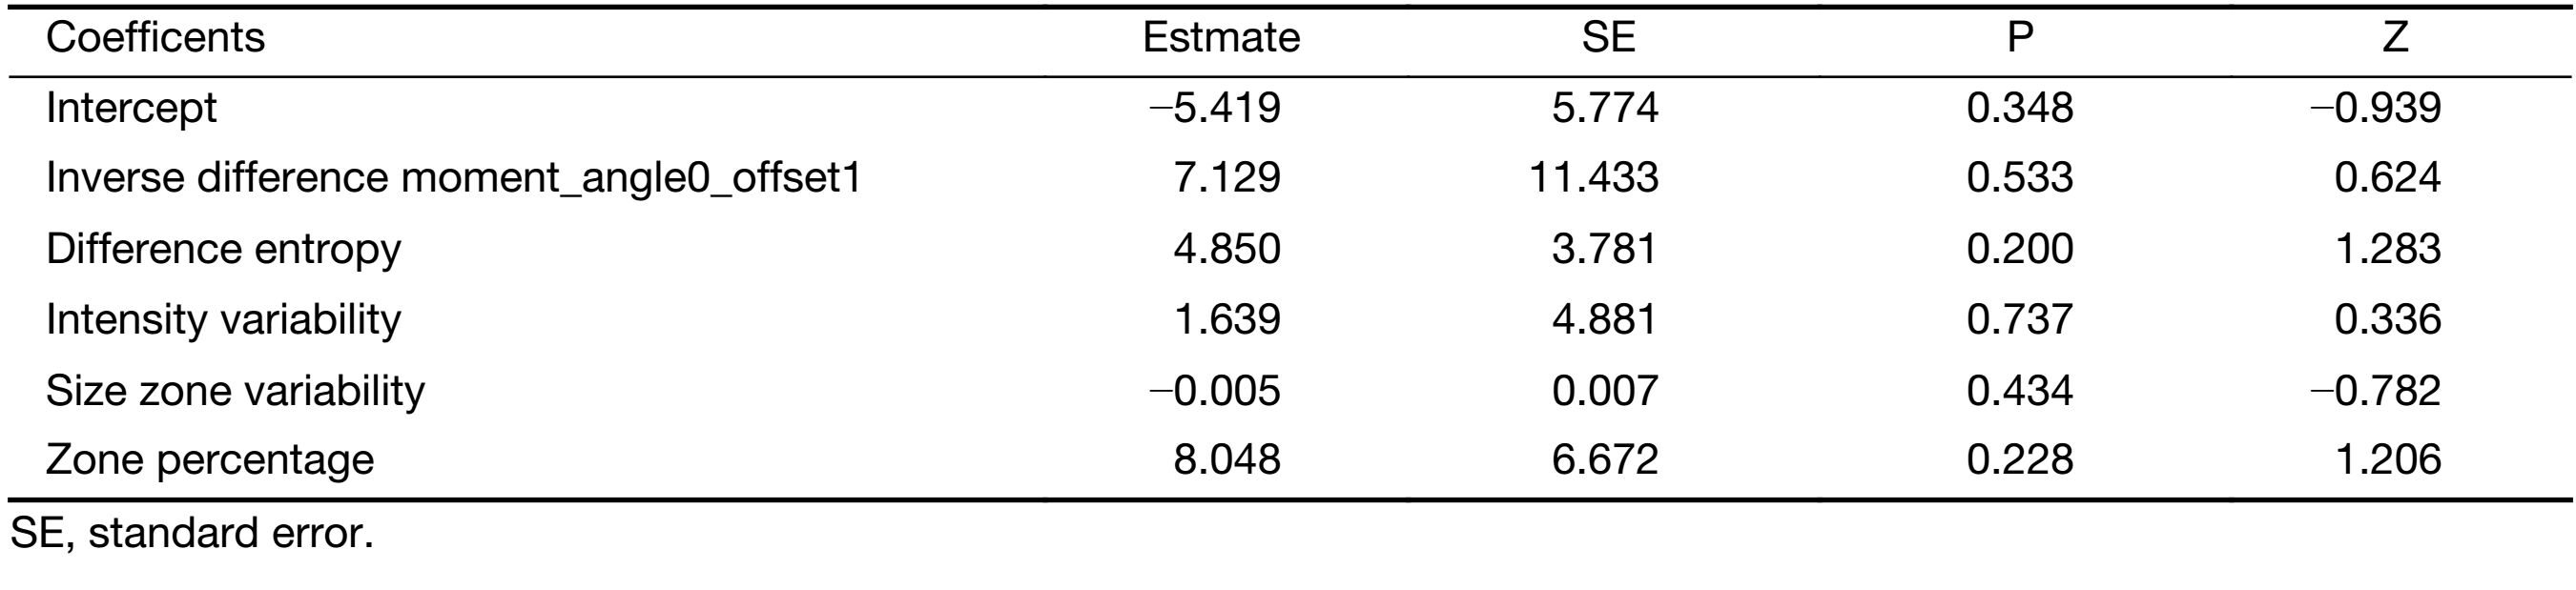
A total of 396 radiomic features were extracted by the A.K. software. In total, 252 features were significantly different between the two groups according to the Mann-Whitney test. After spearman analysis using |r|=0.9, five features were retained for development of the logistic regression model (Table 2). The logistic regression model was trained with 10-fold cross-validation repeated 10 times, resulting in 80.0% (95% confidence interval, 59.3% to 93.2%) accuracy. When the cut-off value was 0.45, the AUC was 0.79, the sensitivity was 81.3%, and the specificity was 77.8% (Figure 2).
Full table
Nomogram
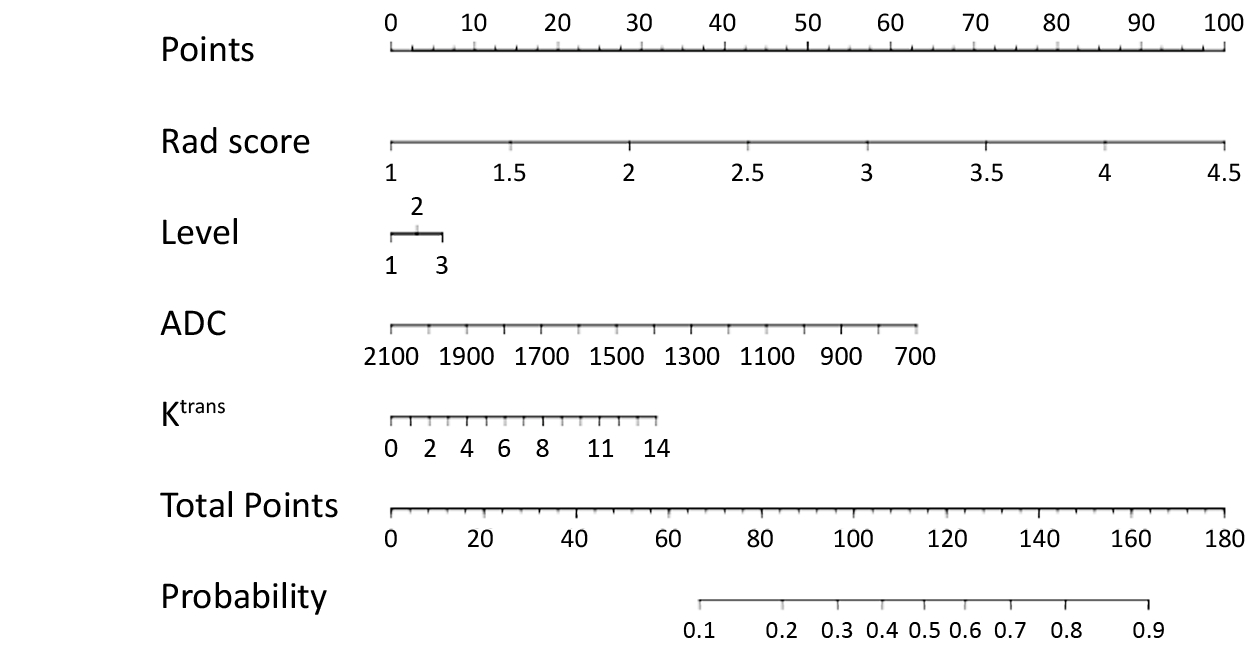
Multivariable logistic regression analysis was conducted with the Rad score, sub-classification, ADC value and Ktrans value, which were represented as a nomogram to provide a quantitative and predictive tool (Figure 3).
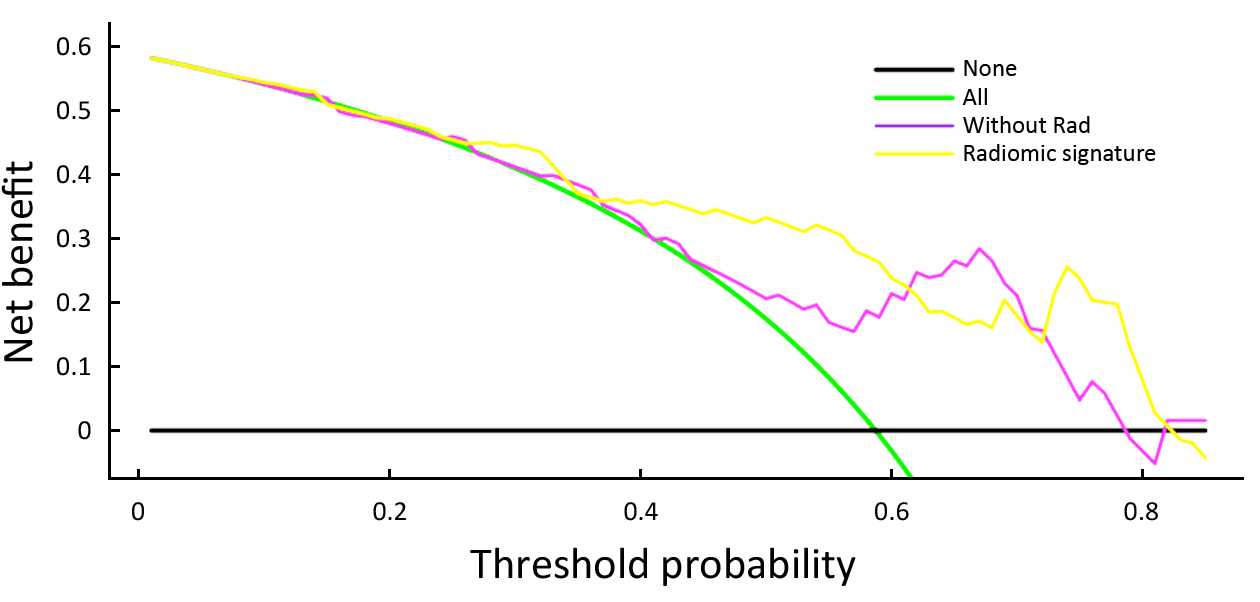
The decision curve analysis for the nomogram and that for the model without Rad score is presented in Figure 4. The decision curve showed that if the threshold probability of a patient or doctor is approximately 30%, using the radiomic nomogram in the current study to predict breast cancer adds more benefit than the treat-all-patients scheme or the treat-none scheme. For example, if the personal threshold probability of a patient is 60% (i.e., the patient will opt for treatment if their probability of cancer is 60%), then the net benefit is approximately 0.265 when using the radiomic nomogram to determine whether to undergo treatment, resulting in an added benefit over the treat-all scheme or the treat-none scheme. The net benefit was comparable, with several overlaps, for the radiomic nomogram (yellow model) and the model that integrated the ADC, Ktrans and sub-classification (purple model).
Discussion
We developed a quantitative nomogram prediction model based on the radiomic features of an ADC map, lesion morphology (clinical sub-classification), hemodynamic index (Ktrans) and ADC value for the differential diagnosis of benign and malignant BI-RADS 4 lesions. We obtained a satisfactory result when the nomogram was applied to the test group.
ADC radiomic features show the heterogeneity of diffusion in tumors, which is the external manifestation of the cell density and microenvironment distribution inside the tumor. ADC radiomic features sensitively and comprehensively reflect the internal characteristics of tumors (15). We used the 5 extracted feature parameters of ADC radiomic features to establish the prediction model and assigned variable coefficients to these parameters. The accuracy of the prediction model was 80% using 10-fold cross-validation. Although the ADC is considered an important parameter in breast disease diagnosis (16,17), current radiomic research on breast MRI has focused mainly on DCE-MRI instead of DWI or ADC images. In this study, we developed a prediction model based on ADC radiomics, which showed good diagnostic efficiency. To fully reflect the tumor characteristics, we incorporated relevant features of the tumor into a quantitative nomogram prediction model. The relevant features included the morphology (clinical classification), hemodynamic index (Ktrans), ADC value and ADC radiomic prediction model.
The clinical sub-classification was included in the nomogram as the clinical evaluation of lesion morphology. There are more than 20 morphological features of breast MRI based on lesions of mass or non-mass enhancement, which increases the difficulty of evaluating the imaging characteristics. The clinical sub-classification is based on the evaluation of all morphological features (6) and has had shown good diagnostic efficiency in previous studies. In this study, the PPVs of BI-RADS 4A, 4B and 4C classifications were 16.7%, 59.6% and 75.9%, respectively, similar to previous research (6). The diagnostic efficiency of this study was slightly lower than those in previous studies. The sample size and the bias of subjective interpretation might be the reason for this finding.
Ktrans was included in the nomogram to represent the hemodynamic characteristics of lesions. Ktrans is the capacity transfer constant. It is a permeability parameter reflecting the velocity at which the contrast agent diffuses from the blood vessel (18-20). Ktrans increases in malignant lesions because of the greater cell density, tumor angiogenesis accompanied by structural disorder and increased vascular permeability. In this study, a statistically significant difference was observed in Ktrans between the benign and malignant groups (P=0.032, 1.14 min–1 vs. 1.91 min–1), which was consistent with previous reports (21,22). However, the sensitivity and specificity were 59.6% and 66.7%, respectively, which were lower than those of previous studies. The lower diagnostic efficiency might be related to our focus on BI-RADS 4 lesions.
The ADC value, measured manually, was included in the nomogram. The ADC value is helpful for differentiating benign and malignant lesions in breast MRI results (17). However, in the process of parameter selection and extraction, the whole ADC value generated automatically by texture analysis was eliminated due to a lack of significant influence. The ADC value measured manually (manual selection of an ROI on the most obvious diffusion-restricted region, avoiding visible necrosis, cystic degeneration, hemorrhage or fat) was significantly different between the benign and malignant groups in this study (P<0.001). Arponen found that, compared to the whole ADC value of a lesion, a manually measured ADC (on the most obvious diffusion-restricted region, avoiding visible necrosis, cystic degeneration, hemorrhage or fat in the lesions) was more specific for differentiating benign and malignant breast tumors (23). Therefore, we included the ADC value measured manually in this study as one of the influencing factors in the model.
The main limitations of this study include: 1) the small sample, which may have led to instability of the results; and 2) a two-dimensional ROI and manual delineation of the ROI, which may have led to high variability. We are working to improve these factors in an upcoming study.
Conclusions
Radiomic features of an ADC map can provide an important reference for the differential diagnosis of benign and malignant BI-RADS category 4 breast lesions. The quantitative nomogram prediction model based on the radiomic features of the ADC map, lesion morphology (clinical sub-classification), hemodynamic index (Ktrans) and ADC value used for the differential diagnosis of benign and malignant BI-RADS 4 lesions may have broad clinical applications.
Acknowledgements
This study was supported by Liaoning Science and Technology Office Project (No. 2012225013), Youth Foundation of Natural Science Project (No. 81301222), and Special Project of Public Health Research (No. 201402013). We sincerely appreciate Yan Guo and Xin Li from the Department of Core Imaging, Life Science, GE healthcare, Shanghai, China for their assistance in data processing and statistical analysis.
Footnote
Conflicts of Interest: The authors have no conflicts of interest to declare.
References
- Torre LA, Bray F, Siegel RL, et al. Global cancer statistics, 2012. CA Cancer J Clin 2015;65:87–108. [PubMed] DOI:10.3322/caac.21262
- Chen W, Zheng R, Zhang S, et al. Cancer incidence and mortality in China in 2013: an analysis based on urbanization level. Chin J Cancer Res 2017;29:1–10. [PubMed] DOI:10.21147/j.issn.1000-9604.2017.01.01
- Lu H, Xu YL, Zhang SP, et al. Breast magnetic resonance imaging in patients with occult breast carcinoma: evaluation on feasibility and correlation with histopathological findings. Chin Med J (Engl) 2011;124:1790–5. [PubMed] DOI:10.3760/cma.j.issn.0366-6999.2011.12.006
- Agrawal G, Su MY, Nalcioglu O, et al. Significance of breast lesion descriptors in the ACR BI‐RADS MRI lexicon. Cancer 2009;115:1363–80. [PubMed] DOI:10.1002/cncr.24156
- Sedgwick EL, Ebuoma L, Hamame A, et al. BI-RADS update for breast cancer caregivers. Breast Cancer Res Treat 2015;150:243–54. [PubMed] DOI:10.1007/s10549-015-3332-4
- Maltez de Almeida JR, Gomes AB, Barros TP, et al. Subcategorization of suspicious breast lesions (BI-RADS category 4) according to MRI criteria: role of dynamic contrast-enhanced and diffusion-weighted imaging. AJR Am J Roentgenol 2015;205:222–31. [PubMed] DOI:10.2214/AJR.14.13834
- Song SE, Park EK, Cho KR, et al. Additional value of diffusion-weighted imaging to evaluate multifocal and multicentric breast cancer detected using pre-operative breast MRI. Eur Radiol 2017;27:4819–27. [PubMed] DOI:10.1007/s00330-017-4898-5
- Shao G, Fan L, Zhang J, et al. Association of DW/DCE-MRI features with prognostic factors in breast cancer. Int J Biol Markers 2017;32:e118–e125. [PubMed] DOI:10.5301/jbm.5000230
- Jansen JF, Lu Y, Gupta G, et al. Texture analysis on parametric maps derived from dynamic contrast-enhanced magnetic resonance imaging in head and neck cancer. World J Radiol 2016;8:90–7. [PubMed] DOI:10.4329/wjr.v8.i1.90
- Chen X, Wei X, Yang R, et al. Differentiation of glioblastomas and solitary metastatic brain tumors using texture analysis of conventional MRI. Zhonghua Fang She Xue Za Zhi (in Chinese) 2016;50:186–90. DOI:10.3760/cma.j.issn.1005-1201.2016.03.006
- De Cecco CN, Ganeshan B, Ciolina M, et al. Texture analysis as imaging biomarker of tumoral response to neoadjuvant chemoradiotherapy in rectal cancer patients studied with 3-T magnetic resonance. Invest Radiol 2015;50:239–45. [PubMed] DOI:10.1097/RLI.0000000000000116
- Nie K, Chen JH, Yu HJ, et al. Quantitative analysis of lesion morphology and texture features for diagnostic prediction in breast MRI. Acad Radiol 2008;15:1513–25. [PubMed] DOI:10.1016/j.acra.2008.06.005
- Holli-Helenius K, Salminen A, Rinta-Kiikka I, et al. MRI texture analysis in differentiating luminal A and luminal B breast cancer molecular subtypes - a feasibility study. BMC Med Imaging 2017;17:69. [PubMed] DOI:10.1186/s12880-017-0239-z
- Thibault G, Tudorica A, Afzal A, et al. DCE-MRI texture features for early prediction of breast cancer therapy response. Tomography 2017;3:23–32. [PubMed] DOI:10.18383/j.tom.2016.00241
- Cai H, Peng Y, Ou C, et al. Diagnosis of breast masses from dynamic contrast-enhanced and diffusion-weighted MR: a machine learning approach. PLoS One 2014;9:e87387. [PubMed] DOI:10.1371/journal.pone.0087387
- Dijkstra H, Dorrius MD, Wielema M, et al. Quantitative DWI implemented after DCE-MRI yields increased specificity for BI-RADS 3 and 4 breast lesions. J Magn Reson Imaging 2016;44:1642–9. [PubMed] DOI:10.1002/jmri.25331
- Ramírez-Galván YA, Cardona-Huerta S, Ibarra-Fombona E, et al. Apparent diffusion coefficient (ADC) value to evaluate BI-RADS 4 breast lesions: correlation with pathological findings. Clin Imaging 2015;39:51–5. [PubMed] DOI:10.1016/j.clinimag.2014.09.015
- Jia Z, Geng D, Xie T, et al. Quantitative analysis of neovascular permeability in glioma by dynamic contrast-enhanced MR imaging. J Clin Neurosci 2012;19:820–3. [PubMed] DOI:10.1016/j.jocn.2011.08.030
- Shi X, Shi G, Wang X, et al. Ktrans of dynamic contrast enhanced MRI in evaluation of anti-angiogenic effects on nude mice with orthotopic transplantation tumor model of gastric cancer . Zhongguo Yi Xue Ying Xiang Ji Shu (in Chinese) 2017;33:843–7. DOI:10.13929/j.1003-3289.201610144
- Koo HR, Cho N, Song IC, et al. Correlation of perfusion parameters on dynamic contrast-enhanced MRI with prognostic factors and subtypes of breast cancers. J Magn Reson Imaging 2012;36:145–51. [PubMed] DOI:10.1002/jmri.23635
- Amarnath J, Sangeeta T, Mehta SB. Role of quantitative pharmacokinetic parameter (transfer constant: Ktrans) in the characterization of breast lesions on MRI . Indian J Radiol Imaging 2013;23:19–25. [PubMed] DOI:10.4103/0971-3026.113614
- Etxano J, García-Lallana Valbuena A, Antón Ibáñez I, et al. Evaluation of the reproducibility of a protocol for the pharmacokinetic study of breast tumors by dynamic magnetic resonance imaging. Radiologia (in English, Spanish) 2015;57:44–9. DOI:10.1016/j.rx.2013.01.006
- Arponen O, Sudah M, Masarwah A, et al. Diffusion-weighted imaging in 3.0 Tesla Breast MRI: diagnostic performance and tumor characterization using small subregions vs. whole tumor regions of interest . PLoS One 2015;10:e0138702. [PubMed] DOI:10.1371/journal.pone.0138702