
Imaging evaluation of sorafenib for treatment of advanced hepatocellular carcinoma
Introduction
Hepatocellular carcinoma (HCC) is the fifth most common cancer and the third leading cause of cancer-related mortality worldwide, accounting for approximately 745,500 deaths each year (1). Cirrhosis is the most important risk factor for HCC, with approximately 80% of HCC cases developing in patients with liver cirrhosis (2). According to international guidelines, the diagnosis of HCC is predominantly based on typical vascular patterns on multiphasic computed tomography (CT) or contrast-enhanced magnetic resonance imaging (CE-MRI) and, in some cases, on pathologic findings (3,4). However, most patients with HCC are diagnosed at an advanced stage, and in these patients the benefits of potentially curative treatments, including surgical resection, liver transplantation and locoregional therapy, are limited (5).
Fortunately, recent advances in the understanding of molecular events during hepatocarcinogenesis and tumor metastasis have led to the development of targeting drugs, particularly sorafenib, as promising treatment options for advanced HCC. Sorafenib, which is a small molecule with antiangiogenic and antiproliferative effects, is currently the only approved systemic drug for the treatment of advanced HCC. The efficacy of sorafenib has been shown to prolong the median overall survival (OS) in two multicenter, phase 3, double-blind, placebo-controlled trials (6,7). According to the Barcelona Clinic Liver Cancer (BCLC) algorithm, patients with advanced stage HCC (stage C) with portal invasion, extrahepatic spread and preserved liver function should receive sorafenib as the first-line treatment (5).
Currently, the efficacy of sorafenib treatment is assessed largely according to the radiographic tumor morphology. However, sorafenib can interfere with tumor angiogenesis and growth, which usually does not lead to apparent tumor shrinkage and may alter tumor morphology (8). Therefore, conventional morphology-based radiographic evaluation systems may not be accurate for assessing the efficacy of sorafenib treatment. Thus, the development of novel imaging methods for evaluating sorafenib treatment for HCC is important because these methods allow a more accurate assessment of treatment response and improved patient management.
In this review, we summarize the various radiographic methods for evaluating the treatment response of advanced HCC to sorafenib.
Sorafenib in HCC
Angiogenesis, which is the growth of new blood vessels from established vessels, is a key aspect of tumor growth and progression; and thus, it is a promising target for cancer treatment (9). The diffusion distance of oxygen is limited to approximately 100 μm (10). Therefore, large-scale tumor growth requires that a tumor have its own vascular supply for oxygen and nutrients; otherwise, it will stay in a dormant state and remain microscopic (11). Unlike physical angiogenesis, which is a series of controlled events determined by the sum of several regulators in tissue development and repair, tumor cells experience an “angiogenic switch” and undergo angiogenesis based on a shift towards the production of proangiogenic factors (12,13). The newly formed blood vessels in tumors are functionally and structurally abnormal and are characterized by increased permeability, tortuosity, dilation and heterogeneity in blood flow (14). These abnormalities further modify the tumor microenvironment and contribute to hypoxia, low pH and high interstitial fluid pressure, leading to impaired delivery of therapeutic drugs and progression in malignancy (15,16).
Most HCC lesions are hypervascular; therefore, these tumors are sensitive to antiangiogenic therapies. Currently, two approaches employed in the development of antiangiogenic therapy are the inhibition of stimulatory angiogenic factors and supplementation of endogenous antiangiogenic factors (17). Sorafenib is an oral multikinase inhibitor that blocks several molecular pathways that are important in tumor angiogenesis and progression, including serine/threonine kinases (c-RAF and BRAF), receptor tyrosine kinases vascular endothelial growth factor receptor (VEGFR)-2 and VEGFR-3, and platelet-derived growth factor receptor (PDGFR) (18). Among these pathways, VEGF is the main molecule that drives tumor angiogenesis, which not only stimulates endothelial cell division and migration but also increases vascular permeability (19,20).
Sorafenib destroys tumor blood vessels and facilitates vascular normalization (21). Vascular normalization is a process induced by VEGF blockage, by which abnormal tumor blood vessels are transformed to less leaky, tortuous and dilated vessels with basement membranes that are covered by an increased number of pericytes (22). These structural changes generally lead to reduced interstitial fluid pressure and improved tumor oxygenation, consequently facilitating drug delivery and augmenting the effects of chemotherapy and radiotherapy (17,23). However, vascular normalization caused by sorafenib occurs during a limited period. Thus, in order to maximize the possible therapeutic benefit, it is important to schedule additional medical treatment precisely within the time window of vascular normalization with the use of imaging approaches.
Systems evaluating therapeutic effects of sorafenib for HCC
Tumor burden measurements based on morphology
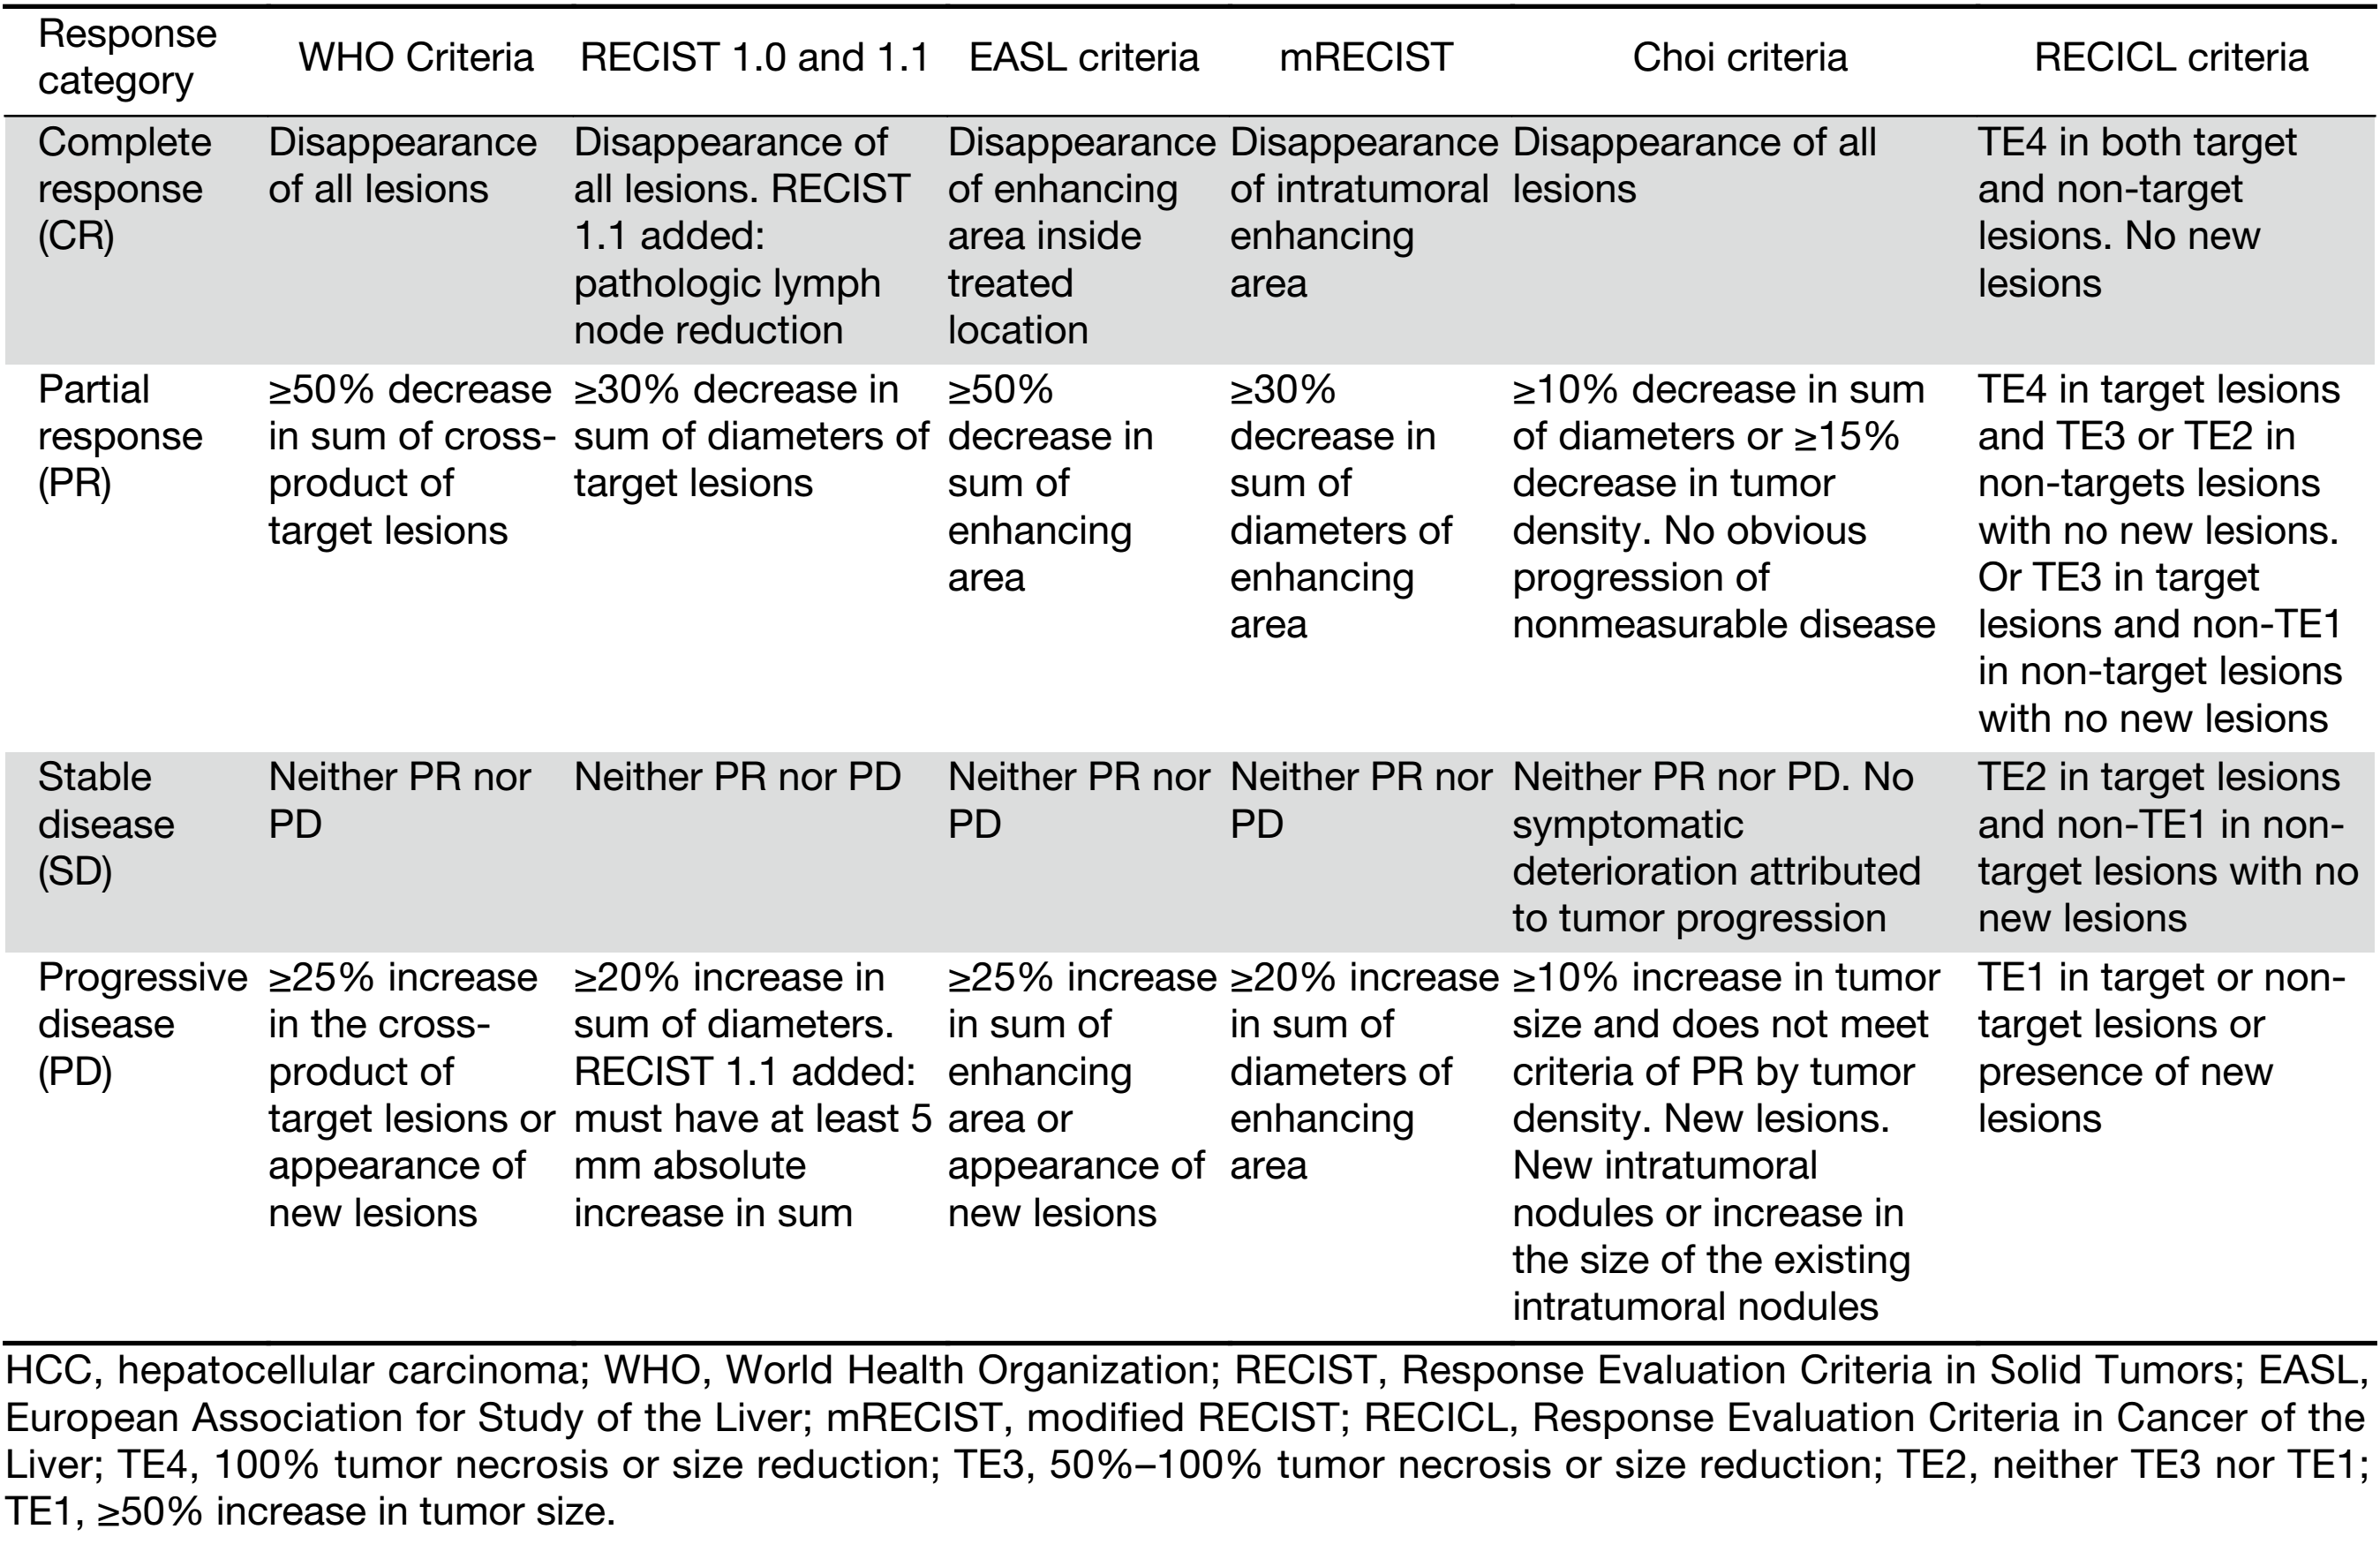
Although prolonged OS is the ultimate proof of effectiveness, tumor morphological changes based on contrast-enhanced CT and MRI are commonly incorporated into clinical practice as surrogate markers for evaluating the therapeutic response of HCC to sorafenib treatment (6,7,24). These imaging techniques are widely available and have been well validated in different medical centers with reproducible and quantitative data. Currently, measurement of tumor burden based on size is the most widely used method to assess treatment response in HCC patients. This evaluation system has been applied in clinical practice on a wider scale since the introduction of the first imaging criteria, the World Health Organization (WHO) criteria (25) (Table 1). Other criteria for anatomic imaging markers include the Response Evaluation Criteria in Solid Tumors (version 1.0) (RECIST 1.0) and RECIST 1.1 (26,27) (Table 1).
Full table
WHO criteria
Introduced in the late 1970s, the WHO criteria determined treatment response on the basis of clinical, radiographic or biochemical data or surgico-pathological restaging (25). The radiographic criteria measure tumor burden by adding the products of bidimensional measurements of each lesion and define four categories of objective treatment response [complete response (CR), partial response (PR), stable disease (SD) and progressive disease (PD)] based on evaluations at baseline and after treatment.
The WHO criteria were the first set of evaluation criteria that aimed to improve the standardization of cancer treatment response and develop a “common language” in this field. However, the criteria did not provide an exact definition of a “measurable HCC lesion” or state the number of lesions that should be measured, which could cause inaccuracy in cases with small or multiple HCC lesions and add additional radiographic workload (28). In addition, the criteria did not specify the imaging modality or the methodology that should be used for calculation, which might lead to discrepancies in clinical practice. For example, PD, which is defined as 25% increase in the size of one or more lesions, is described by some radiologists as an increase in the size of any one lesion and as an increase in the sum of the sizes of all lesions by others (29).
RECIST version 1.0 and 1.1 criteria
RECIST 1.0 was published in 2000 by the European Organization for Research and Treatment of Cancer (EORTC), the US National Cancer Institute and the National Cancer Institute of Canada with the goal of overcoming the previously mentioned limitations of the WHO criteria (26). Compared with the WHO criteria, the major revisions of RECIST 1.0 were the following: 1) RECIST 1.0 used one-dimensional measurements; 2) specified the criteria of a target lesion to be measured; and 3) specified the number of lesions to be assessed. These changes made tumor measurement more reproducible and quantitative and saved considerable labor. Nevertheless, the maximum number of five target lesions per organ and 10 target lesions per patient lacked a theoretical basis, and no functional or molecular parameters were incorporated in these criteria (30). There were no clear guidelines for the measurement of lymph nodes either.
To address the abovementioned shortcomings, RECIST was revised to version 1.1 in 2009. The major differences between RECIST version 1.0 and 1.1 are as follows: 1) RECIST 1.1 reduced the maximum number of lesions to be measured from 10 to 5 overall and from 5 to 2 per organ; 2) incorporated pathological lymph nodes as target lesions; 3) added a 5 mm absolute increase in tumor size to the definition of PD; and 4) used 18F-fluorodeoxyglucose positron emission tomographic (FDG-PET) scans to identify new tumor lesions and determine disease progression according to the criteria (27). The assessment of lymph nodes is meaningful in patients with HCC with lymph node metastasis (31). In addition, these modifications may reduce the impact of potential errors when measuring small lesions and increase the sensitivity for detecting disease progression. However, as with its predecessor, RECIST 1.1 considers necrotic lesions unmeasurable, which limits its use in assessing therapeutic responses to antiangiogenic drugs (28). To date, the RECIST criteria are still adopted by regulatory agencies, such as the Food and Drug Administration (FDA), and are widely used in clinical trials testing novel drugs (32).
Volumetric Assessment
Several studies have suggested that either uni- or bidimensional measurement of tumor burden be based on the assumption that the tumor lesion is spherical, which is not always the case and may result in inaccuracy when calculating the actual tumor size with these measurements (33,34). Three-dimensional methods for tumor volume quantification are well correlated with the gross pathologic volume of HCC and can better reflect the actual tumor size (34). In patients who underwent transcatheter arterial chemoembolization (TACE) for HCC, two retrospective studies established comparisons between tumor volume and lesion diameter as early predictors of treatment response and have shown a stronger association between tumor volume and patient survival (35,36). In a retrospective cohort of 22 patients with HCC who were treated with sorafenib, Bargellini et al. (37) found that the volume ratio (post-treatment volume/baseline volume) was significantly correlated with survival, while the radiographic tumor response according to RECIST was not. Nevertheless, volumetric assessment is time consuming and lacks widely accepted criteria for measuring treatment response, which may limit its clinical applications (28).
Due to the lack of wide availability and proper standardization of the required imaging modalities and corresponding data processing software, the RECIST criteria did not support moving the focus of HCC measurement from anatomical assessment to volumetric assessment (27). However, volumetric assessment may be a promising method of accurately assessing treatment response in the future.
Tumor burden measurement based on viability
Morphologic tumor burden measurement is a direct way to quantitatively characterize lesion size and monitor morphological changes in HCC lesions treated with cytotoxic agents. This measurement is based on the fact that tumor size can be a surrogate marker for the number of tumor cells and thus is well correlated with tumor burden.
However, in the case of targeted antiangiogenic treatment in HCC patients, size-based measurement can be misleading for gauging the treatment response. One study found that although sorafenib significantly prolonged the median OS in advanced HCC patients for approximately 3 months, no apparent tumor shrinkage was observed in most patients (6). A possible explanation for this is that sorafenib can result in necrosis and hemorrhage inside the tumor, and this may stabilize or even temporarily increase the tumor size (8,18). Thus, the introduction of tumor burden measurements based on viability is of great significance. Criteria developed for this purpose include the European Association for Study of the Liver (EASL) guidelines, the modified RECIST (mRECIST) criteria, the Choi Criteria, and the Response Evaluation Criteria in Cancer of the Liver (RECICL) (Table 1).
EASL criteria and mRECIST
Image-guided tumor ablation can achieve nearly 100% effectiveness in very early stage HCC, which is comparable with outcomes after surgery (38). TACE with cisplatin or doxorubicin has shown a more than 50% objective response and improved 2-year survival in patients with large or multifocal HCC lesions (5,39). Effective as the abovementioned locoregional therapies are, HCC lesion dimensions may have stabilized or even increased due to tumor necrosis or hemorrhage in the abovementioned cases, making treatment monitoring challenging (40). To address this problem, the EASL criteria were proposed in 2000 (41). The major differences from the WHO criteria were that the EASL criteria used changes in enhancing areas inside the treated location during the arterial phase, representing viable tumor tissue, instead of the lesion size to stratify the response categories. Likewise, the RECIST criteria were amended to mRECIST by incorporating the concept of viable tumor tissue into the criteria in 2010, in which PR was defined as a decrease of at least 30% in the sum of the longest diameters of the enhancing tissue (32).
The EASL criteria and the mRECIST criteria both demonstrated superiority over the WHO criteria for measuring tumor treatment response after locoregional therapy in HCC patients by exhibiting a stronger correlation with survival (42,43). In HCC patients treated with sorafenib, both the EASL criteria and the mRECIST criteria showed high inter- and intra-observer reproducibility for assessing treatment response (44). Two retrospective studies reported the superiority of mRECIST over RECIST for evaluating treatment responses in HCC patients treated with sorafenib (45,46). Takada et al. (46) demonstrated that responders (patients achieving CR or PR) had significantly better OS than nonresponders (patients achieving SD or PD) based on mRECIST (P=0.0117), while there was no significant difference in OS based on RECIST 1.1 (P=0.0722). Recently, Lencioni et al. (47) studied patients in a phase III BRISK-PS trial who received brivanib, which is an inhibitor of VEGFR and the fibroblast growth factor receptor pathway, after sorafenib progression and found that the objective response (CR or PR) as assessed by mRECIST was correlated with longer OS in patients with advanced HCC (P<0.001) and could be considered a potential surrogate of OS (R=–0.9, 95% confidence interval: –1 to –0.73, P<0.001). However, further studies in other populations are needed to validate the value of the objective response as assessed by mRECIST as a surrogate endpoint.
However, there are several limitations of the two abovementioned criteria. First, HCC lesions with atypical enhancement patterns due to previous treatments are considered nontarget lesions. In addition, measuring the longest diameter of lesions with partial necrosis can be challenging and subjective (32).
Choi Criteria
Imatinib, which is a tyrosine kinase inhibitor that affects the enzymatic activity of c-kit and PDGFR, remarkably improved therapeutic outcomes of advanced gastrointestinal stromal tumors (GISTs) (48). However, the RECIST criteria significantly underestimated the effect of imatinib during the early phase of treatment as assessed by FDG-PET, while tumor density measurements determined by drawing a region of interest (ROI) around the boundaries of the tumor during the portal venous phase on CT images showed potential for monitoring tumor response to treatment (49). In 2007, new GIST-specific criteria for measurement of tumor response after imatinib treatment were proposed by Choi et al. (50), in which PR was defined as a decrease in tumor size greater than or equal to 10% or a decrease in tumor density greater than or equal to 15% on CT.
The Choi criteria have recently been introduced in patients treated with sorafenib for advanced HCC. Two recent retrospective studies have established head-to-head comparisons among the RECIST 1.1, EASL, mRECIST and Choi criteria for advanced HCC patients treated with sorafenib (51,52). Ronot et al. (51) included 64 patients in a single center study and reported that the interobserver agreement was moderate according to the Choi criteria (κ=0.58) and substantial for the RECIST 1.1 (0.65), EASL (0.77) and mRECIST criteria (0.67). Their study indicated difficulty in achieving a reliable treatment assessment of sorafenib in advanced HCC patients according to these imaging evaluation criteria, possibly due to the infiltrative growth pattern and marked tumor heterogeneity of advanced HCC. They also found that a significantly higher response rate was observed with the Choi criteria (51%) than with the EASL (28%), mRECIST (28%) or RECIST 1.1 criteria (3%), and only patients with objective response based on the Choi criteria exhibited longer OS than patients with SD [22.4 months vs. 11.5 months, hazard ratio (HR)=0.46, P=0.04]. Gavanier et al. (52) reported similar results and found that 20%, 5%, 6.7% and 3.3% of patients were identified as responders according to the Choi, EASL, mRECIST and RECIST 1.1 criteria, respectively, and that responders as determined by the Choi criteria showed significantly longer survival than progressors (20.4 months vs. 9 months, HR=0.42, P=0.035).
Advantages of the Choi criteria include the following: 1) better sensitivity for identifying responders with FDG-PET than the RECIST criteria; 2) good correlation with OS; and 3) avoiding the restrictions of FDG-PET in tumor response monitoring, such as limited availability and inaccuracy in small tumor lesions (50,52,53). Nevertheless, ROI determination is subjective and may cause selection bias (28).
RECICL criteria
The Liver Cancer Study Group of Japan developed the Criteria for the Evaluation of Direct Treatment Effects in HCC in 1994 (54). Then, these criteria were amended with the latest version of RECICL (2015 revised version) (55). Primarily developed for locoregional therapies, the RECICL criteria included tumor necrosis as part of the scope of evaluation for HCC and addressed several limitations of the WHO and RECIST criteria in measuring therapeutic responses after locoregional therapies. Arizumi et al. (56) investigated the performance of the RECICL, RECIST 1.1 and mRECIST criteria for evaluating responses to sorafenib treatment in 156 patients with HCC. They reported that only classification of treatment response by the RECICL criteria (objective response, SD and PD) was significantly associated OS.
Based on viability, the RECICL criteria: 1) were based on bi-dimensional measurement; 2) separated the evaluation of the direct treatment response after locoregional therapy or radiotherapy of intrahepatic target lesions and the overall response of the entire liver and extrahepatic lesions; 3) determined the overall response on the basis of the direct response of both target and nontarget lesions as well as the appearance of new lesions; 4) considered lipiodol accumulation regions and nonenhancing regions as necrotic areas; 5) incorporated several tumor serology markers, including alpha-fetoprotein (AFP), AFP-L3 and protein induced by vitamin K absence or antagonist II (PIVKA-II) or des-gamma-carboxy protein (DCP) to predict the prognosis; and 6) recommended timing for evaluating responses to different types of treatments. However, large-scale prospective studies are needed to further validate the associations between the overall response evaluation as assessed by the RECICL criteria and HCC prognosis.
Other imaging approaches for characterizing therapeutic effects
FDG-PET
Through the detection of radiopharmaceutical tracer accumulation, PET characterizes various tissue properties. Typically, malignant tumors show enhanced uptake of 18F-FDG, which is a glucose analog, owing to elevated transport and fixation inside tumor cells (57). The standardized uptake value (SUV) is a semiquantitative parameter that objectively measures tracer uptake. Evidence has shown that the ratio of tumor maximal SUV to liver mean SUV is associated with HCC tumor burden (58). Lee et al. (59) enrolled 29 patients undergoing sorafenib treatment for HCC to investigate the prognostic value of FDG-PET in this cohort. They reported that a low pretreatment SUVmax (<5.00), which was defined as the maximal SUV of the most hypermetabolic lesion site, was a predictor of favorable outcomes in terms of both OS and progression-free survival (PFS) (P=0.023 and P=0.042, respectively). However, SUVmax was not significantly correlated with tumor responses according to the RECIST criteria, which might be explained by the small sample size and limitations of the RECIST criteria for evaluating sorafenib treatment. Recently, Sung et al. (60) reported similar results that a low baseline tumor-to-liver SUV ratio (TLR) (<2.9) predicted longer OS and PFS (P<0.001 and P=0.023, respectively) and that differences in baseline TLR did not have a predictive value for evaluating tumor response using the mRECIST criteria.
To improve the standardization of measuring and reporting treatment responses, the EORTC introduced a consensus on measurement of tumor response based on FDG-PET in 1999 (61). The consensus suggested that ROIs should contain only viable areas and be consistent on subsequent analyses. Four categories of tumor response, including progressive metabolic disease (PMD), stable metabolic disease (SMD), partial metabolic response (PMR) and complete metabolic response (CMR), were defined based on percentage changes in FDG uptake and the appearance of new uptake sites. In 2009, PET Response Criteria in Solid Tumors (PERCIST) was proposed with a more stringent response classification and more detailed requirements for measuring tumor response, such as recommendations for the number of lesions that should be measured and the timing of PET scans (62).
However, the application of PERCIST is hindered by the following limitations: 1) the sensitivity of FDG-PET for detecting HCC is relatively poor (50%–70%); and 2) FDG accumulation in HCC is influenced by cellular differentiation and FDG-6-phosphatase activity (63). Therefore, further studies are needed to validate the role of PET for measuring tumor response, and the high-cost of PET also needs to be considered in the application of this imaging modality.
Diffusion-weighted imaging (DWI) and intravoxel incoherent motion (IVIM)
DWI is a specific functional MRI technique based on the assessment of Brownian motion (random thermal diffusion) of water molecules in tissue, thus providing information on biophysical properties of tissues, such as cell density, tissue organization and cellular membrane integrity (64). The apparent diffusion coefficient (ADC) is a parameter used in DWI to quantify the water content acquired through gradient duration and amplitude (b-values). A lower ADC value is considered to be correlated with higher expression of antiapoptotic and proliferative biomarkers that represent tumor viability (65). Recently, IVIM, which is a DWI-derived technique, has been introduced for liver imaging. Compared with the monoexponential model used in DWI, a biexponential model involving MRI signals and b values is employed in the IVIM theory, which makes it possible to simultaneously evaluate the perfusion-related diffusivity [demonstrated by the perfusion-related diffusion (D*) and the perfusion fraction (f)] and pure molecular diffusivity [demonstrated by the pure diffusion coefficient (D)]. Viable lesions show significantly different D values compared with necrotic or fibrotic tissues (66).
Schraml et al. (67) evaluated 10 patients with advanced HCC and revealed that tumor lesions exhibiting decreases in ADC values 2–4 weeks after sorafenib treatment showed increases in ADC values 2–3 months later, followed by continuous decreases more than 3 months after the onset of treatment, which could be explained by hemorrhage, necrosis and tumor progression, respectively. Later on, significant effort was devoted to investigating signal changes in DWI or IVIM after sorafenib treatment in mouse models of HCC. As mentioned earlier, transient vascular normalization can be induced by anti-VEGF treatment. A preclinical study demonstrated that increased ADC values were identified in the periphery of tumor lesions along with viable tumor cells and dilated blood vessels on histology at 10, 14 and 18 days after sorafenib treatment (68). A possible explanation is that normalization of the tumor vasculature supplies sufficient blood flow and oxygen, resulting in increased motion of water molecules and tumor cell growth. Recently, Yang et al. (69) reported that the ADC and D values of tumor lesions were significantly higher than the control group at 7, 14 and 21 days after sorafenib treatment, while f significantly decreased at day 7 and then mildly and significantly increased at day 14 and day 21 in the treatment group. The necrotic fraction of the tumor was correlated with the ADC, D and f values, while neither the ADC nor the IVIM parameters were found to be correlated with the microvascular density (MVD). However, Lee et al. (70) reported a decrease in f values in the tumor periphery zone 12 days after sorafenib treatment, while there was no significant difference between pre- and post-treatment f values of the whole tumor. Neither the periphery zone nor the whole tumor exhibited significantly different ADC values after treatment. This inconsistency may be attributed to the complex tumor cell pathophysiological processes at different timepoints when data were acquired. These data suggest that significantly increased or decreased ADC values both indicate the presence of a treatment response. Another study reported ultra-early parameter changes following sorafenib treatment in ADC and D values, which showed significant decreases one hour after treatment and remained at lower level until 12 h after treatment and then recovered to baseline levels at 24 h post-treatment (71). These findings may be explained by the presence of swollen mitochondria at one hour post-treatment and progressively swollen mitochondria as well as the accumulation of autophagosomes from 1 to 12 h post-treatment, as observed by electron microscopy, followed by diffuse patchy necrosis, as identified by light microscopy.
One prospective study demonstrated that the baseline D values of responders (CR, PR and SD according to the mRECIST criteria) to sorafenib were significantly higher than those of nonresponders and that with 0.8 (10–3 mm2/s) used as a cut-off value, D values achieved a sensitivity and specificity of 100% and 67%, respectively, for predicting treatment responders (72).
DWI is a promising quantitative imaging technique for tumor response monitoring as no injection of contrast media is needed and the process of data acquirement is relatively simple. Nevertheless, the low reproducibility of measuring ADC values due to the different types of MRI systems, sequencing parameters, tumor location and size, and timing of measurements after treatment limit its application for evaluating tumor response (28). In addition, a consensus of treatment response categorization based on DWI needs to be established.
Perfusion imaging
The therapeutic effects of targeted antiangiogenic therapy can alter tissue perfusion. Parameters of perfusion imaging are acquired by computing temporal changes in tissue enhancement based on dynamic contrast-enhanced CT (DCE-CT) or MRI (63). Studies have investigated the value of perfusion parameters as imaging biomarkers for predicting the survival of patients receiving sorafenib for HCC. Zhu et al. (73) revealed that perfusion parameters including blood flow (BF), permeability surface area (PS), blood volume (BV) and mean transit time (MTT) on CT were altered (decreases in BF, PS and BV and increases in MTT) within days after the administration of antiangiogenic therapy in HCC; in addition, lower baseline MTT values and greater increases in MTT values following treatment were correlated with an unfavorable prognosis. Similarly, a higher baseline transfer constant (Ktrans) and a greater percentage decrease in Ktrans values in MRI after sorafenib treatment were predictors of favorable clinical outcome (74).
Recently, Nakamura et al. (75) reported that a pretreatment arterial perfusion (AP) of the HCC tumor lesion greater than 71.7 mL/(100 mL·min) using perfusion CT was significantly associated with better OS after sorafenib treatment. Another study also reported that responders (CR, PR and SD as assessed by the mRECIST criteria) showed significantly reduced hepatic perfusion and AP in tumor lesions measured by perfusion CT two months after sorafenib treatment, while nonresponders demonstrated no significant difference compared with baseline after treatment (76).
One study using 4-dimensional perfusion CT found that 5 out of 6 liver tumor lesions included in the study showed significant decreases in tumor perfusion compared with baseline one week after the onset of sorafenib treatment, which might support the hypothesis of vascular normalization after sorafenib treatment in that outlier case (77). However, Mule et al. (78) questioned whether perfusion CT could be replaced by dual-energy CT for evaluating the response to sorafenib or radioembolization in patients with advanced HCC. They reported that late-arterial iodine concentration was correlated with perfusion parameters including BV and arterial BF, suggesting that dual-energy CT could be a candidate imaging method for assessing the treatment response to sorafenib.
The value of contrast-enhanced ultrasonography (CEUS) for assessing the treatment response to sorafenib in HCC has been validated by recent studies. Shiozawa et al. (79) demonstrated that the intratumoral vascular architecture classified by microflow imaging and the mean arrival time of contrast agent from the reference point to the target lesion two weeks after treatment were correlated with OS (79,80).
Magnetic resonance spectroscopy (MRS)
MRS permits the identification and analysis of the concentration of metabolites or chemicals in tissues based on the chemical shift phenomenon (81). Protons (1H) are commonly used nuclei in MRS due to their wide availability and high signal-to-noise ratio (SNR), with the frequency of water as the standard peak. Studies have reported an elevation in choline, which is a cell membrane component, as well as in the choline/lipid ratio in HCC compared with normal liver and a decrease in choline levels after TACE treatment by using 1H MRS (82-84). Tumors demonstrated reduced levels of choline‐containing metabolites and inhibition of cell proliferation and increased apoptosis after targeted antiangiogenic treatment in mouse models (85). Promising as it is, the application of MRS in monitoring the treatment response in HCC is limited by the significant impact of motion-related artifacts and the limited voxel size of ROIs (81).
MR and ultrasound elastography
Elastography based on MRI or ultrasound has been developed to noninvasively evaluate the stiffness of tissues by measuring tissue responses to mechanical shear waves (86,87). Studies have demonstrated the value of elastography in predicting the risk of HCC in patients with chronic hepatitis B and in differentiating malignant from benign focal hepatic lesions, with significantly higher stiffness identified in malignant liver lesions (87-89). After radioembolization, malignant hepatic lesions became stiffer, suggesting tissue repairing and liver fibrosis after treatment (90). In a preclinical study, responders after sorafenib treatment tended to have an early decrease in the stiffness ratio while nonresponders showed an increase in the stiffness ratio using elastosonography (91). However, assessing the background stiffness can be difficult due to a high incidence of liver cirrhosis-related HCC and remarkable inter-observer variability (28,87).
Imaging markers to predict efficacy of sorafenib
Although sorafenib significantly prolonged the OS in patients with advanced HCC, more than 20% of patients were categorized as PD after treatment (6,7). Considering the high incidence of adverse effects and the high cost of sorafenib therapy, it is important to identify specific imaging signs that are predictive of whether an HCC patient is suitable for sorafenib treatment.
In perfusion imaging, it has been reported that a higher pretreatment Ktrans and MTT indicate favorable treatment response (PR and SD, as determined by the RECIST criteria) to antiangiogenic therapy in HCC (74,92). In IVIM imaging, it is controversial whether f or D values could potentially distinguish responders from nonresponders to sorafenib treatment in advanced HCC (72,93). In addition, a high visceral fat area measured by CT scans is a risk factor of progressive disease in HCC treated with sorafenib or brivanib (94). In patients with extrahepatic spread HCC, more than two extrahepatic lesions and peritoneal involvement increase the risk of radiologic progression (95). Careful validation in clinical trials is necessary before incorporating these imaging markers into clinical practice. Moreover, a comprehensive diagnostic system that includes all of the possible imaging risk factors should be established.
Comparisons between different imaging modalities for assessing treatment response to sorafenib
Perfusion imaging, in particular DCE-CT, has been the most frequently investigated and validated imaging method for assessing treatment responses to sorafenib in patients with advanced HCC currently. However, DCE-CT is associated with relatively high radiation exposure and increased intravenous contrast agent dosage, which limit its clinical applications. Noninvasive functional MRI techniques including DWI and IVIM have shown promising results in both animal models and clinical trials for evaluating the therapeutic effects of sorafenib in HCC, and thus, these modalities are considered alternative or supplementary methods to DCE-CT. FDG-PET, MRS, MR elastography and ultrasound elastography also show promise in characterizing sorafenib treatment responses. However, the data regarding the performances of these imaging modalities for assessing the treatment responses to sorafenib remain relatively scarce, and further studies are needed to refine and validate their clinical applications.
Conclusions
HCC is one of the leading causes of cancer-related death worldwide. Sorafenib significantly prolongs survival in patients with advanced HCC by inhibiting tumor angiogenesis and progression, which usually cause apparent tumor shrinkage and may alter tumor morphology. Noninvasive imaging methods have played a significant role in assessing therapeutic responses to sorafenib in HCC, and several standardized evaluation systems have been established. The criteria for measuring tumor burden based on viability have overcome some limitations of the criteria based on morphology, which seem to underestimate treatment responses of targeted therapy in HCC. The roles of some evolving imaging techniques in monitoring tumor response to sorafenib are currently being validated. In addition, recent advances have shown that several imaging markers can be predictive of prognosis in advanced HCC after sorafenib treatment. Nevertheless, careful validation in large clinical trials is necessary before incorporating these imaging biomarkers into clinical practice.
Acknowledgements
This study was supported by the National Natural Science Foundation of China (No. 81471658) and the Science and Technology Support Program of Sichuan Province (No. 2017SZ0003).
Footnote
Conflicts of Interest: The authors have no conflicts of interests to declare.
References
- Torre LA, Bray F, Siegel RL, et al. Global cancer statistics, 2012. CA Cancer J Clin 2015;65:87–108. [PubMed] DOI:10.3322/caac.21262
- London WT MK. Cancer epidemiology and prevention. 3rd edition. New York: Oxford University Press, 2006.
- Bruix J, Sherman M, American Association for the Study of Liver Diseases. Management of hepatocellular carcinoma: an update. Hepatology 2011;53:1020–2. [PubMed] DOI:10.1002/hep.24199
- European Association For The Study Of The Liver, European Organisation For Research And Treatment Of Cancer. EASL-EORTC clinical practice guidelines: management of hepatocellular carcinoma. J Hepatol 2012;56:908–43. [PubMed] DOI:10.1016/j.jhep.2011.12.001
- Forner A, Llovet JM, Bruix J. Hepatocellular carcinoma. Lancet 2012;379:1245–55. [PubMed] DOI:10.1016/S0140-6736(11)61347-0
- Llovet JM, Ricci S, Mazzaferro V, et al. Sorafenib in advanced hepatocellular carcinoma. N Engl J Med 2008;359:378–90. [PubMed] DOI:10.1056/NEJMoa0708857
- Cheng AL, Kang YK, Chen Z, et al. Efficacy and safety of sorafenib in patients in the Asia-Pacific region with advanced hepatocellular carcinoma: a phase III randomised, double-blind, placebo-controlled trial. Lancet Oncol 2009;10:25–34. [PubMed] DOI:10.1016/S1470-2045(08)70285-7
- Llovet JM, Bruix J. Molecular targeted therapies in hepatocellular carcinoma. Hepatology 2008;48:1312–27. [PubMed] DOI:10.1002/hep.22506
- Folkman J. Tumor angiogenesis: therapeutic implications. N Engl J Med 1971;285:1182–6. [PubMed] DOI:10.1056/NEJM197111182852108
- Torres Filho IP, Leunig M, Yuan F, et al. Noninvasive measurement of microvascular and interstitial oxygen profiles in a human tumor in SCID mice. Proc Natl Acad Sci U S A 1994;91:2081–5. [PubMed] DOI:10.1073/pnas.91.6.2081
- Naumov GN, Akslen LA, Folkman J. Role of angiogenesis in human tumor dormancy: animal models of the angiogenic switch. Cell Cycle 2006;5:1779–87. [PubMed] DOI:10.4161/cc.5.16.3018
- Carmeliet P, Jain RK. Molecular mechanisms and clinical applications of angiogenesis. Nature 2011;473:298–307. [PubMed] DOI:10.1038/nature10144
- Weis SM, Cheresh DA. Tumor angiogenesis: molecular pathways and therapeutic targets. Nat Med 2011;17:1359–70. [PubMed] DOI:10.1038/nm.2537
- Goel S, Wong AH, Jain RK. Vascular normalization as a therapeutic strategy for malignant and nonmalignant disease. Cold Spring Harb Perspect Med 2012;2:a006486. [PubMed] DOI:10.1101/cshperspect.a006486
- Jain RK. Molecular regulation of vessel maturation. Nat Med 2003;9:685–93. [PubMed] DOI:10.1038/nm0603-685
- Bottaro DP, Liotta LA. Cancer: Out of air is not out of action. Nature 2003;423:593–5. [PubMed] DOI:10.1038/423593a
- Folkman J. Role of angiogenesis in tumor growth and metastasis. Semin Oncol 2002;29:15–8. [PubMed] DOI:10.1053/sonc.2002.37263
- Wilhelm SM, Carter C, Tang L, et al. BAY 43-9006 exhibits broad spectrum oral antitumor activity and targets the RAF/MEK/ERK pathway and receptor tyrosine kinases involved in tumor progression and angiogenesis. Cancer Res 2004;64:7099–109. [PubMed] DOI:10.1158/0008-5472.CAN-04-1443
- Jayson GC, Kerbel R, Ellis LM, et al. Antiangiogenic therapy in oncology: current status and future directions. Lancet 2016;388:518–29. [PubMed] DOI:10.1016/S0140-6736(15)01088-0
- Weis SM, Cheresh DA. Pathophysiological consequences of VEGF-induced vascular permeability. Nature 2005;437:497–504. [PubMed] DOI:10.1038/nature03987
- Heath VL, Bicknell R. Anticancer strategies involving the vasculature. Nat Rev Clin Oncol 2009;6:395–404. [PubMed] DOI:10.1038/nrclinonc.2009.52
- Yuan F, Chen Y, Dellian M, et al. Time-dependent vascular regression and permeability changes in established human tumor xenografts induced by an anti-vascular endothelial growth factor/vascular permeability factor antibody. Proc Natl Acad Sci U S A 1996;93:14765–70. [PubMed] DOI:10.1073/pnas.93.25.14765
- Winkler F, Kozin SV, Tong RT, et al. Kinetics of vascular normalization by VEGFR2 blockade governs brain tumor response to radiation: role of oxygenation, angiopoietin-1, and matrix metalloproteinases. Cancer Cell 2004;6:553–63. [PubMed] DOI:10.1016/j.ccr.2004.10.011
- El-Maraghi RH, Eisenhauer EA. Review of phase II trial designs used in studies of molecular targeted agents: outcomes and predictors of success in phase III. J Clin Oncol 2008;26:1346–54. [PubMed] DOI:10.1200/JCO.2007.13.5913
- Miller AB, Hoogstraten B, Staquet M, et al. Reporting results of cancer treatment. Cancer 1981;47:207–14. [PubMed] DOI:10.1002/1097-0142(19810101)47:1<207::AID-CNCR2820470134>3.0.CO;2-6
- Therasse P, Arbuck SG, Eisenhauer EA, et al. New guidelines to evaluate the response to treatment in solid tumors. European Organization for Research and Treatment of Cancer, National Cancer Institute of the United States, National Cancer Institute of Canada. J Natl Cancer Inst 2000;92:205–16. [PubMed] DOI:10.1093/jnci/92.3.205
- Eisenhauer EA, Therasse P, Bogaerts J, et al. New response evaluation criteria in solid tumours: revised RECIST guideline (version 11.1). Eur J Cancer, 2009;45:228–47. [PubMed] DOI:10.1016/j.ejca.2008.10.026
- Gonzalez-Guindalini FD, Botelho MP, Harmath CB, et al. Assessment of liver tumor response to therapy: role of quantitative imaging. Radiographics 2013;33:1781–800. [PubMed] DOI:10.1148/rg.336135511
- Mazumdar M, Smith A, Schwartz LH. A statistical simulation study finds discordance between WHO criteria and RECIST guideline. J Clin Epidemiol 2004;57:358–65. [PubMed] DOI:10.1016/j.jclinepi.2003.07.015
- Mazumdar M, Smith A, Debroy PP, et al. A theoretical approach to choosing the minimum number of multiple tumors required for assessing treatment response. J Clin Epidemiol 2005;58:150–3. [PubMed] DOI:10.1016/j.jclinepi.2004.08.007
- Nishino M, Jagannathan JP, Ramaiya NH, et al. Revised RECIST guideline version 1.1: What oncologists want to know and what radiologists need to know. AJR Am J Roentgenol 2010;195:281–9. [PubMed] DOI:10.2214/AJR.09.4110
- Lencioni R, Llovet JM. Modified RECIST (mRECIST) assessment for hepatocellular carcinoma. Semin Liver Dis 2010;30:52–60. [PubMed] DOI:10.1055/s-0030-1247132
- Mantatzis M, Kakolyris S, Amarantidis K, et al. Treatment response classification of liver metastatic disease evaluated on imaging. Are RECIST unidimensional measurements accurate?. Eur Radiol 2009;19:1809–16. [PubMed] DOI:10.1007/s00330-009-1327-4
- Welsh JL, Bodeker K, Fallon E, et al. Comparison of response evaluation criteria in solid tumors with volumetric measurements for estimation of tumor burden in pancreatic adenocarcinoma and hepatocellular carcinoma. Am J Surg 2012;204:580–5. [PubMed] DOI:10.1016/j.amjsurg.2012.07.007
- Tacher V, Lin M, Duran R, et al. Comparison of existing response criteria in patients with hepatocellular carcinoma treated with transarterial chemoembolization using a 3D quantitative approach. Radiology 2016;278:275–84. [PubMed] DOI:10.1148/radiol.2015142951
- Chapiro J, Duran R, Lin M, et al. Identifying staging markers for hepatocellular carcinoma before transarterial chemoembolization: comparison of three-dimensional quantitative versus non-three-dimensional imaging markers. Radiology 2015;275:438–47. [PubMed] DOI:10.1148/radiol.14141180
- Bargellini I, Scionti A, Mismas V, et al. Identification of responders to sorafenib in hepatocellular carcinoma: is tumor volume measurement the way forward?. Oncology 2014;86:191–8. [PubMed] DOI:10.1159/000358599
- Lencioni R. Loco-regional treatment of hepatocellular carcinoma. Hepatology 2010;52:762–73. [PubMed] DOI:10.1002/hep.23725
- Llovet JM, Bruix J. Systematic review of randomized trials for unresectable hepatocellular carcinoma: Chemoembolization improves survival. Hepatology 2003;37:429–42. [PubMed] DOI:10.1053/jhep.2003.50047
- Lim HK, Choi D, Lee WJ, et al. Hepatocellular carcinoma treated with percutaneous radio-frequency ablation: evaluation with follow-up multiphase helical CT. Radiology 2001;221:447–54. [PubMed] DOI:10.1148/radiol.2212010446
- Bruix J, Sherman M, Llovet JM, et al. Clinical management of hepatocellular carcinoma. Conclusions of the Barcelona-2000 EASL conference. European Association for the Study of the Liver. J Hepatol 2001;35:421–30. [PubMed]
- Memon K, Kulik L, Lewandowski RJ, et al. Radiographic response to locoregional therapy in hepatocellular carcinoma predicts patient survival times. Gastroenterology 2011;141:526–35, 535. e1-2. [PubMed] DOI:10.1053/j.gastro.2011.04.054
- Shim JH, Lee HC, Kim SO, et al. Which response criteria best help predict survival of patients with hepatocellular carcinoma following chemoembolization? A validation study of old and new models. Radiology 2012;262:708–18. [PubMed] DOI:10.1148/radiol.11110282
- Jeon MY, Lee HW, Kim BK, et al. Reproducibility of European Association for the Study of the Liver criteria and modified Response Evaluation Criteria in Solid Tumors in patients treated with sorafenib. Liver Int 2018. [PubMed] DOI:10.1111/liv.13731
- Edeline J, Boucher E, Rolland Y, et al. Comparison of tumor response by Response Evaluation Criteria in Solid Tumors (RECIST) and modified RECIST in patients treated with sorafenib for hepatocellular carcinoma. Cancer 2012;118:147–56. [PubMed] DOI:10.1002/cncr.26255
- Takada J, Hidaka H, Nakazawa T, et al. Modified response evaluation criteria in solid tumors is superior to response evaluation criteria in solid tumors for assessment of responses to sorafenib in patients with advanced hepatocellular carcinoma. BMC Res Notes 2015;8:609. [PubMed] DOI:10.1186/s13104-015-1565-2
- Lencioni R, Montal R, Torres F, et al. Objective response by mRECIST as a predictor and potential surrogate end-point of overall survival in advanced HCC. J Hepatol 2017;66:1166–72. [PubMed] DOI:10.1016/j.jhep.2017.01.012
- Joensuu H, Roberts PJ, Sarlomo-Rikala M, et al. Effect of the tyrosine kinase inhibitor STI571 in a patient with a metastatic gastrointestinal stromal tumor. N Engl J Med 2001;344:1052–6. [PubMed] DOI:10.1056/NEJM200104053441404
- Choi H, Charnsangavej C, de Castro Faria S, et al. CT evaluation of the response of gastrointestinal stromal tumors after imatinib mesylate treatment: a quantitative analysis correlated with FDG PET findings. AJR Am J Roentgenol 2004;183:1619–28. [PubMed] DOI:10.2214/ajr.183.6.01831619
- Choi H, Charnsangavej C, Faria SC, et al. Correlation of computed tomography and positron emission tomography in patients with metastatic gastrointestinal stromal tumor treated at a single institution with imatinib mesylate: proposal of new computed tomography response criteria. J Clin Oncol 2007;25:1753–9. [PubMed] DOI:10.1200/JCO.2006.07.3049
- Ronot M, Bouattour M, Wassermann J, et al. Alternative Response Criteria (Choi, European association for the study of the liver, and modified Response Evaluation Criteria in Solid Tumors[RECIST]) Versus RECIST 1.1 in patients with advanced hepatocellular carcinoma treated with sorafenib. Oncologist 2014;19:394–402. [PubMed] DOI:10.1634/theoncologist.2013-0114
- Gavanier M, Ayav A, Sellal C, et al. CT imaging findings in patients with advanced hepatocellular carcinoma treated with sorafenib: Alternative response criteria (Choi, European Association for the Study of the Liver, and modified Response Evaluation Criteria in Solid Tumor (mRECIST)) versus RECIST 1.1. Eur J Radiol 2016;85:103–12. [PubMed] DOI:10.1016/j.ejrad.2015.10.024
- Faivre S, Zappa M, Vilgrain V, et al. Changes in tumor density in patients with advanced hepatocellular carcinoma treated with sunitinib. Clin Cancer Res 2011;17:4504–12. [PubMed] DOI:10.1158/1078-0432.CCR-10-1708
- Kudo M, Kubo S, Takayasu K, et al. Response Evaluation Criteria in Cancer of the Liver (RECICL) proposed by the Liver Cancer Study Group of Japan (2009 Revised Version). Hepatol Res 2010;40:686–92. [PubMed] DOI:10.1111/j.1872-034X.2010.00674.x
- Kudo M, Ueshima K, Kubo S, et al. Response Evaluation Criteria in Cancer of the Liver (RECICL) (2015 Revised version). Hepatol Res 2016;46:3–9. [PubMed] DOI:10.1111/hepr.12542
- Arizumi T, Ueshima K, Takeda H, et al. Comparison of systems for assessment of post-therapeutic response to sorafenib for hepatocellular carcinoma. J Gastroenterol 2014;49:1578–87. [PubMed] DOI:10.1007/s00535-014-0936-0
- Herholz K, Rudolf J, Heiss WD. FDG transport and phosphorylation in human gliomas measured with dynamic PET. J Neurooncol 1992;12:159–65. [PubMed] DOI:10.1007/BF00172667
- Song MJ, Bae SH, Yoo Ie R, et al. Predictive value of 18F-fluorodeoxyglucose PET/CT for transarterial chemolipiodolization of hepatocellular carcinoma . World J Gastroenterol 2012;18:3215–22. [PubMed] DOI:10.3748/wjg.v18.i25.3215
- Lee JH, Park JY, Kim DY, et al. Prognostic value of 18F-FDG PET for hepatocellular carcinoma patients treated with sorafenib . Liver Int 2011;31:1144–9. [PubMed] DOI:10.1111/j.1478-3231.2011.02541.x
- Sung PS, Park HL, Yang K, et al. 18F-fluorodeoxyglucose uptake of hepatocellular carcinoma as a prognostic predictor in patients with sorafenib treatment. Eur J Nucl Med Mol Imaging 2018;45:384–91. [PubMed] DOI:10.1007/s00259-017-3871-5
- Young H, Baum R, Cremerius U, et al. Measurement of clinical and subclinical tumour response using[18F]-fluorodeoxyglucose and positron emission tomography: review and 1999 EORTC recommendations. European Organization for Research and Treatment of Cancer (EORTC) PET Study Group. Eur J Cancer 1999;35:1773–82. [PubMed] DOI:10.1016/S0959-8049(99)00229-4
- Wahl RL, Jacene H, Kasamon Y, et al. From RECIST to PERCIST: Evolving Considerations for PET response criteria in solid tumors. J Nucl Med 2009;50 Suppl 1:122S–50S. [PubMed] DOI:10.2967/jnumed.108.057307
- Jiang T, Zhu AX, Sahani DV. Established and novel imaging biomarkers for assessing response to therapy in hepatocellular carcinoma. J Hepatol 2013;58:169–77. [PubMed] DOI:10.1016/j.jhep.2012.08.022
- Padhani AR, Khan AA. Diffusion-weighted (DW) and dynamic contrast-enhanced (DCE) magnetic resonance imaging (MRI) for monitoring anticancer therapy. Target Oncol 2010;5:39–52. [PubMed] DOI:10.1007/s11523-010-0135-8
- Heijmen L, Ter Voert EE, Nagtegaal ID, et al. Diffusion-weighted MR imaging in liver metastases of colorectal cancer: reproducibility and biological validation. Eur Radiol 2013;23:748–56. [PubMed] DOI:10.1007/s00330-012-2654-4
- Wagner M, Doblas S, Daire JL, et al. Diffusion-weighted MR imaging for the regional characterization of liver tumors. Radiology 2012;264:464–72. [PubMed] DOI:10.1148/radiol.12111530
- Schraml C, Schwenzer NF, Martirosian P, et al. Diffusion-weighted MRI of advanced hepatocellular carcinoma during sorafenib treatment: initial results. AJR Am J Roentgenol 2009;193:W301–7. [PubMed] DOI:10.2214/AJR.08.2289
- Zhao YL, Guo QQ, Yang GR, et al. Early changes in apparent diffusion coefficient as an indicator of response to sorafenib in hepatocellular carcinoma. J Zhejiang Univ Sci B 2014;15:713–9. [PubMed] DOI:10.1631/jzus.B1400010
- Yang SH, Lin J, Lu F, et al. Evaluation of antiangiogenic and antiproliferative effects of sorafenib by sequential histology and intravoxel incoherent motion diffusion-weighted imaging in an orthotopic hepatocellular carcinoma xenograft model. J Magn Reson Imaging 2017;45:270–80. [PubMed] DOI:10.1002/jmri.25344
- Lee Y, Lee SS, Cheong H, et al. Intravoxel incoherent motion MRI for monitoring the therapeutic response of hepatocellular carcinoma to sorafenib treatment in mouse xenograft tumor models. Acta Radiol 2017;58:1045–53. [PubMed] DOI:10.1177/0284185116683576
- Chen X, Ma Z, Huang Y, et al. Multiparametric MR diffusion-weighted imaging for monitoring the ultra-early treatment effect of sorafenib in human hepatocellular carcinoma xenografts. J Magn Reson Imaging 2017;46:248–56. [PubMed] DOI:10.1002/jmri.25527
- Shirota N, Saito K, Sugimoto K, et al. Intravoxel incoherent motion MRI as a biomarker of sorafenib treatment for advanced hepatocellular carcinoma: a pilot study. Cancer Imaging 2016;16:1. [PubMed] DOI:10.1186/s40644-016-0059-3
- Zhu AX, Holalkere NS, Muzikansky A, et al. Early antiangiogenic activity of bevacizumab evaluated by computed tomography perfusion scan in patients with advanced hepatocellular carcinoma. Oncologist 2008;13:120–5. [PubMed] DOI:10.1634/theoncologist.2007-0174
- Hsu CY, Shen YC, Yu CW, et al. Dynamic contrast-enhanced magnetic resonance imaging biomarkers predict survival and response in hepatocellular carcinoma patients treated with sorafenib and metronomic tegafur/uracil. J Hepatol 2011;55:858–65. [PubMed] DOI:10.1016/j.jhep.2011.01.032
- Nakamura Y, Kawaoka T, Higaki T, et al. Hepatocellular carcinoma treated with sorafenib: Arterial tumor perfusion in dynamic contrast-enhanced CT as early imaging biomarkers for survival. Eur J Radiol 2018;98:41–9. [PubMed] DOI:10.1016/j.ejrad.2017.10.017
- Ippolito D, Querques G, Okolicsanyi S, et al. Diagnostic value of dynamic contrast-enhanced CT with perfusion imaging in the quantitative assessment of tumor response to sorafenib in patients with advanced hepatocellular carcinoma: A feasibility study. Eur J Radiol 2017;90:34–41. [PubMed] DOI:10.1016/j.ejrad.2017.02.027
- Coolens C, Driscoll B, Moseley J, et al. Feasibility of 4D perfusion CT imaging for the assessment of liver treatment response following SBRT and sorafenib. Adv Radiat Oncol 2016;1:194–203. [PubMed] DOI:10.1016/j.adro.2016.06.004
- Mule S, Pigneur F, Quelever R, et al. Can dual-energy CT replace perfusion CT for the functional evaluation of advanced hepatocellular carcinoma?. Eur Radiol 2018;28:1977–85. [PubMed] DOI:10.1007/s00330-017-5151-y
- Shiozawa K, Watanabe M, Ikehara T, et al. Evaluation of sorafenib for advanced hepatocellular carcinoma with low α-fetoprotein in arrival time parametric imaging using contrast-enhanced ultrasonography. J Med Ultrason (2001) 2017;44:101–7. [PubMed] DOI:10.1007/s10396-016-0757-2
- Shiozawa K, Watanabe M, Ikehara T, et al. Therapeutic evaluation of sorafenib for hepatocellular carcinoma using contrast-enhanced ultrasonography: Preliminary result. Oncol Lett 2016;12:579–84. [PubMed] DOI:10.3892/ol.2016.4669
- Qayyum A. MR spectroscopy of the liver: principles and clinical applications. Radiographics 2009;29:1653–64. [PubMed] DOI:10.1148/rg.296095520
- Li CW, Kuo YC, Chen CY, et al. Quantification of choline compounds in human hepatic tumors by proton MR spectroscopy at 3 T. Magn Reson Med 2005;53:770–6. [PubMed] DOI:10.1002/mrm.20412
- Wang D, Li Y. 1H magnetic resonance spectroscopy predicts hepatocellular carcinoma in a subset of patients with liver cirrhosis: A randomized trial. Medicine (Baltimore) 2015;94:e1066. [PubMed] DOI:10.1097/MD.0000000000001066
- Chen CY, Li CW, Kuo YT, et al. Early response of hepatocellular carcinoma to transcatheter arterial chemoembolization: choline levels and MR diffusion constants — initial experience. Radiology 2006;239:448–56. [PubMed] DOI:10.1148/radiol.2392042202
- Yang J, Song KD, Kim JH, et al. Characterization of brivanib therapy response in hepatocellular carcinoma xenografts using 1H HR-MAS spectroscopy and histopathology . Mol Med Rep 2013;8:1425–31. [PubMed] DOI:10.3892/mmr.2013.1690
- Muthupillai R, Lomas DJ, Rossman PJ, et al. Magnetic resonance elastography by direct visualization of propagating acoustic strain waves. Science 1995;269:1854–7. [PubMed] DOI:10.1126/science.7569924
- Lu Q, Ling W, Lu C, et al. Hepatocellular carcinoma: stiffness value and ratio to discriminate malignant from benign focal liver lesions. Radiology 2015;275:880–8. [PubMed] DOI:10.1148/radiol.14131164
- Kim MN, Kim SU, Kim BK, et al. Increased risk of hepatocellular carcinoma in chronic hepatitis B patients with transient elastography-defined subclinical cirrhosis. Hepatology 2015;61:1851–9. [PubMed] DOI:10.1002/hep.27735
- Hennedige TP, Hallinan JT, Leung FP, et al. Comparison of magnetic resonance elastography and diffusion-weighted imaging for differentiating benign and malignant liver lesions. Eur Radiol 2016;26:398–406. [PubMed] DOI:10.1007/s00330-015-3835-8
- Bas A, Samanci C, Gulsen F, et al. Evaluation of liver stiffness after radioembolization by Real-Time ShearWaveTM Elastography: preliminary study . Cardiovasc Intervent Radiol 2015;38:957–63. [PubMed] DOI:10.1007/s00270-014-1021-z
- Salvatore V, Baron Toaldo M, Marinelli S, et al. Early prediction of treatment response to sorafenib with elastosonography in a mice xenograft model of hepatocellular carcinoma: a proof-of-concept study. Ultraschall Med 2013;34:541–9. [PubMed] DOI:10.1055/s-0033-1355834
- Jiang T, Kambadakone A, Kulkarni NM, et al. Monitoring response to antiangiogenic treatment and predicting outcomes in advanced hepatocellular carcinoma using image biomarkers, CT perfusion, tumor density, and tumor size (RECIST). Invest Radiol 2012;47:11–7. [PubMed] DOI:10.1097/RLI.0b013e3182199bb5
- Lewin M, Fartoux L, Vignaud A, et al. The diffusion-weighted imaging perfusion fraction f is a potential marker of sorafenib treatment in advanced hepatocellular carcinoma: a pilot study. Eur Radiol 2011;21:281–90. [PubMed] DOI:10.1007/s00330-010-1914-4
- Nault JC, Pigneur F, Nelson AC, et al. Visceral fat area predicts survival in patients with advanced hepatocellular carcinoma treated with tyrosine kinase inhibitors. Dig Liver Dis 2015;47:869–76. [PubMed] DOI:10.1016/j.dld.2015.07.001
- Sohn W, Paik YH, Cho JY, et al. Sorafenib therapy for hepatocellular carcinoma with extrahepatic spread: treatment outcome and prognostic factors. J Hepatol 2015;62:1112–21. [PubMed] DOI:10.1016/j.jhep.2014.12.009